


Fig. 3.
Download original image
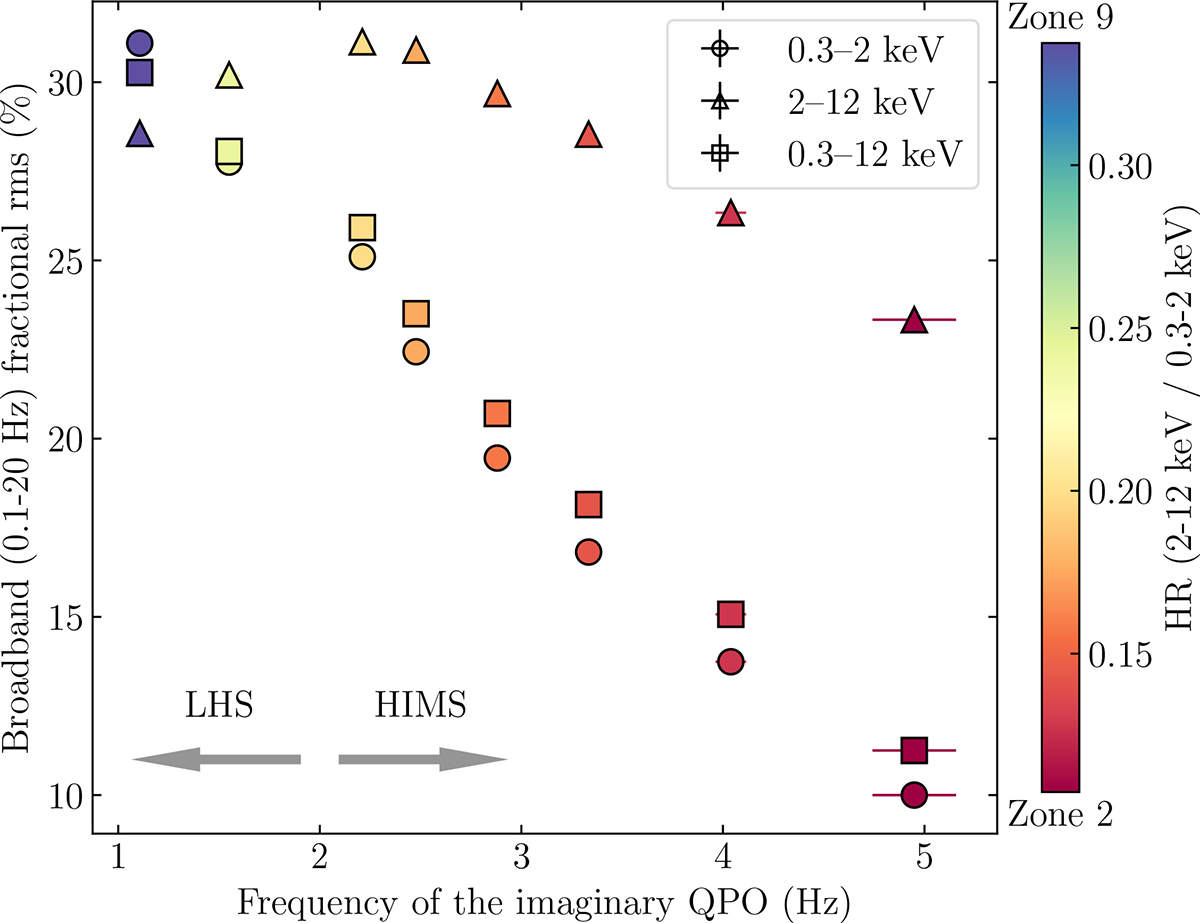
Frequency of the imaginary QPO vs the 0.1 − 20 Hz broadband fractional rms in the 0.3 − 2 keV (circles), 2 − 12 keV (triangles), and 0.3 − 12 keV (squares) energy bands derived from our model. Each point represents the observation in a zone. The colour bar indicates the evolution of the HR across all zones. The two grey arrows separate the observations in the LHS (left) and HIMS (right).
Current usage metrics show cumulative count of Article Views (full-text article views including HTML views, PDF and ePub downloads, according to the available data) and Abstracts Views on Vision4Press platform.
Data correspond to usage on the plateform after 2015. The current usage metrics is available 48-96 hours after online publication and is updated daily on week days.
Initial download of the metrics may take a while.