


Fig. 2.
Download original image
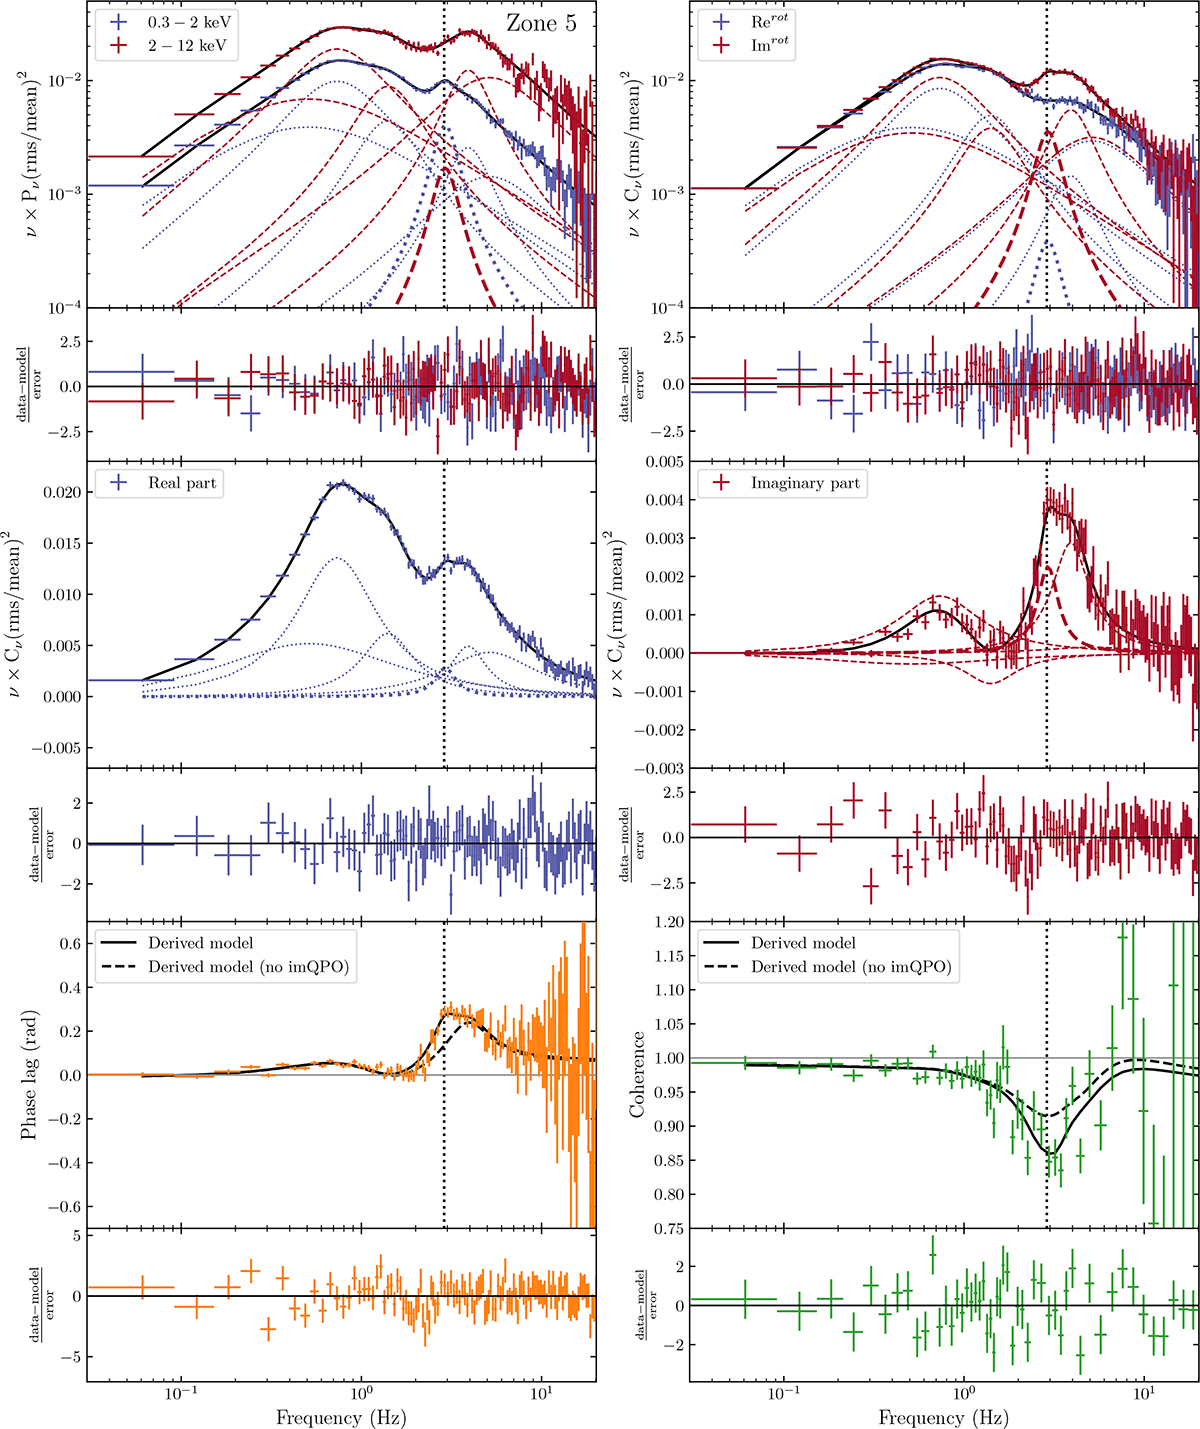
Simultaneous fitting of the PDS and CS of AT2019wey with a multi-Lorentzian model assuming constant phase lags, using the combined NICER data in zone 5 as an example. Top panels: Best fits (solid black lines) and residuals for the PDS (left panel) in the 0.3 − 2 keV (blue) and 2 − 12 keV (red) bands, and to the real (blue) and imaginary (red) parts of the CS rotated by 45° (right panel). Middle panels: Real (left) and imaginary (right) parts of the non-rotated CS, showing a linear scale on the y-axis. Each model consists of six Lorentzian components; the one corresponding to the imaginary QPO is highlighted with thicker lines. Bottom panels: Phase-lag (left) and coherence-function (right) frequency spectra, along with their residuals with respect to the model derived (solid black curves) from the simultaneous fitting of PDS and non-rotated CS. The dashed black curves show the derived model without the imaginary QPO and without refitting. We rebinned the plots by a factor of 5 to improve the visibility of the dip in the coherence function.
Current usage metrics show cumulative count of Article Views (full-text article views including HTML views, PDF and ePub downloads, according to the available data) and Abstracts Views on Vision4Press platform.
Data correspond to usage on the plateform after 2015. The current usage metrics is available 48-96 hours after online publication and is updated daily on week days.
Initial download of the metrics may take a while.