


Fig. 1.
Download original image
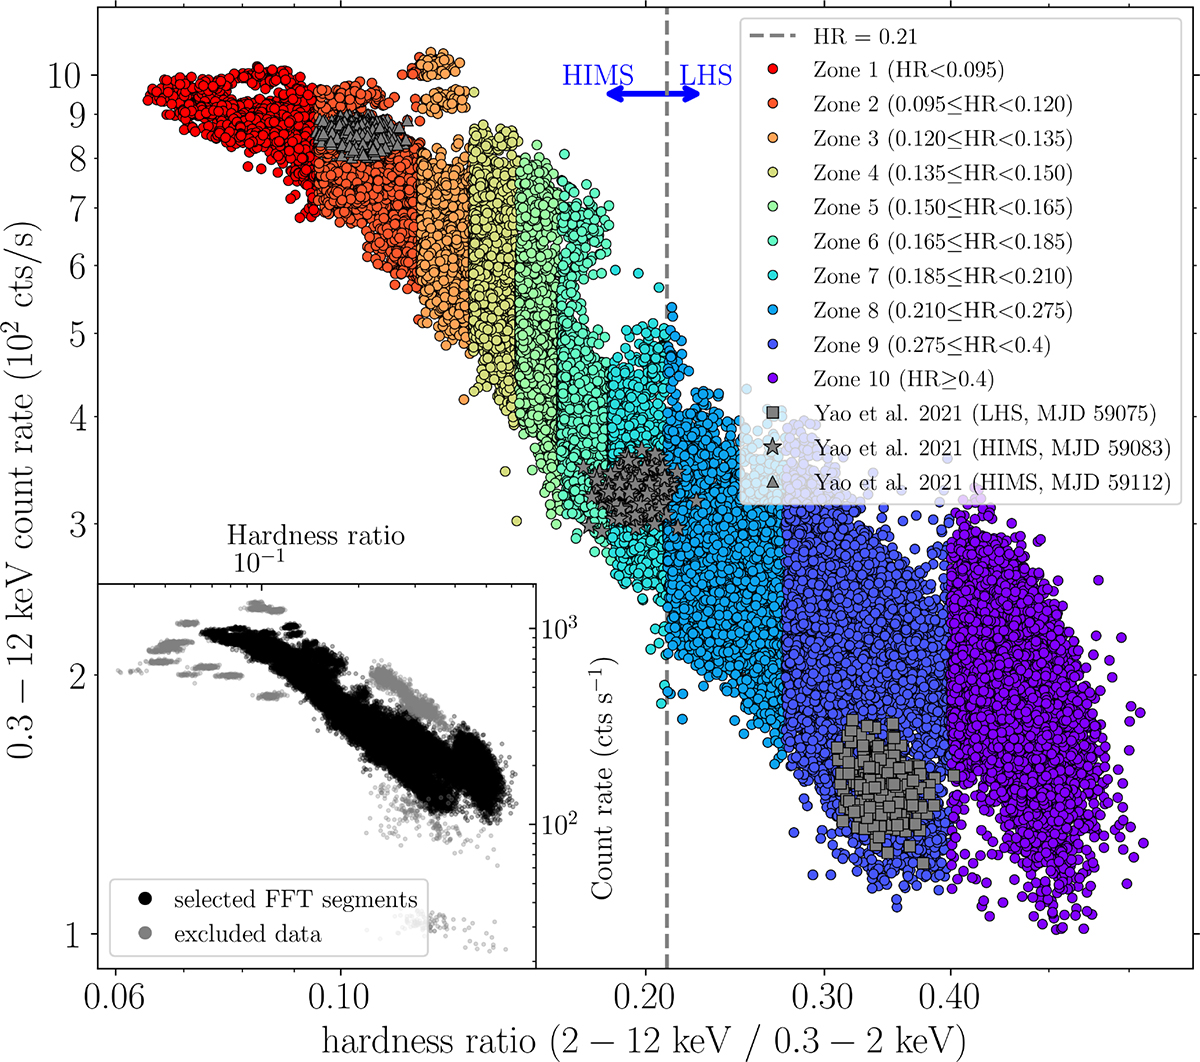
HID constructed from the NICER observations of AT2019wey between August 9, 2020, and May 7, 2025. Each data point represents a 16.384 s segment. Main panel: Ten colour-coded regions corresponding to the data groups defined by hardness intervals and used in this work. The grey squares, grey stars, and grey triangles mark the three epochs analysed by Yao et al. (2021a), identified as the LHS (grey squares) and HIMS (grey stars and triangles), respectively. The vertical dashed line at HR = 0.21 roughly separates the LHS from the HIMS. Inset panel: Data used in our analysis (black points; same as that in the main panel), along with data excluded from our analysis (grey points).
Current usage metrics show cumulative count of Article Views (full-text article views including HTML views, PDF and ePub downloads, according to the available data) and Abstracts Views on Vision4Press platform.
Data correspond to usage on the plateform after 2015. The current usage metrics is available 48-96 hours after online publication and is updated daily on week days.
Initial download of the metrics may take a while.