


Fig. 5
Download original image
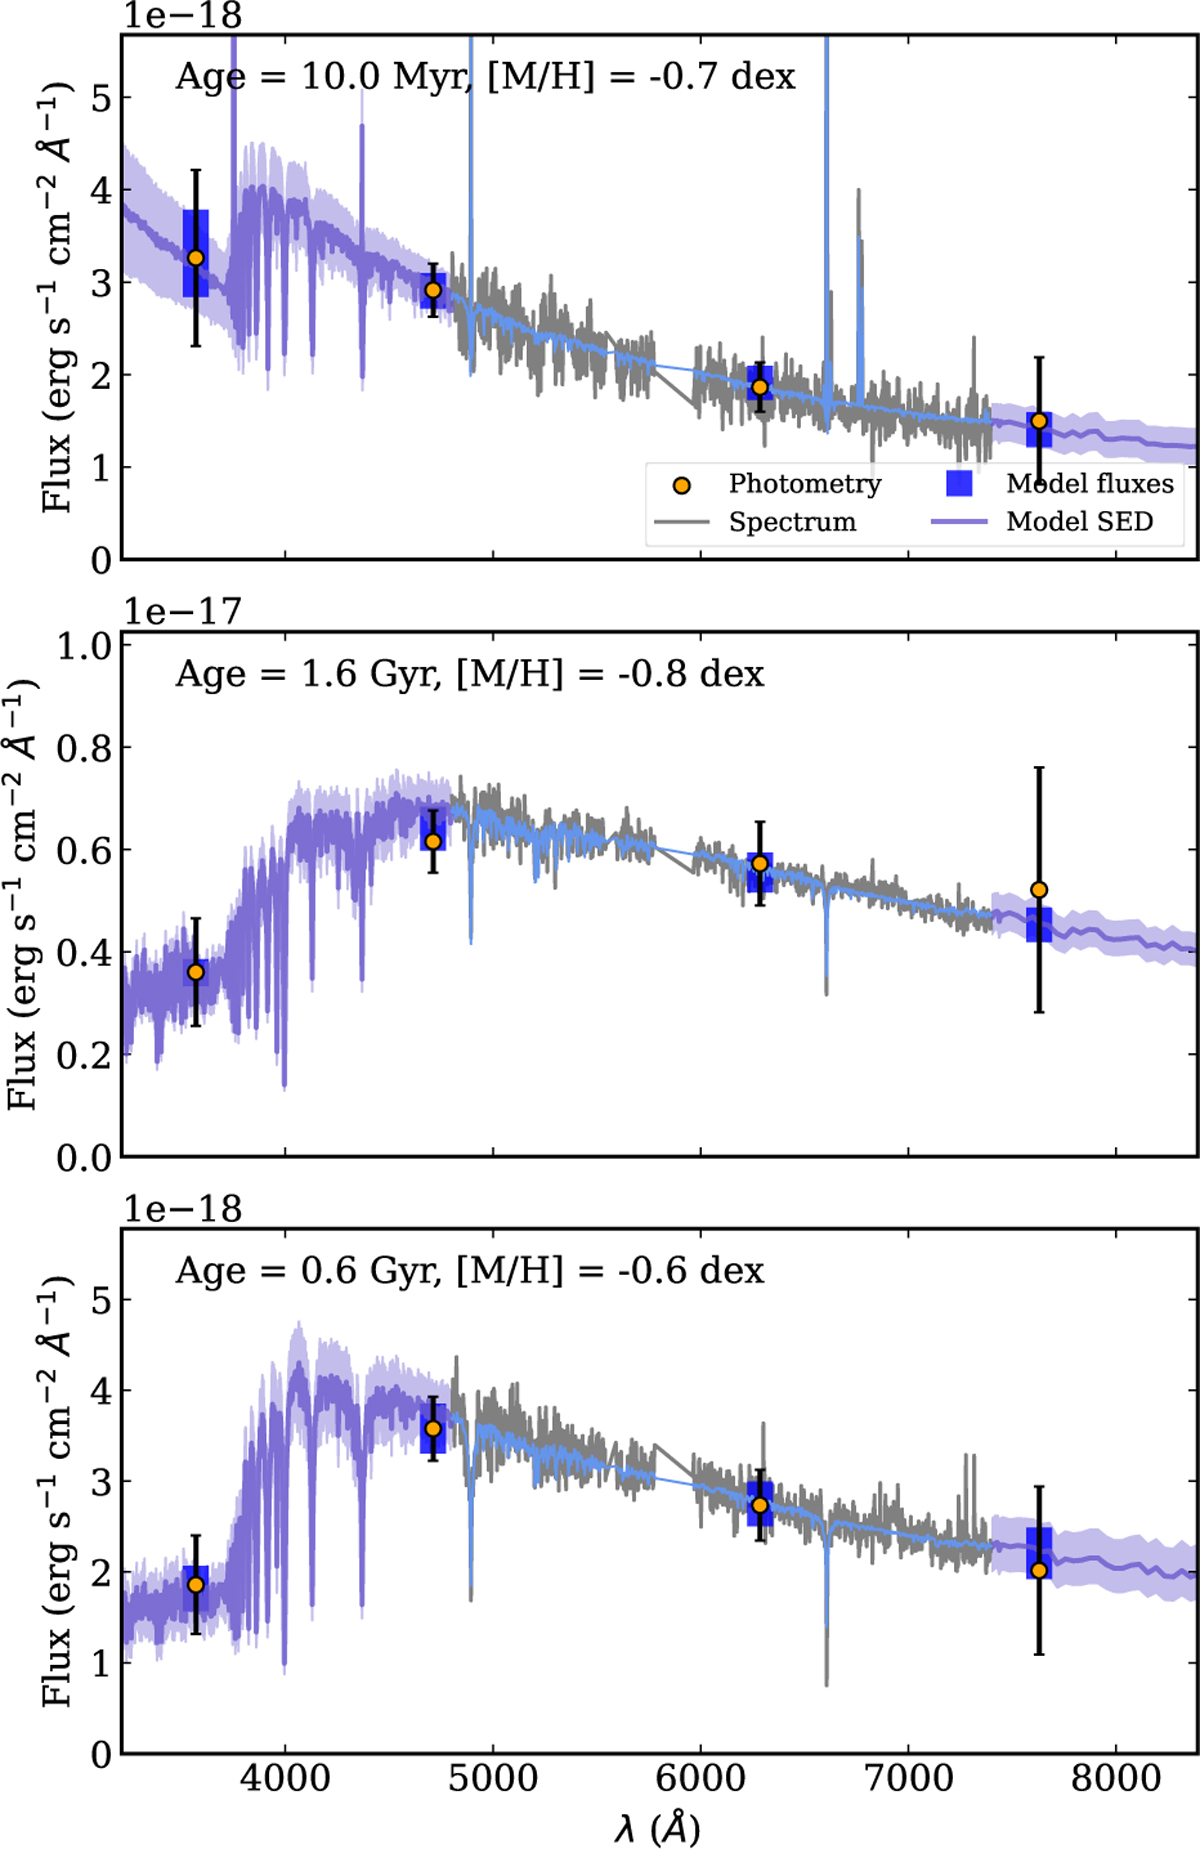
Examples of successful SED fits. For these star clusters, the FDS fluxes (orange) and the MUSE spectra (grey) were fitted with BAGPIPES. The best-fit model SED is shown in purple in the region without spectroscopy and in blue in the region of the MUSE spectrum. Corresponding model fluxes are shown by the dark blue squares. The shaded regions and the extension of the squares span between the 16th and 84th percentiles of the posteriors. Best-fitting age and metallicity are shown in the top left panel.
Current usage metrics show cumulative count of Article Views (full-text article views including HTML views, PDF and ePub downloads, according to the available data) and Abstracts Views on Vision4Press platform.
Data correspond to usage on the plateform after 2015. The current usage metrics is available 48-96 hours after online publication and is updated daily on week days.
Initial download of the metrics may take a while.