


Fig. 2
Download original image
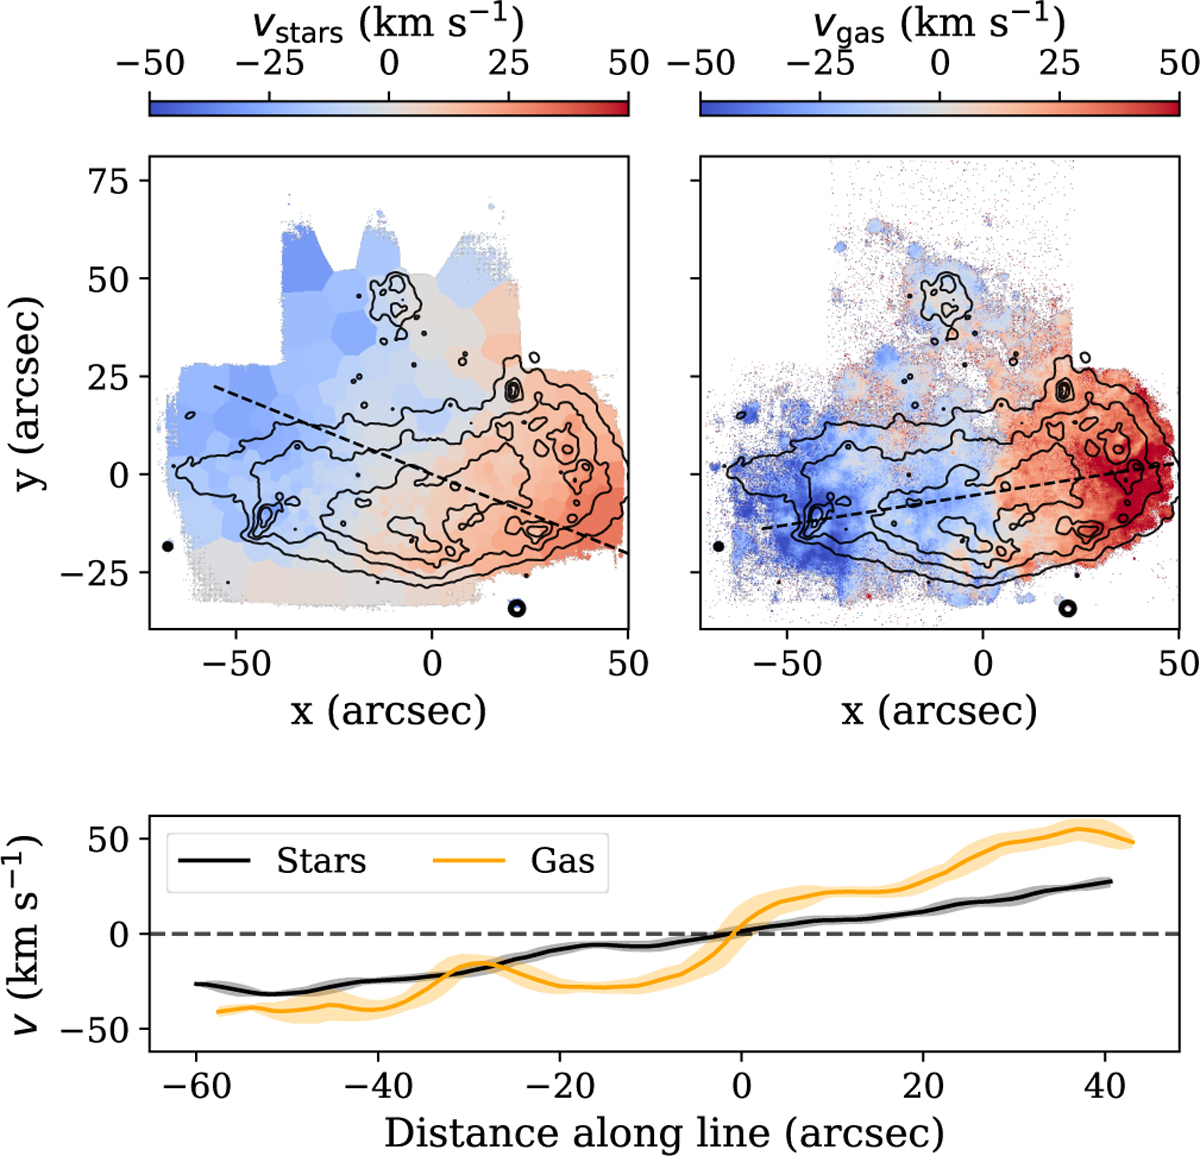
Stellar (top left) and Hα (top right) velocity maps. The left panel shows a Voronoi-binned map with S/N = 100, while the right panel shows the Hα velocity from a spaxel-by-spaxel analysis. The black contours show the flux from the FDS g-band image (μg from 22 to 23.5 mag arcsec−1 in steps of 0.5). The dashed lines indicate axis of maximum rotation, and the bottom panels shows the extracted mean velocity profiles along these lines ±2 arcsec. Shaded areas indicate standard deviations.
Current usage metrics show cumulative count of Article Views (full-text article views including HTML views, PDF and ePub downloads, according to the available data) and Abstracts Views on Vision4Press platform.
Data correspond to usage on the plateform after 2015. The current usage metrics is available 48-96 hours after online publication and is updated daily on week days.
Initial download of the metrics may take a while.