


| Issue |
A&A
Volume 711, July 2026
|
|
|---|---|---|
| Article Number | L8 | |
| Number of page(s) | 6 | |
| Section | Letters to the Editor | |
| DOI | https://doi.org/10.1051/0004-6361/202660692 | |
| Published online | 16 July 2026 | |
Letter to the Editor
Azimuthal brightness modulation reveals hidden rings in CI Tau
1
Dipartimento di Fisica, Università degli Studi di Milano, Via Celoria 16, Milano 20133, Italy
2
Max-Planck Institute for Astronomy (MPIA), Königstuhl 17, 69117 Heidelberg, Germany
3
Astronomy Unit, Department of Physics and Astronomy, Queen Mary University of London, Mile End Road, London E1 4NS, UK
4
Univ. Grenoble Alpes, CNRS, IPAG, F-38000 Grenoble, France
5
Institute of Astronomy, University of Cambridge, Madingley Road, Cambridge CB3 0HA, UK
6
School of Physics and Astronomy, University of Leeds, Leeds LS2 9JT, UK
★ Corresponding author: This email address is being protected from spambots. You need JavaScript enabled to view it.
Received:
29
April
2026
Accepted:
26
June
2026
Abstract
Context. Protoplanetary disks often host substructures such as rings and gaps, which trace key processes in planet formation and dust evolution. However, narrow rings may remain unresolved due to limited observational resolution, hiding critical information about early planetesimal formation and the amount of dust present.
Aims. We applied the azimuthal brightness modulation method, based on the modulation produced by multiple unresolved optically thick rings embedded in an optically thin background, to multiwavelength ALMA observations of CI Tau to identify unresolved rings and constrain their geometry and optical depth.
Methods. We analysed CI Tau archival ALMA continuum observations in bands 3, 6, and 7, and extracted azimuthal brightness profiles along narrow annuli and compared them with forward-modelled synthetic observations of inclined discs containing unresolved rings.
Results. We detect the azimuthal signature at ∼22 au in all three bands, consistent with unresolved, optically thick rings embedded in a lower optical depth background. Multiwavelength modelling constrains the rings’ geometry and optical depth, consistent with the conditions expected for streaming instability and early planetesimal formation.
Conclusions. Our results demonstrate the applicability of this azimuthal signature technique to real discs, reveal fine-scale dust substructures in CI Tau, and illustrate a new method of studying the early stages of planet formation below the nominal resolution limit.
Key words: planets and satellites: detection / planets and satellites: formation / protoplanetary disks
© The Authors 2026
 Open Access article, published by EDP Sciences, under the terms of the Creative Commons Attribution License (https://creativecommons.org/licenses/by/4.0), which permits unrestricted use, distribution, and reproduction in any medium, provided the original work is properly cited.
This article is published in open access under the Subscribe to Open model. This email address is being protected from spambots. You need JavaScript enabled to view it. to support open access publication.
1. Introduction
High-resolution ALMA observations reveal prominent substructures in protoplanetary discs (e.g. Brogan et al. 2015; Andrews et al. 2018; Andrews 2020; Bae et al. 2023; Drazkowska et al. 2023; Long et al. 2018; Huang et al. 2018), yet even narrower dust structures may remain unresolved. As angular resolution improves, narrower rings can emerge (e.g. Isella et al. 2018; Facchini et al. 2020), and ALMA data may still hide narrow rings.
Unresolved dust substructures are particularly relevant as they may trace dust trapping, grain growth, and even the onset of streaming instability and planetesimal formation (e.g. Youdin & Goodman 2005; Johansen et al. 2007; Carrera et al. 2015; Yang et al. 2017; Carrera et al. 2021, 2022). Dust evolution models predict that, in smooth discs, radial drift rapidly removes millimetre to centimetre dust grains from the disc (Adachi et al. 1976; Weidenschilling 1977; Takeuchi & Lin 2002; Brauer et al. 2008; Pinte & Laibe 2014), thus posing a major barrier to planetesimal formation. Localised pressure maxima can concentrate solids and halt radial drift (e.g. Pinilla et al. 2012; Flock et al. 2015; Riols & Lesur 2018). If smaller than the observation resolution, these dust traps may remain unresolved yet still host early planetesimal growth. Observed DSHARP ring surface brightnesses are consistent with optically thin 1.3 mm emission, with optical depths distributed in a surprisingly narrow range just below unity (e.g. Huang et al. 2018; Dullemond et al. 2018). Proposed explanations for such optical depth include dust scattering (Zhu et al. 2019), planetesimal formation (Dullemond et al. 2018; Stammler et al. 2019), or unresolved optically thick substructures (Jennings et al. 2022).
Recent works focused on indirect methods and observational constraints to detect unresolved substructures and streaming instability (e.g. Zagaria et al. 2023; Scardoni et al. 2021, 2024). Scardoni et al. (2024) demonstrated that even when rings are not spatially resolved, their optical depth and viewing geometry imprint a characteristic signature: two brightness peaks at the disc minor axis. This azimuthal pattern arises purely from projection and radiative transfer effects, making it a powerful diagnostic to identify unresolved dust rings, as other mechanisms produce different signatures; for example, optically thin rings produce bright emission along the major axis (Doi & Kataoka 2021), while optically thick cavities in inclined discs produce one-sided brightness maxima along the minor axis (Ribas et al. 2024).
In this Letter we report the first observational detection of this azimuthal brightness modulation in the CI Tau disc. Our results show that narrow, optically thick, unresolved rings can exist below the nominal ALMA resolution and that they leave a measurable imprint. This demonstrates that unresolved subrings remain a viable explanation for part of the DSHARP optical depth puzzle, and suggest that fine-scale dust concentrations may be more common than previously inferred from imaging alone. These narrow, dense, ring-like structures are potentially linked to dust trapping or streaming instability, thus providing a new observational pathway to probe the earliest stages of planetesimal formation.
2. Data
CI Tau is a ∼2 Myr (Gangi et al. 2022), Sun-like T Tauri star at 160 pc (Gaia Collaboration 2023). Its inclined disc (i ∼ 50°, Clarke et al. 2018) shows resolved rings and gaps (Konishi et al. 2018; Clarke et al. 2018; Zagaria et al. 2025; Long et al. 2018; Rosotti et al. 2021). We analysed CI Tau archival ALMA continuum observations in bands 3 (3.1 mm, Zagaria et al. 2025), 6 (1.3 mm, Konishi et al. 2018; Clarke et al. 2018), and 7 (0.9 mm, Rosotti et al. 2021). The data were averaged in 20 s bins and imaged following the CLEAN algorithm (Högbom 1974) in CASA tclean (CASA Team et al. 2022), with an elliptical mask centred on the source ( , PA 11°, Clarke et al. 2018). We adopted a multiscale deconvolver for bands 6–7, and multiscale multifrequency synthesis for band 3 (as the data cover a significant fraction of the average observing frequency) with scales corresponding to a point source and multiples of the beam. Our cellsize is 1/8 of the beam semi-minor axis and our image size is 2400 pixels. We used a conservative loop gain of 0.02 and a threshold of 1σ. We used a Briggs weighting scheme (Briggs 1995) and a combination of uv-taper and robust parameters to achieve the smallest possible nearly circular beam. Images were smoothed to our circular beam with the task imsmooth. Circular beams ensure that any azimuthal intensity signature is not due to beam geometry. We obtained synthesised beams of 66, 32, 83 mas (band 3, 6, 7) and RMS noise of 7.73 × 10⁻³, 3.41 × 10⁻², 1.08 × 10⁻¹ mJy beam−1 (band 3, 6, 7) measured over an emission-free annular region between
  and
and  around our target (see Fig. 1).
 |
Fig. 1. CI Tau in ALMA in band 6. The white circle indicates the beam; the dashed ellipse shows the location where the signature is detected. |
3. Detection of the azimuthal signature
To search for the azimuthal signature1, we deprojected the disc using inclination 49.24° and position angle 11.28° (Clarke et al. 2018). We then radially averaged the emission in concentric annuli at all disc radii to extract the azimuthal brightness temperature profiles; the radial width of each annulus was set to the size of the circular beam (5.3 au in band 3, 2.6 au in band 6, 6.6 au in band 7). A five-point moving average was applied azimuthally.
We systematically scanned all radial profiles as the signature, being associated with unresolved structures, could be present at any radius. We found the azimuthal signature at 22 au (magenta lines in Figure 2)2. This radius is close to a surface brightness maximum just outside a deep gap seen in high-resolution band 6 imaging (Clarke et al. 2018). The upper panels show the corresponding polar intensity maps; the white dashed lines mark the radial regions used in the profiles. All three bands exhibit a clear double-peaked profile, with maxima at ∼90° and ∼270°3. This is the expected signature of an unresolved, optically thick substructure embedded in an optically thin background as geometrical projection increases the apparent area (and thus brightness) of optically thick emission at the minor axis (Scardoni et al. 2024). In band 3, the minor axis peak reaches  , with ΔTB3 ∼ 1 K above the major axis. Band 6 has a stronger signal:
  and ΔTB6 ∼ 4 K. In band 7, we find ΔTB7 ∼ 2.5 K and
  . These values serve as inputs for our forward-modelling (Section 4), but should not be taken as exact as the rings are unresolved and the amplitudes are affected by beam dilution. The presence of the double peak at the same radius (∼22 au) across all three bands strongly supports the interpretation of unresolved optically thick rings.
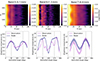 |
Fig. 2. Upper row: 2D intensity maps for CI Tau at ALMA bands 3, 6, 7. The white bar in each panel shows the beam size. The white dotted lines mark the profile radial averaging intervals: 22.0 ± 5.3 (band 3), 22.0 ± 2.6 (band 6), 22.0 ± 6.6 (band 7). Lower row: CI Tau azimuthal brightness temperature profiles in ALMA band 3 (left), 6 (centre), 7 (right) shown in magenta, with the corresponding model profiles overplotted in blue. The blue curves are illustrative examples from the model grid that qualitatively reproduce the observed signature (not obtained from a formal best-fit procedure). The shaded areas show profile uncertainties. The grey dashed lines mark the minor axis. |
4. Modelling the azimuthal signature
To study the signature, we used forward modelling based on synthetic observations. This enabled a direct comparison between unresolved ring models and the observations, accounting for beam convolution, projection, and interferometric imaging.
We used a disc profile Σ(R) = 2200 (R/au)−0.5 g cm−2, and introduced a series of narrow rings at 22 au and a depleted region between 10–19 au. The disc was inclined by 50°, and its emission computed assuming midplane temperature T(R) = 120 (R/au)−3/7 K (Chiang & Youdin 2010). We focused on the key parameters governing the signature (Figure 3): (i) the background optical depth τbg; (ii) the surface coverage of the optically thick component, via the ring diameter-to-spacing ratio 2r/d; (iii) the ring aspect ratio r/z, setting the projected optically thick area. The rings’ optical depth was fixed at τring = 10 in bands 6–7, where they are expected to be optically thick; in band 3 we explored lower τring, expecting optically thinner emission (see Appendix B). Uncertainties on brightness temperature were estimated from the image RMS converted to brightness temperature and scaled by the square root of the number of independent synthesised beams within the averaging annulus.
 |
Fig. 3. Sketch of the geometry of a section of the unresolved rings. |
We performed a grid search on band 6 data, varying τbg, 2r/d, and r/z to identify combinations reproducing the minor axis double peak. For each model, we computed the analytical brightness distribution and generated synthetic observations with SIMIO (Kurtovic 2024) matching the uv-coverage of the data and the circular beams defined in Section 2. Azimuthal profiles were extracted as for the observations and compared to the data. The blue lines in the central lower panel of Figure 2 show an illustrative model (τbg = 0.01, 2r/d = 0.1, r/z = 0.17) that match the brightness temperature profiles. Several models provide similarly good fits (Appendix A), thus reflecting the degeneracy of a three-parameter model (τbg, 2r/d, r/z) constrained by two observables (Tminor, ΔT). However, the modelling robustly confirms that the observed profile is consistent with emission from narrow optically thick rings in an optically thin background.
Once the disc geometry from band 6 was constrained, we focused on bands 3 and 7, varying only τbg and τring. The weaker signature observed in band 3 requires marginally optically thick rings (τring ≲ 5) embedded in a very optically thin background (τbg ∼ 10−3), consistent with expectations at longer wavelengths. Conversely, in band 7, the background must be moderately optically thin (τbg ∼ 0.1), while the rings remain optically thick.
The CI Tau azimuthal brightness pattern thus indirectly probes unresolved, optically thick dust structures. The strength of the signature varies with wavelength, reflecting the contrast between the rings and the surrounding disc (Scardoni et al. 2024): it peaks when the rings are optically thick and the background is optically thin (band 6), weakens at longer wavelengths as the rings approach marginal optical thickness (band 3), and is reduced at shorter wavelengths as the background becomes more opaque (band 7). We consistently find ΔTB3 < ΔTB7 < ΔTB6. A difference of two orders of magnitude is needed in τbg from band 3 to band 6, corresponding to opacity index β ∼ 2 (kν ∝ νβ), consistent with a background made of small grains. While some degeneracy remains due to the limited number of observables (Appendix A), our results show that unresolved, optically thick rings can explain the azimuthal asymmetry in CI Tau.
5. Discussion
5.1. Origin of CI Tau’s unresolved ring-like dust structures
5.1.1. Streaming instability (SI):
SI naturally produces dense, radially thin, azimuthally elongated filaments made of relatively large dust grains, while smaller ones remain in the low-density optically thin background (e.g. Youdin & Goodman 2005; Johansen et al. 2007; Bai & Stone 2010; Yang et al. 2017). This configuration is consistent with the narrow optically thick rings embedded in a thinner background inferred at 22 au in CI Tau. Detecting such structures requires the SI to be in its filamentary phase, before filaments collapse into clumps. Global simulations indicate that filaments can persist for hundreds to thousands of orbits (∼104 − 105 yr at 22 au) and drift inward slowly (Ostertag & Flock 2025), increasing the probability of observational detection. Schäfer et al. (2024) recently confirmed the azimuthal elongation of SI filaments in global simulations, but also showed that their length is limited; SI substructures thus appear as discontinuous rings. Given their geometry, such features may imprint a double-peaked azimuthal signature similar to that predicted by Scardoni et al. (2024), though noisier. Further work is required to confirm this expectation.
5.1.2. Dust traps:
Localised pressure maxima, arising from planets, zonal flows, or dead-zone edges, can halt radial drift and concentrate dust (e.g. Pinilla et al. 2012; Flock et al. 2015; Dong et al. 2018). The peak location just outside a gap supports this scenario, as gap edges are favourable sites for dust accumulation. If the dust traps create multiple unresolved rings, they may cause the 22 au feature and may in turn provide the conditions for SI or other planetesimal formation mechanisms. More speculatively, a previously more massive ring has already undergone gravitational collapse, and the resulting planet(esimal) carved a dip at the ring centre, thus producing a pair of closely spaced rings.
5.1.3. Other mechanisms:
Secular gravitational instability and Magnetohydrodynamics (MHD) zonal flows can enhance dust locally (Takahashi & Inutsuka 2016; Béthune et al. 2016; Riols & Lesur 2018), but typically produce structures several au broader than the narrow rings required by CI Tau signature. Turbulence can also produce elongated and radially narrow dust enhancements (Gerosa et al. 2023, 2024); the azimuthal signature generated by turbulent structures is characterised, and further work is needed to assess whether turbulence alone can produce the observed pattern. Simulations also suggest that warp-induced dust instability (WInDI), a dust instability in warped discs driven by oscillatory warp-induced gas motions, can produce narrow dust overdensities on radial scales of a few to several AU, manifesting as broken ring-like features in the dust distribution (Aly et al. 2024); these structures may produce azimuthal signatures similar to that in CI Tau, but require the presence of a warp. Purely geometrical effects (e.g. eccentricity or warps) can also generate double-peaked azimuthal emission; however, aligning with the minor axis requires fine-tuned geometry and predicts a wavelength-independent signature (contrary to observations), making this scenario less likely than SI (see Appendix C).
5.2. Implications and prospects
The azimuthal signature at 22 au is consistent with the presence of narrow optically thick rings. If interpreted as rings, their high optical depth and compact width imply efficient local dust concentration able to slow radial drift and promoting solid accumulation. Such conditions are consistent with streaming instabilities or other mechanisms (e.g. dust traps); the 22 au region is thus a potential site for the early stages of planetesimal formation.
This detection also suggests that similarly compact substructures may be hidden below ALMA resolution; regardless of beam size, this method can reveal sub-beam structures offering a powerful way to reveal them. Applying the Scardoni et al. (2024) method to other discs could uncover a population of sub-beam rings and guide targeted high-resolution, multiwavelength follow-up observations. Whether the hidden rings are resolved in future high-resolution observations, the signature itself constrains the geometry, dust properties, and physical scales of early dust concentration. Applying this method to a wider set of high-resolution observations may also help constrain the lifetime of SI-induced filaments based on their detection frequency.
6. Conclusions
We report the first detection of the azimuthal brightness modulation (with emission peaks at the minor axis of an inclined disc) predicted by Scardoni et al. (2024) in ALMA bands 3, 6, 7 CI Tau observations. The signature, detected at 22 au, is consistent with narrow optically thick dust rings in a low optical depth background. A single-disc geometry, combined with wavelength-dependent dust optical depth, reproduces the observed profiles and constrains the rings’ geometry and optical properties. While alternative mechanisms (e.g. warped discs, MHD perturbations) can generate dust rings, the geometry and wavelength dependence more naturally point to SI filaments or dust traps.
This work demonstrates that the azimuthal signature is a powerful tool for revealing sub-beam dust structures hidden in continuum images. Applied to other discs, this technique could uncover a broader population of unresolved rings, thus guiding high-resolution ALMA follow-ups and providing new constraints on the earliest stages of planetesimal and planet formation.
Acknowledgments
We thank the referee for the helpful comments provided to this manuscript. C.E.S and G.P.R. acknowledge support from the European Union (ERC Starting Grant discEvol, project No. 101039651) and from Fondazione Cariplo, grant No. 2022-2017. Views and opinion expressed are, however, those of the author(s) only and do not necessarily reflect those of the European Union or European Research Council. Neither the European Union nor the granting authority can be held responsible for them. This paper makes use of the following ALMA data: ADS/JAO.ALMA#2015.1.01207.S, ADS/JAO.ALMA#2016.1.01370.S, ADS/JAO.ALMA#2017.A.00014.S, and ADS/JAO.ALMA#2018.1.00900.S, ALMA is a partnership of ESO (representing its member states), NSF (USA), and NINS (Japan), together with NRC (Canada), NSC and ASIAA (Taiwan), and KASI (Republic of Korea), in cooperation with the Republic of Chile. The Joint ALMA Observatory is operated by ESO, AUI/NRAO, and NAOJ. A.R. has received funding from the Royal Society through a University Research Fellowship grant number URF\R1\241791. CJC has been supported by the UK Science and Technology Research Council (STFC) via the consolidated grant ST/W000997/1. R.A.B. has received funding from the Royal Society through a University Research Fellowship grant number URF\R1\211799.
References
- Adachi, I., Hayashi, C., & Nakazawa, K. 1976, Prog. Theor. Phys., 56, 1756 [CrossRef] [Google Scholar]
- Aly, H., Nealon, R., & Gonzalez, J.-F. 2024, MNRAS, 527, 4777 [Google Scholar]
- Andrews, S. M. 2020, ARA&A, 58, 483 [Google Scholar]
- Andrews, S. M., Huang, J., Pérez, L. M., et al. 2018, ApJ, 869, L41 [NASA ADS] [CrossRef] [Google Scholar]
- Bae, J., Isella, A., Zhu, Z., et al. 2023, ASP Conf. Ser., 534, 423 [NASA ADS] [Google Scholar]
- Bai, X.-N., & Stone, J. M. 2010, ApJ, 722, L220 [Google Scholar]
- Béthune, W., Lesur, G., & Ferreira, J. 2016, A&A, 589, A87 [NASA ADS] [CrossRef] [EDP Sciences] [Google Scholar]
- Brauer, F., Dullemond, C. P., & Henning, T. 2008, A&A, 480, 859 [NASA ADS] [CrossRef] [EDP Sciences] [Google Scholar]
- Briggs, D. S. 1995, AAS Meet. Abstr., 187, 112.02 [NASA ADS] [Google Scholar]
- Brogan, C. L., Pérez, L. M., Hunter, T. R., et al. 2015, ApJ, 808, L3 [NASA ADS] [CrossRef] [Google Scholar]
- Carrera, D., Johansen, A., & Davies, M. B. 2015, A&A, 579, A43 [NASA ADS] [CrossRef] [EDP Sciences] [Google Scholar]
- Carrera, D., Simon, J. B., Li, R., Kretke, K. A., & Klahr, H. 2021, AJ, 161, 96 [Google Scholar]
- Carrera, D., Thomas, A. J., Simon, J. B., et al. 2022, ApJ, 927, 52 [NASA ADS] [CrossRef] [Google Scholar]
- CASA Team, Bean, B., Bhatnagar, S., et al. 2022, PASP, 134, 114501 [NASA ADS] [CrossRef] [Google Scholar]
- Chiang, E., & Youdin, A. N. 2010, Ann. Rev. Earth Planet. Sci., 38, 493 [Google Scholar]
- Clarke, C. J., Tazzari, M., Juhasz, A., et al. 2018, ApJ, 866, L6 [NASA ADS] [CrossRef] [Google Scholar]
- Doi, K., & Kataoka, A. 2021, ApJ, 912, 164 [NASA ADS] [CrossRef] [Google Scholar]
- Dong, R., Li, S., Chiang, E., & Li, H. 2018, ApJ, 866, 110 [NASA ADS] [CrossRef] [Google Scholar]
- Drazkowska, J., Bitsch, B., Lambrechts, M., et al. 2023, ASP Conf. Ser., 534, 717 [NASA ADS] [Google Scholar]
- Dullemond, C. P., Birnstiel, T., Huang, J., et al. 2018, ApJ, 869, L46 [NASA ADS] [CrossRef] [Google Scholar]
- Facchini, S., Benisty, M., Bae, J., et al. 2020, A&A, 639, A121 [EDP Sciences] [Google Scholar]
- Flock, M., Ruge, J. P., Dzyurkevich, N., et al. 2015, A&A, 574, A68 [NASA ADS] [CrossRef] [EDP Sciences] [Google Scholar]
- Gaia Collaboration (Vallenari, A., et al.) 2023, A&A, 674, A1 [NASA ADS] [CrossRef] [EDP Sciences] [Google Scholar]
- Gangi, M., Antoniucci, S., Biazzo, K., et al. 2022, VizieR On-line Data Catalog: J/A+A/667/A124 [Google Scholar]
- Gerosa, F. A., Méheut, H., & Bec, J. 2023, Eur. Phys. J. Plus, 138, 9 [NASA ADS] [CrossRef] [Google Scholar]
- Gerosa, F. A., Bec, J., Méheut, H., & Kapoor, A. U. 2024, A&A, 685, L4 [NASA ADS] [CrossRef] [EDP Sciences] [Google Scholar]
- Högbom, J. A. 1974, A&AS, 15, 417 [Google Scholar]
- Huang, J., Andrews, S. M., Dullemond, C. P., et al. 2018, ApJ, 869, L42 [NASA ADS] [CrossRef] [Google Scholar]
- Isella, A., Huang, J., Andrews, S. M., et al. 2018, ApJ, 869, L49 [NASA ADS] [CrossRef] [Google Scholar]
- Jennings, J., Booth, R. A., Tazzari, M., Clarke, C. J., & Rosotti, G. P. 2022, MNRAS, 509, 2780 [NASA ADS] [Google Scholar]
- Johansen, A., Oishi, J. S., Mac Low, M.-M., et al. 2007, Nature, 448, 1022 [Google Scholar]
- Konishi, M., Hashimoto, J., & Hori, Y. 2018, ApJ, 859, L28 [CrossRef] [Google Scholar]
- Kurtovic, N. 2024, J. Open Source Softw., 9, 4942 [Google Scholar]
- Long, F., Pinilla, P., Herczeg, G. J., et al. 2018, ApJ, 869, 17 [Google Scholar]
- Ostertag, D., & Flock, M. 2025, A&A, 695, L13 [NASA ADS] [CrossRef] [EDP Sciences] [Google Scholar]
- Pinilla, P., Benisty, M., & Birnstiel, T. 2012, A&A, 545, A81 [NASA ADS] [CrossRef] [EDP Sciences] [Google Scholar]
- Pinte, C., & Laibe, G. 2014, A&A, 565, A129 [NASA ADS] [CrossRef] [EDP Sciences] [Google Scholar]
- Ribas, Á., Clarke, C. J., & Zagaria, F. 2024, MNRAS, 532, 1752 [NASA ADS] [CrossRef] [Google Scholar]
- Riols, A., & Lesur, G. 2018, A&A, 617, A117 [NASA ADS] [CrossRef] [EDP Sciences] [Google Scholar]
- Rosotti, G. P., Ilee, J. D., Facchini, S., et al. 2021, MNRAS, 501, 3427 [Google Scholar]
- Scardoni, C. E., Booth, R. A., & Clarke, C. J. 2021, MNRAS, 504, 1495 [NASA ADS] [CrossRef] [Google Scholar]
- Scardoni, C. E., Booth, R. A., Clarke, C. J., Rosotti, G. P., & Ribas, Á. 2024, ApJ, 970, 109 [NASA ADS] [CrossRef] [Google Scholar]
- Schäfer, U., Johansen, A., Haugbølle, T., & Nordlund, Å. 2024, A&A, 691, A258 [NASA ADS] [CrossRef] [EDP Sciences] [Google Scholar]
- Stammler, S. M., Drążkowska, J., Birnstiel, T., et al. 2019, ApJ, 884, L5 [NASA ADS] [CrossRef] [Google Scholar]
- Takahashi, S. Z., & Inutsuka, S.-I. 2016, AJ, 152, 184 [NASA ADS] [CrossRef] [Google Scholar]
- Takeuchi, T., & Lin, D. N. C. 2002, ApJ, 581, 1344 [NASA ADS] [CrossRef] [Google Scholar]
- Weidenschilling, S. J. 1977, MNRAS, 180, 57 [Google Scholar]
- Yang, C. C., Johansen, A., & Carrera, D. 2017, A&A, 606, A80 [NASA ADS] [CrossRef] [EDP Sciences] [Google Scholar]
- Youdin, A. N., & Goodman, J. 2005, ApJ, 620, 459 [Google Scholar]
- Zagaria, F., Clarke, C. J., Booth, R. A., Facchini, S., & Rosotti, G. P. 2023, ApJ, 959, L15 [NASA ADS] [CrossRef] [Google Scholar]
- Zagaria, F., Facchini, S., Curone, P., et al. 2025, A&A, 702, A56 [NASA ADS] [CrossRef] [EDP Sciences] [Google Scholar]
- Zhu, Z., Zhang, S., Jiang, Y.-F., et al. 2019, ApJ, 877, L18 [NASA ADS] [CrossRef] [Google Scholar]
The signature is a double peak in the azimuthal brightness profile at the minor axis, above the local noise and robust to radial binning.
We do not find a similar signature at other radii.
0° −180° is the major axis; 90° (270°) is the near (far) side minor axis.
Appendix A: Geometrical parameters
The geometrical parameters determine the fraction of the beam covered by the optically thick substructures. As a result, if we fix the background optical depth, different combinations of the parameters 2r/d and r/z that yield the same projected coverage produce identical azimuthal signatures.
After identifying a successful model through forward modelling, we used Eq. (1) in Scardoni et al. (2024) to compute the area covered by the rings when the disc is inclined at i = 50°, evaluated along the projected minor axis (90°) and major axis (0°; Arings, 90°i = 50° and Arings, 0°i = 50°, respectively). Since the azimuthal modulation arises from the difference in optical-depth coverage between these two directions, we quantified the contrast through the difference in geometrical covering factors,
 (A.1)
(A.1)
where Abeami = 50° is the area of the synthesised beam.
We then computed ΔA0° −90° over a grid of 2r/d and r/z values and selected the combinations that reproduce the contrast obtained from the successful model. The results are shown in A.1. The white dotted curve indicates the combinations of geometrical parameters yielding the correct ΔA0° −90°, while the white dot marks the reference model. The black dotted line indicates an upper limit on 2r/d, imposed by the absence of a flat-topped azimuthal profile (i.e. optical-depth saturation; see Scardoni et al. 2024). This figure therefore illustrates the intrinsic degeneracy between the geometrical parameters 2r/d and r/z.
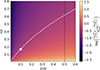 |
Fig. A.1. Difference in filling factor, ΔA0° −90°, as a function of the geometrical parameters 2r/d and r/z. The white dotted curve indicates the combinations of parameters that reproduce the ΔA0° −90° inferred from the successful model, marked by the white dot. The black dotted line shows an upper limit on 2r/d, imposed by the absence of optical-depth saturation in the observed azimuthal signature. |
We caution that the geometrical parameters are constrained by the white dashed line in A.1 only for a given value for the background optical depth (τν = 0.01 in band 6 for this test case). Different geometrical parameters may be allowed for different background optical depths; a lower (higher) optical depth would require higher (lower) geometrical coverage of the optically thick rings.
We can also explore geometric constraints under the assumption that the radial separation between adjacent rings cannot exceed the band 6 beam size, i.e. d < bB6 ≃ 2.6 au (32 mas). For the fiducial model, this implies r < 0.1 d/2 < 0.13 au (1.6 mas), and, adopting the inferred aspect ratio, z < r/0.17 < 0.76 au (9 mas) Considering instead the upper limit on the ratio 2r/d, we obtain looser constraints: r < 0.5 d/2 < 0.65 au (8 mas), and z < r/0.6 < 1.1 au (13 mas).
Appendix B: Wavelength dependence of the azimuthal signature
The azimuthal modulation predicted by Scardoni et al. (2024) arises from the contrast between optically thick unresolved rings and a more optically thin background. When the disc is observed at an inclination, the relative coverage of optically thick areas is higher at the minor axis with respect to the major axis. The signature amplitude therefore depends not only on the geometry of the unresolved rings, but also on the relative optical depths of the two components, which vary with observing wavelength through the dust opacity. Additionally, the different beam sizes among bands cause a variation in beam dilution; this artificially suppresses the emission peaks and reduces the overall contrast among bands. While this effect diminishes the observed temperature contrast between the major and minor axes compared to the intrinsic geometric models, it is not strong enough in our data to alter the expected variation in temperature modulation among the bands.
In general, the dust opacity scales with frequency as κν ∝ νβ, implying higher optical depths at shorter wavelengths. This affects both the background and the rings. Focusing first on the rings, we expect that at relatively short wavelengths (bands 6 and 7) they remain optically thick due to their high column density; in this regime, the resulting emission becomes insensitive to the exact value of τring, justifying our adoption of a fixed representative value of 10. At longer wavelengths (band 3), the reduced opacity leads to lower optical depths despite the high column density, so that the rings become only marginally optically thick, with τring ∼ 5 emerging from our modelling. The background is more strongly affected by the wavelength dependence of the opacity as it is intrinsically less dense than the rings, and is therefore expected to remain in the optically thin regime. From our modelling the background optical depth increases from band 3 to 6 to 7.
The resulting wavelength dependence of the azimuthal signature can be understood as follows. At band 3, the modulation is reduced because the rings are only marginally optically thick, while the background remains optically thin. At band 6, the contrast is maximised as the rings are optically thick and the background is still optically thin, producing the strongest modulation. At band 7, the signal is slightly reduced due to the increased background optical depth, which lowers the ring-to-background contrast, but keeps it in the optically thin regime. This behaviour is illustrated by the representative models in B.1. The pink solid line shows a model with an optically thin background and a moderately optically thick ring (band 3 like contrast). The blue dashed line keeps the optically thin background, but increases the ring optical depth (band 6-like contrast), thereby increasing the temperature contrast between the minor and major axis. Lastly, the purple dash-dotted line keeps the same ring optical depth as the blue line, but increases the background optical depth (band 7-like contrast), decreasing the contrast. This is consistent with the trends observed in the data and discussed in the main text.
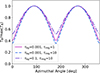 |
Fig. B.1. Normalised brightness temperature profiles vs azimuthal angle for three selected models. The plot illustrates the contrast variations in the curve modulation for different combinations of background (τbg) and ring (τring) optical depths. The pink solid like is representative of band 3; the blue dashed line is representative of band 6; the purple dash-dotted line is representative of band 7. |
 |
Fig. B.2. Azimuthal brightness profiles of the warped disc at 20 au (left panel), 30 au (central panel), and 50 au (right panel). Each curve shows a double-peaked shape, but the position of the peaks varies with radius due to the radial change in the warped disc orientation. |
Appendix C: Azimuthal brightness profiles in warped discs
In warped discs the local inclination and position angle of the material can change with radius; this produces a twisted appearance that can induce asymmetric azimuthal brightness. Therefore, we test here the expected azimuthal brightness radial profiles for warped discs to check whether they could reproduce the azimuthal brightness asymmetries observed in CI Tau. For this purpose, we generated a simple model of a warped disc where the position angle varies from 60° to 180°, while the inclination increases from 20° to 60° in the considered radial range (10-50 au).
We then created a synthetic observation of the warped disc following the same procedure as that in 4 and extracted the azimuthal brightness profiles at 20 au, 30 au, and 40 au ( B.2). We note that the azimuthal profiles of the warped disc show a double-peaked structure, confirming that a warp can indeed produce an apparent brightness enhancement at the minor axis (e.g. at 20 au in the considered model). However, the radial variation in orientation due to the warp determines a shift of the position of the two peaks with radius, as we can see comparing the three panels in B.2. This means that even if, in principle, a warped disc can mimic the double-peaked morphology seen in observations of unresolved rings, this effect requires a precise combination of warped geometry and inclination. In contrast, emission from unresolved optically thick rings always produces a double peak along the minor axis.
Furthermore, if the double-peaked structure were produced solely by geometric effects, the relative strength of the peaks should be identical across all wavelengths. This is not the case in CI Tau: the peak strength varies between bands 3, 6, and 7. Such wavelength-dependent variations are naturally explained when optical depth effects (both of the rings and the background emission) contribute to the observed azimuthal structure.
In specific cases, the global structure of the 2D surface density map may help distinguish between scenarios, although this is not always possible and depends on both the warp properties and the observational conditions.
Thus, although the azimuthal double peak does not uniquely indicate the presence of unresolved rings, the fine-tuned geometry required for warped discs makes the interpretation in terms of unresolved ring-like substructures more likely than a geometrically warped disc.
All Figures
|
Fig. 1. CI Tau in ALMA in band 6. The white circle indicates the beam; the dashed ellipse shows the location where the signature is detected. |
| In the text | |
|
Fig. 2. Upper row: 2D intensity maps for CI Tau at ALMA bands 3, 6, 7. The white bar in each panel shows the beam size. The white dotted lines mark the profile radial averaging intervals: 22.0 ± 5.3 (band 3), 22.0 ± 2.6 (band 6), 22.0 ± 6.6 (band 7). Lower row: CI Tau azimuthal brightness temperature profiles in ALMA band 3 (left), 6 (centre), 7 (right) shown in magenta, with the corresponding model profiles overplotted in blue. The blue curves are illustrative examples from the model grid that qualitatively reproduce the observed signature (not obtained from a formal best-fit procedure). The shaded areas show profile uncertainties. The grey dashed lines mark the minor axis. |
| In the text | |
|
Fig. 3. Sketch of the geometry of a section of the unresolved rings. |
| In the text | |
|
Fig. A.1. Difference in filling factor, ΔA0° −90°, as a function of the geometrical parameters 2r/d and r/z. The white dotted curve indicates the combinations of parameters that reproduce the ΔA0° −90° inferred from the successful model, marked by the white dot. The black dotted line shows an upper limit on 2r/d, imposed by the absence of optical-depth saturation in the observed azimuthal signature. |
| In the text | |
|
Fig. B.1. Normalised brightness temperature profiles vs azimuthal angle for three selected models. The plot illustrates the contrast variations in the curve modulation for different combinations of background (τbg) and ring (τring) optical depths. The pink solid like is representative of band 3; the blue dashed line is representative of band 6; the purple dash-dotted line is representative of band 7. |
| In the text | |
|
Fig. B.2. Azimuthal brightness profiles of the warped disc at 20 au (left panel), 30 au (central panel), and 50 au (right panel). Each curve shows a double-peaked shape, but the position of the peaks varies with radius due to the radial change in the warped disc orientation. |
| In the text | |
Current usage metrics show cumulative count of Article Views (full-text article views including HTML views, PDF and ePub downloads, according to the available data) and Abstracts Views on Vision4Press platform.
Data correspond to usage on the plateform after 2015. The current usage metrics is available 48-96 hours after online publication and is updated daily on week days.
Initial download of the metrics may take a while.