


| Issue |
A&A
Volume 711, July 2026
|
|
|---|---|---|
| Article Number | L3 | |
| Number of page(s) | 8 | |
| Section | Letters to the Editor | |
| DOI | https://doi.org/10.1051/0004-6361/202660493 | |
| Published online | 03 July 2026 | |
Letter to the Editor
Signatures of very massive stars in the epoch of reionization
1
Geneva Observatory, Department of Astronomy, University of Geneva, Chemin Pegasi 51, CH-1290 Versoix, Switzerland
2
LUPM, Université de Montpellier, CNRS, Place Eugène Bataillon, F-34095 Montpellier, France
3
CNRS, IRAP, 14 Avenue E. Belin, 31400 Toulouse, France
★ Corresponding author: This email address is being protected from spambots. You need JavaScript enabled to view it.
Received:
18
April
2026
Accepted:
15
June
2026
Abstract
We present ultra-deep (≃20 − 30 hours) rest-frame UV spectroscopy with NIRSpec of two UV-bright galaxies at z ∼ 8.7, CEERS-1019 and CEERS-1025 (Zneb ≃ 0.1 Z⊙), obtained as part of the JWST Cycle 4 SPURS large program. The spectra reveal exceptionally strong P Cygni profiles in the wind lines (N Vλ1240 and C IVλ1550) and significant broad and strong He IIλ1640 emission (EW ≃ 2 − 4 Å). We compared the observations with synthetic stellar population models at Z★ ≃ 0.1 Z⊙, with and without very massive stars (VMSs). Models with VMSs provide a markedly improved fit to the data relative to non-VMS models (ΔAIC and ΔBIC > 70), which fail to reproduce the observed strengths of the wind features. A comparison with empirical spectra of VMS-dominated systems in the local Universe further supports this interpretation. The best-fit VMS models imply extremely young ages of the stellar populations (≃1.5–2.0 Myr) and highly ionizing photon production efficiencies (log ξion [Hz erg−1] ≳ 25.8) that exceed those inferred from non-VMS models by ∼0.1–0.2 dex. These results provide evidence of an overabundance of VMSs at high-z with an initial mass function extending well beyond 100 M⊙, and they highlight the potential role of VMSs in shaping the rest-frame UV spectra, chemical enrichment, and ionizing output of galaxies in the early Universe.
Key words: galaxies: high-redshift / galaxies: ISM / galaxies: starburst / dark ages / reionization / first stars
© The Authors 2026
 Open Access article, published by EDP Sciences, under the terms of the Creative Commons Attribution License (https://creativecommons.org/licenses/by/4.0), which permits unrestricted use, distribution, and reproduction in any medium, provided the original work is properly cited.
This article is published in open access under the Subscribe to Open model. This email address is being protected from spambots. You need JavaScript enabled to view it. to support open access publication.
1. Introduction
Very massive stars (VMSs; M★ ≳ 100 M⊙; Vink et al. 2015) represent the extreme upper end of the stellar initial mass function (IMF). Owing to their proximity to the Eddington limit, VMS develop powerful winds, leading to high mass-loss rates (Ṁ) and characteristic spectra dominated by broad emission and P Cygni features. One of their most distinctive signatures is strong and broad He IIλ1640 emission (Crowther et al. 2016; Martins & Palacios 2022). While such features are traditionally associated with classical Wolf-Rayet (WR) stars, VMSs can produce similar spectral signatures already during core hydrogen burning (as WNh stars). Their extreme luminosities and winds also make them important contributors to the ionizing photon production and chemical enrichment in young stellar populations (e.g., Vink 2023; Schaerer et al. 2025).
The VMSs have been individually identified in a few young massive clusters in the Galaxy and the LMC (e.g., Crowther et al. 2010). Beyond resolved stellar populations, evidence of VMSs has been reported in some local clusters and H II regions (e.g., Leitherer et al. 2018; Senchyna et al. 2021; Martins et al. 2023; Smith et al. 2023; Wofford et al. 2023), and in galaxies at intermediate redshifts (z ∼ 2 − 4; Meštrić et al. 2023; Upadhyaya et al. 2024), where the strength of He II emission and other features cannot be reproduced by standard synthesis models with IMFs limited to Mup ∼ 100 M⊙.
Despite their importance, the identification of VMS in distant galaxies remains challenging because their lifetimes are extremely short (∼2 Myr). Moreover, their spectroscopic signatures can be relatively subtle in integrated spectra, often requiring a high signal-to-noise ratio (S/N) and moderate spectral resolution to distinguish them from nebular emission contributions. These requirements make their detection difficult at high-z, where deep UV spectroscopy is observationally expensive. Using ultra-deep rest-frame UV spectroscopy from the James Webb Space Telescope (JWST), we present here the first strong evidence of the presence of VMSs in two UV-bright galaxies at z ≃ 8.7.
2. Source description and JWST observations
The two targets we analyzed, CEERS-1019 and CEERS-1025, are located in the EGS field and are known to reside within a large-scale overdense region and ionized bubble at z ≃ 8.7 (Larson et al. 2022; Whitler et al. 2026). CEERS-1019 (α, δ [J2000] = 215.0354°, 52.8907°; z = 8.678) is one of the UV-brightest galaxies known at z > 8. NIRSpec spectroscopy revealed intense nebular emission, including rest-UV nitrogen lines (N IV] λ1486 and N III] λ1750), indicating a super-solar nitrogen abundance (log(N/O)≃ − 0.18; Marques-Chaves et al. 2024) at relatively low metallicity (12 + log(O/H) = 7.70). A potential broad Hβ component was initially interpreted as evidence of AGN activity (Larson et al. 2023). However, deeper NIRSpec/IFS observations by Zamora et al. (2025) revealed similar broad components in the [O III] λλ4960, 5008 lines, which instead indicates ionized outflows. CEERS-1025 (α, δ [J2000] = 214.9675°, 52.9330°; z = 8.715) was first characterized using early CEERS observations (Nakajima et al. 2023; Tang et al. 2023). The galaxy appears to be young and exhibits strong rest-optical emission (Tang et al. 2023). Rest-UV spectroscopy later revealed Lyα emission (Tang et al. 2024; Whitler et al. 2026), along with redshifted N Vλ1242 emission. The gas-phase metallicity,  , was derived using the R23 strong-line method (Nakajima et al. 2023; see also: Tang et al. 2023, 2024).
Both targets were recently observed with deep rest-frame UV spectroscopy as part of the JWST large program called The SPectroscopic Ultra-deep Reionization-era Survey (SPURS; GO 9214; PIs: C. Mason and D. Stark; Chen et al. 2026). Observations were obtained using the NIRSpec G140M/F100LP configuration, which provides a spectral resolution of R ≃ 1000 over λ ≃ 0.9 − 1.84 μm. The observations employed a three-shutter slitlet with a three-point nodding pattern and an aperture position angle of PA ≃ 23.76°. The total exposure times were ≃29.47 h for CEERS-1019 and ≃19.64 h for CEERS-1025, and we note that one of the slitlet shutters was closed. Level 3 data products were retrieved from MAST and reduced using the JWST calibration reference data system (CRDS) version 13.0.6 with context jwst_1464.pmap.
3. Results
3.1. Overview of the rest-frame UV spectra
The high-S/N spectra (Fig. 1) reveal a variety of emission and absorption features arising from different components within the galaxies. Nebular emission lines are detected in both sources, including Lyα, O III] λ1666, and C III] λ1908, as well as N IV] and N III] in CEERS-1019, as discussed in previous studies (e.g., Larson et al. 2023; Marques-Chaves et al. 2024; Tang et al. 2024; Zamora et al. 2025). The spectrum of CEERS-1019 also exhibits ISM absorption lines (violet in Fig. 1), whereas these features appear to be weaker or are absent in CEERS-1025.
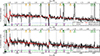 |
Fig. 1. Rest-UV spectra of CEERS-1019 (top) and CEERS-1025 (bottom). The spectra and corresponding 1σ uncertainties are shown in black and green, respectively. The best-fit synthetic models, which include VMS (VMS_300_GRZ), are overplotted in red (nebular continuum in blue). The ticks indicate the positions of selected emission and absorption features arising from nebular emission (green), stellar winds (yellow), and ISM absorption (violet). The gray regions mark spectral regions that were excluded from the fit due to nebular emission and ISM absorption. |
More relevant for this work, remarkably strong P Cygni features are present in both spectra, which is a key characteristic of the most massive stars and is expected in systems dominated by young stellar populations. We identify strong P Cygni profiles in N Vλ1240 and C IVλ1550, and slightly weaker in Si IVλ1400. In addition, He IIλ1640 emission is detected in both sources with high significance, and it clearly appears to be broad in CEERS-1025. This is compelling evidence of a significant broad component in CEERS-1019 (in addition to a narrower component). In Appendix B we characterize the broad He II components, finding EW = 2.6 ± 0.6 Å and FWHM ≃ 1380 km s−1 for CEERS-1019 and EW = 4.0 ± 0.8 Å and FWHM ≃ 1150 km s−1 for CEERS-1025. Given the lack of evidence of a dominant AGN, we assume that the broad He II emission has a stellar origin. The presence of broad He II emission, together with prominent P Cygni profiles, indicates that the spectra are dominated by young stellar populations, potentially including VMSs, which we explore next.
3.2. Fitting the rest-UV spectra with synthetic spectral models with and without very massive stars
We used the code FICUS (Saldana-Lopez et al. 2023) to investigate the young stellar populations of CEERS-1019 and CEERS-1025. The code models observed spectra as linear combinations of simple stellar population (SSP) templates. We considered a suite of stellar population models, including the standard STARBURST99 (SB99; Leitherer et al. 1999) and BPASS (v2.1; Eldridge et al. 2017) models, with IMF upper-mass cutoffs of 120 M⊙ and 100 M⊙, respectively. In addition, we incorporated models from Martins et al. (2025), which include VMSs with an extended IMF up to 300 M⊙. We explored two prescriptions for the VMS mass loss (see Martins et al. 2025), one independent of metallicity (VMS_GR), that is, as VMSs of LMC stars, and another prescription that scaled linearly with metallicity (VMS_GRZ) relative to the LMC values. All models adopted a Salpeter-like slope at the high-mass end of the IMF. A summary of the models is provided in Table C.1.
Each spectrum was fitted using SSP templates spanning ages from 0 to 40 Myr, and the metallicity was fixed to Z = 0.1 Z⊙, consistent with the measured gas-phase metallicities of the two sources. A nebular continuum component was included for each SSP using PYNEB (Luridiana et al. 2015), assuming nH = 103 cm−3 and Te = 1.5 × 10⁴ K. The dust attenuation was modeled using the Reddy et al. (2016) law. The best-fit solution was obtained via χ2 minimization using the lmfit package (Newville et al. 2016). The uncertainties on the derived parameters were estimated through Monte Carlo simulations.
The models with VMSs provide significantly better fits to the spectra of both sources than standard models without VMSs (BPASS or SB99), particularly in reproducing the stellar wind features (N V, C IV, and He II). Fig. 1 shows the best fits for CEERS-1019 and CEERS-1025, both corresponding to VMS_GRZ. The full set of best-fit models is shown in Appendix C (Figs. C.1 and C.2). Quantitatively, the Akaike (AIC) and Bayesian (BIC) information criteria strongly favor VMS models, with ΔAIC and ΔBIC of at least ≳70 − 280 relative to non-VMS models (Table C.1). These differences indicate overwhelming statistical support for the inclusion of VMSs in the modelling. A more detailed assessment, comparing the observed strengths of the He II emission and N V P Cygni profiles with model predictions, is provided in Appendix D and Fig. D.1.
In particular, standard models without VMS fail to reproduce several key spectral features (Figs. C.1 and C.2). For N V and non-VMS models significantly underestimate the strength of the P Cygni profile, especially the redshifted emission component, whereas VMS models provide an excellent match to the absorption and emission features. A similar trend is observed for the broad He II emission. At these metallicities (0.1 Z⊙), the contribution of classical WR stars is expected to be limited, as their Ṁ and wind strengths generally decrease with Z (Crowther et al. 2023). Empirically, WR-dominated systems at an LMC-like metallicity typically exhibit EW ∼ 1–2 Å (Martins et al. 2023), suggesting that at even lower metallicities, the WR contribution might be even weaker, as predicted by the non-VMS models (EW ≲ 1 Å, Fig. D.1). However, recent theoretical works suggested a more nuanced dependence of Ṁ on metallicity and Eddington factor (Γ) in WR, with relatively high Ṁ still possible at very high Γ (e.g. Sander et al. 2020). While VMS models substantially improve the agreement with the measured He II line strengths (Fig. D.1), we cannot exclude some contribution from classical WR stars, which can be tested with deep rest-optical spectroscopy (WR bumps; Rivera-Thorsen et al. 2024). The C IV P Cygni profile in CEERS-1025 is also better reproduced by models with VMSs (particularly the VMS_GRZ model). In CEERS-1019, the comparison is less straightforward because the C IV profile is strongly affected by nebular emission and ISM absorption, which complicates a detailed decomposition of the stellar wind component. Finally, CEERS-1025 exhibits a prominent Si IVλ1400 P Cygni profile that is only poorly reproduced by any of the models, although the VMS_GRZ model appears to partially account for the observed feature. Strong Si IV P Cygni profiles are typically associated with OB supergiants (Walborn & Nichols-Bohlin 1987), suggesting somewhat cooler stellar populations. However, similar Si IV features have also been reported in UV-bright VMS-dominated candidates at z ∼ 2 − 4 (Upadhyaya et al. 2024).
Based on the best-fit VMS_GRZ models, we derived light-weighted stellar ages of 1.5 ± 0.4 Myr and 1.9 ± 0.3 Myr for CEERS-1019 and CEERS-1025, respectively (Table C.1). Both sources exhibit elevated ionizing photon production efficiencies, ξion = QH/LUV ≳ 1025.8 Hz erg−1, exceeding the values inferred from models without VMS by ≳0.1 − 0.2 dex.
3.3. Comparison with other VMS-dominated systems
We compared the G140M spectra of CEERS-1019 and CEERS-1025 with those of known and candidate VMS-dominated systems spanning similar or moderately higher metallicities. Fig. 2 presents the normalized spectra of the two sources around C IV and He II, alongside local star clusters MrK71-A (Z/Z⊙ ≃ 16%; Smith et al. 2023), SB126 (Z/Z⊙ ≃ 21%; Senchyna et al. 2021), II Zw 40-A (Z/Z⊙ ≃ 25%; Leitherer et al. 2018), and R136 in the LMC (Crowther et al. 2016), and the highly magnified Sunburst cluster at z = 2.37 (Z/Z⊙ ≃ 19%; Chisholm et al. 2019; Meštrić et al. 2023; Welch et al. 2025).
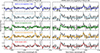 |
Fig. 2. Comparison of the G140M spectra (black) of CEERS-1019 (left) and CEERS-1025 (right) around C IV and He II with other VMS-dominated system candidates (sorted by metallicity): MrK71-A (blue), Sunburst cluster (light blue), SB126 (green), IIZw40-A (orange), and R136 (red). |
Despite differences in data quality and properties among the comparison samples (e.g., nebular contribution, metallicity, and age) and between the two sources themselves (with CEERS-1019 showing stronger nebular emission), the overall spectral appearance of CEERS-1019 and CEERS-1025 resembles that of some VMS-dominated systems. In CEERS-1019, the C IV P Cygni emission is broadly consistent with that observed in the Sunburst cluster, SB126, and R136, although the profile near systemic velocity is partially contaminated by nebular emission. In contrast, its relatively weak blueshifted absorption is more similar to that seen in MrK71-A. When its central (nebular) component is excluded, the broad wings of He II are also consistent with those of the Sunburst cluster. For CEERS-1025, the C IV profile shows similarities to those of the Sunburst and SB126 clusters. However, its He II emission more closely resembles that of the most metal-rich sources, II Zw 40-A and R136, which exhibit stronger He II (EW ≳ 4 Å).
4. Discussion and conclusions
Based on spectral modeling and comparisons with local VMS-dominated systems, our results provide strong evidence that CEERS-1019 and CEERS-1025 (z ≃ 8.7; Z/Z⊙ ≃ 0.1) host a significant population of VMSs. We explored two assumptions for the VMS Ṁ–Z dependence. In one case (VMS_GR), the mass-loss rates are the same as those of LMC stars; in the other case (VMS_GRZ), we adopted a linear scaling with Z relative to LMC values (see Martins et al. 2025). Both VMS models provide significantly improved fits compared to models without VMS (ΔAIC and ΔBIC > 70). However, we found no significant differences between the two prescriptions and thus cannot constrain how the VMS mass-loss rates depend on metallicity. Furthermore, while the VMS contribution appears to be robust, the IMF Mup = 300 M⊙ assumed here should be regarded as indicative given the degeneracies between the IMF slope and the Ṁ–Z dependence.
An additional source of uncertainty is the stellar metallicity adopted in the models. While we fixed the stellar metallicity to Z★/Z⊙ = 0.1 based on the nebular metallicity (12 + log(O/H)≃7.70), the exact stellar metallicities of these systems remain uncertain. Nevertheless, the presence of VMSs in these sources appears to be robust against plausible metallicity variations. The observed He II and N V P Cygni strengths are reproduced by VMS models spanning Z★/Z⊙ = 0.1–0.2 (Fig. D.1), while current non-VMS population synthesis models fail to reproduce the observed He II strengths even at LMC metallicity (Martins et al. 2023). On the other hand, if the stellar is lower than the nebular metallicity, as expected in α-enhanced systems that are predominantly enriched by CCSNe, even more extreme stellar populations would likely be required (e.g., top-heavy IMFs and/or a higher IMF Mup).
The presence of VMSs in sources at the epoch of reionization is somewhat expected, as they are observed in the Milky Way and LMC and are likely present in other nearby systems, while their formation is predicted to be favored in the dense low-metallicity environments typical of high-z galaxies. However, their identification remains challenging because their lifetimes are short (∼2 Myr). Whether VMSs are ubiquitous in the early Universe or instead only trace a subset of extreme systems thus remains an open question. If they are common, as in the z ∼ 2–4 UV-bright galaxies studied by Upadhyaya et al. (2024), they might significantly enhance the UV luminosities and the ionizing photon production efficiencies, as inferred here (ξion ≳ 1025.8 Hz erg−1).
Furthermore, CEERS-1019 belongs to the class of nitrogen-enhanced galaxies recently identified at high-z. Several scenarios have been proposed to explain their extreme N/O ratios, including enrichment from WRs or massive stars, VMSs, or supermassive stars. While our results might support a VMS contribution (Vink 2023), no firm conclusion can be drawn from a single object. Moreover, these scenarios are not mutually exclusive since a young VMS-dominated population can outshine previous star formation episodes hosting WRs, while the presence of VMSs would also be naturally expected if the IMF upper-mass limit extends into the regime of supermassive stars (> 103 M⊙).
More broadly, these results highlight the importance of deep rest-frame UV spectroscopy and the role of VMSs in shaping the spectra of young galaxies during the epoch of reionization. Upcoming deeper rest-UV spectroscopy with JWST and with the ELT will be essential (1) to establish statistically whether VMSs and different IMFs are common in typical high-redshift star-forming galaxies, and (2) to better understand their impact on stellar evolution, chemical enrichment, and, more generally, their role in early galaxy evolution and cosmic reionization.
References
- Chen, Z., Stark, D. P., Mason, C. A., et al. 2026, arXiv e-prints [arXiv:2604.21516] [Google Scholar]
- Chisholm, J., Rigby, J. R., Bayliss, M., et al. 2019, ApJ, 882, 182 [Google Scholar]
- Crowther, P. A., Schnurr, O., Hirschi, R., et al. 2010, MNRAS, 408, 731 [Google Scholar]
- Crowther, P. A., Caballero-Nieves, S. M., Bostroem, K. A., et al. 2016, MNRAS, 458, 624 [Google Scholar]
- Crowther, P. A., Rate, G., & Bestenlehner, J. M. 2023, MNRAS, 521, 585 [NASA ADS] [CrossRef] [Google Scholar]
- Eldridge, J. J., Stanway, E. R., Xiao, L., et al. 2017, PASA, 34, e058 [Google Scholar]
- Larson, R. L., Finkelstein, S. L., Hutchison, T. A., et al. 2022, ApJ, 930, 104 [NASA ADS] [CrossRef] [Google Scholar]
- Larson, R. L., Finkelstein, S. L., Kocevski, D. D., et al. 2023, ApJ, 953, L29 [NASA ADS] [CrossRef] [Google Scholar]
- Leitherer, C., Schaerer, D., Goldader, J. D., et al. 1999, ApJS, 123, 3 [Google Scholar]
- Leitherer, C., Byler, N., Lee, J. C., & Levesque, E. M. 2018, ApJ, 865, 55 [NASA ADS] [CrossRef] [Google Scholar]
- Luridiana, V., Morisset, C., & Shaw, R. A. 2015, A&A, 573, A42 [NASA ADS] [CrossRef] [EDP Sciences] [Google Scholar]
- Marques-Chaves, R., Schaerer, D., Kuruvanthodi, A., et al. 2024, A&A, 681, A30 [NASA ADS] [CrossRef] [EDP Sciences] [Google Scholar]
- Martins, F., & Palacios, A. 2022, A&A, 659, A163 [NASA ADS] [CrossRef] [EDP Sciences] [Google Scholar]
- Martins, F., Schaerer, D., Marques-Chaves, R., & Upadhyaya, A. 2023, A&A, 678, A159 [NASA ADS] [CrossRef] [EDP Sciences] [Google Scholar]
- Martins, F., Palacios, A., Schaerer, D., & Marques-Chaves, R. 2025, A&A, 698, A262 [NASA ADS] [CrossRef] [EDP Sciences] [Google Scholar]
- Meštrić, U., Vanzella, E., Upadhyaya, A., et al. 2023, A&A, 673, A50 [NASA ADS] [CrossRef] [EDP Sciences] [Google Scholar]
- Nakajima, K., Ouchi, M., Isobe, Y., et al. 2023, ApJS, 269, 33 [NASA ADS] [CrossRef] [Google Scholar]
- Newville, M., Stensitzki, T., Allen, D. B., et al. 2016, Lmfit: Non-Linear Least-Square Minimization and Curve-Fitting for Python, Astrophysics Source Code Library [record ascl:1606.014] [Google Scholar]
- Reddy, N. A., Steidel, C. C., Pettini, M., & Bogosavljević, M. 2016, ApJ, 828, 107 [NASA ADS] [CrossRef] [Google Scholar]
- Rivera-Thorsen, T. E., Chisholm, J., Welch, B., et al. 2024, A&A, 690, A269 [NASA ADS] [CrossRef] [EDP Sciences] [Google Scholar]
- Saldana-Lopez, A., Schaerer, D., Chisholm, J., et al. 2023, MNRAS, 522, 6295 [NASA ADS] [CrossRef] [Google Scholar]
- Sander, A. A. C., Vink, J. S., & Hamann, W.-R. 2020, MNRAS, 491, 4406 [Google Scholar]
- Schaerer, D., Guibert, J., Marques-Chaves, R., & Martins, F. 2025, A&A, 693, A271 [NASA ADS] [CrossRef] [EDP Sciences] [Google Scholar]
- Senchyna, P., Stark, D. P., Charlot, S., et al. 2021, MNRAS, 503, 6112 [NASA ADS] [CrossRef] [Google Scholar]
- Smith, L. J., Oey, M. S., Hernandez, S., et al. 2023, ApJ, 958, 194 [NASA ADS] [CrossRef] [Google Scholar]
- Tang, M., Stark, D. P., Chen, Z., et al. 2023, MNRAS, 526, 1657 [NASA ADS] [CrossRef] [Google Scholar]
- Tang, M., Stark, D. P., Topping, M. W., Mason, C., & Ellis, R. S. 2024, ApJ, 975, 208 [NASA ADS] [CrossRef] [Google Scholar]
- Upadhyaya, A., Marques-Chaves, R., Schaerer, D., et al. 2024, A&A, 686, A185 [NASA ADS] [CrossRef] [EDP Sciences] [Google Scholar]
- Vink, J. S. 2023, A&A, 679, L9 [NASA ADS] [CrossRef] [EDP Sciences] [Google Scholar]
- Vink, J. S., Heger, A., Krumholz, M. R., et al. 2015, Highlights Astron., 16, 51 [Google Scholar]
- Walborn, N. R., & Nichols-Bohlin, J. 1987, PASP, 99, 40 [NASA ADS] [CrossRef] [Google Scholar]
- Welch, B., Rivera-Thorsen, T. E., Rigby, J. R., et al. 2025, ApJ, 980, 33 [Google Scholar]
- Whitler, L., Stark, D. P., Mason, C. A., et al. 2026, MNRAS, 548, stag639 [Google Scholar]
- Wofford, A., Sixtos, A., Charlot, S., et al. 2023, MNRAS, 523, 3949 [NASA ADS] [CrossRef] [Google Scholar]
- Zamora, S., Carniani, S., Bertola, E., et al. 2025, A&A, submitted, [arXiv:2512.09022] [Google Scholar]
Appendix A: Acknowledgements
The authors thank the referee for useful comments. This work is based on observations made with the NASA/ESA/CSA James Webb Space Telescope. The data were obtained from the Mikulski Archive for Space Telescopes at the Space Telescope Science Institute, which is operated by the Association of Universities for Research in Astronomy, Inc., under NASA contract NAS 5-03127 for JWST. These observations are associated with program #9214. The authors acknowledge the SPURS team (led by coPIs C. Masond and D. Stark) for developing their observing program with a zero-exclusive-access period. The data described here may be obtained from https://dx.doi.org/10.17909/tb65-jv89.
Appendix B: Decomposition of the He IIλ1640 emission
We investigate the He II emission-line profiles in CEERS-1019 and CEERS-1025. As a first step, we fit the He II and O III] λλ1660, 1666 emission lines using a single Gaussian component for each line. We find that the O III] lines are well described by narrow Gaussians, with FWHM (OIII]) = 380 ± 140 km s−1 and 148 ± 72 km s−1 for CEERS-1019 and CEERS-1025, respectively. In contrast, the He II emission is significantly broader in both sources, with FWHM = 607 ± 90 km s−1 and 1154 ± 301 km s−1 for CEERS-1019 and CEERS-1025, respectively. Moreover, in CEERS-1019 the single-Gaussian model fails to reproduce the extended wings of the He II profile (Fig. B.1), further indicating the presence of an additional broad component.
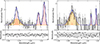 |
Fig. B.1. Normalized spectra (black) of CEERS-1019 (left) and CEERS-1025 (right) in the spectral region around He II and O III] λλ1660, 1666. The top panels show the best-fit models (dashed blue), where the He II profile is decomposed into two Gaussian components: a narrow component with its width fixed to that of the O III] lines (shaded red), and a broader component (orange). The bottom panels show the residuals of the fits. |
We therefore model the He II profile in CEERS-1019 using two Gaussian components: a narrow component, with its width fixed to that of the nebular O III] emission (FWHM (OIII]) = 380 ± 140 km s−1), and a broader component with free width. For the latter, we measure FWHM (HeII) = 1373 ± 392 km s−1 and EW (HeII) = 2.58 ± 0.54 Å, contributing ≃57% of the total He II flux. In contrast, the He II profile in CEERS-1025 is well described by a single broad Gaussian component, with no significant evidence for a narrow (nebular) contribution. In this case, we derive FWHM (HeII) = 1156 ± 450 km s−1 and EW (HeII) = 3.99 ± 0.64 Å.
Fig. B.1 presents the best-fit Gaussian models for the He II and O III] emission lines in both sources.
Appendix C: Best-fit synthetic models with and without Very Massive Stars
Figs. C.1 and C.2 present the best-fit synthetic spectra for CEERS-1019 and CEERS-1025, respectively, obtained using FICUS (Saldana-Lopez et al. 2023) for models at Z = 0.1 Z⊙ including VMS (VMS_GRZ and VMS_GR; shown in red and green) and without VMS (BPASS and SB99; shown in violet and blue). Table C.1 summarizes the statistical assessment and best-fit parameters for each model.
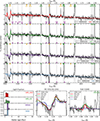 |
Fig. C.1. Rest-frame UV spectrum of CEERS-1019 (black) and best-fit synthetic models derived with FICUS: VMS_300_GRZ (red), VMS_300_GR (green), BPASS (violet), and SB99 (blue). Grey regions indicate wavelength intervals excluded from the fit. The lower panels show the light-weighted contributions of the SSP components (left), and zoom-ins on the N Vλ1240 (middle) and He IIλ1640 (right) spectral regions. |
Summary of models, statistical assessment, and best-fit parameters obtained for CEERS-1019 and CEERS-1025.
Appendix D: Strength of the He II and N V P-Cygni profiles and comparison with synthetic stellar models
We measure the rest-frame equivalent widths of the He II emission and the N V P-Cygni profile for CEERS-1019 and CEERS-1025, as well as for the suite of models considered in this work (see also Upadhyaya et al. 2024). To this end, we normalize the spectra by fitting a linear continuum using line-free regions around He II (λrest = 1610 − 1620 Å and 1651 − 1658 Å) and N V (λrest = 1265 − 1295 Å), ensuring that strong spectral features do not bias the continuum determination. The He II EW is measured over the interval λrest = 1633 − 1647 Å, finding EW (HeII) = 4.53 ± 0.36 Å and 4.09 ± 0.71 Å for CEERS-1019 and CEERS-1025, respectively. For the N V P-Cygni profile, we measure the absorption and emission components separately using the windows λrest = 1225 − 1239 Å and 1240 − 1253 Å, respectively.
Top panels of Fig. D.1 shows the relationship between the EWs of He II and the N V absorption (left) and emission (right) components. The measurements for CEERS-1019 and CEERS-1025 (stars) are compared with predictions from SSP models spanning a range of ages and metallicities (Z/Z⊙ = 10% and 20%, shown as solid and dashed lines, respectively). We find that only models including VMS (red and green) can simultaneously reproduce the observed strengths of both the N V P-Cygni emission and the He II line. In contrast, models without VMS fail to match the data. BPASS models, which include binary evolution, can reach at most EW(HeII) ≃ 1 Å, driven by the contribution of Wolf-Rayet (WR) stars, but only at ages of ≳5 − 8 Myr, when the N V feature has already significantly weakened. SB99 models, on the other hand, predict negligible He II emission.
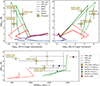 |
Fig. D.1. Relationship between the strength of the He II emission and the N V P-Cygni absorption (top left) and emission (top right), as predicted by different models. Models including VMS are shown in red and green, while those without VMS are shown in violet and blue. Solid and dashed lines correspond to metallicities of Z/Z⊙ = 10% and 20%, respectively. Measurements for CEERS-1019 and CEERS-1025 are indicated by stars, except for the broad He II component in CEERS-1019, which is derived from Gaussian decomposition. The bottom panel shows the strength of the He II emission as a function of its line width (FWHM), for VMS models (lines) and for CEERS-1019 and CEERS-1025 (stars) and other VMS-dominated systems and candidates: MrK71-A (blue), Sunburst cluster (light-blue), SB126 (green), IIZw40-A (orange), and R136 (red). |
The bottom panel of Fig. D.1 shows the relationship between the EWs of He II emission line and its line width (FWHM) for the VMS models (lines) and CEERS-1019 and CEERS-1025 (stars). We also show the measurements of other VMS-dominated systems and candidates discussed in Sect. 3.3: MrK71-A (blue), Sunburst cluster (light-blue), SB126 (green), IIZw40-A (orange), and R136 (red).
All Tables
Summary of models, statistical assessment, and best-fit parameters obtained for CEERS-1019 and CEERS-1025.
All Figures
|
Fig. 1. Rest-UV spectra of CEERS-1019 (top) and CEERS-1025 (bottom). The spectra and corresponding 1σ uncertainties are shown in black and green, respectively. The best-fit synthetic models, which include VMS (VMS_300_GRZ), are overplotted in red (nebular continuum in blue). The ticks indicate the positions of selected emission and absorption features arising from nebular emission (green), stellar winds (yellow), and ISM absorption (violet). The gray regions mark spectral regions that were excluded from the fit due to nebular emission and ISM absorption. |
| In the text | |
|
Fig. 2. Comparison of the G140M spectra (black) of CEERS-1019 (left) and CEERS-1025 (right) around C IV and He II with other VMS-dominated system candidates (sorted by metallicity): MrK71-A (blue), Sunburst cluster (light blue), SB126 (green), IIZw40-A (orange), and R136 (red). |
| In the text | |
|
Fig. B.1. Normalized spectra (black) of CEERS-1019 (left) and CEERS-1025 (right) in the spectral region around He II and O III] λλ1660, 1666. The top panels show the best-fit models (dashed blue), where the He II profile is decomposed into two Gaussian components: a narrow component with its width fixed to that of the O III] lines (shaded red), and a broader component (orange). The bottom panels show the residuals of the fits. |
| In the text | |
|
Fig. C.1. Rest-frame UV spectrum of CEERS-1019 (black) and best-fit synthetic models derived with FICUS: VMS_300_GRZ (red), VMS_300_GR (green), BPASS (violet), and SB99 (blue). Grey regions indicate wavelength intervals excluded from the fit. The lower panels show the light-weighted contributions of the SSP components (left), and zoom-ins on the N Vλ1240 (middle) and He IIλ1640 (right) spectral regions. |
| In the text | |
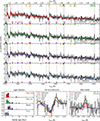 |
Fig. C.2. Same as Fig. C.1, but for CEERS-1025. |
| In the text | |
|
Fig. D.1. Relationship between the strength of the He II emission and the N V P-Cygni absorption (top left) and emission (top right), as predicted by different models. Models including VMS are shown in red and green, while those without VMS are shown in violet and blue. Solid and dashed lines correspond to metallicities of Z/Z⊙ = 10% and 20%, respectively. Measurements for CEERS-1019 and CEERS-1025 are indicated by stars, except for the broad He II component in CEERS-1019, which is derived from Gaussian decomposition. The bottom panel shows the strength of the He II emission as a function of its line width (FWHM), for VMS models (lines) and for CEERS-1019 and CEERS-1025 (stars) and other VMS-dominated systems and candidates: MrK71-A (blue), Sunburst cluster (light-blue), SB126 (green), IIZw40-A (orange), and R136 (red). |
| In the text | |
Current usage metrics show cumulative count of Article Views (full-text article views including HTML views, PDF and ePub downloads, according to the available data) and Abstracts Views on Vision4Press platform.
Data correspond to usage on the plateform after 2015. The current usage metrics is available 48-96 hours after online publication and is updated daily on week days.
Initial download of the metrics may take a while.