


| Issue |
A&A
Volume 711, July 2026
|
|
|---|---|---|
| Article Number | A301 | |
| Number of page(s) | 13 | |
| Section | Extragalactic astronomy | |
| DOI | https://doi.org/10.1051/0004-6361/202659281 | |
| Published online | 24 July 2026 | |
PRISMS: U37126, a very blue ISM-naked starburst at z = 10.255 with a nearly 100% Lyman continuum escape fraction
1
Geneva Observatory, Department of Astronomy, University of Geneva, Chemin Pegasi 51, CH-1290 Versoix, Switzerland
2
Centro de Astrobiología (CAB), CSIC-INTA, Ctra. de Ajalvir km 4 Torrejón de Ardoz, E-28850, Madrid, Spain
3
European Space Agency (ESA), ESA Office, Space Telescope Science Institute, 3700 San Martin Drive, Baltimore, MD 21218, USA
4
Department of Astronomy, Indiana University, 727 East Third Street, Bloomington, IN 47405, USA
5
Departamento de Física de la Tierra y Astrofísica, Facultad de Ciencias Físicas, Universidad Complutense de Madrid, E-28040 Madrid, Spain
6
Leiden Observatory, Leiden University, PO Box 9513, NL-2300 RA, Leiden, The Netherlands
7
INAF – Osservatorio Astronomico di Roma, Via Frascati 33, 00078 Monteporzio Catone, Italy
8
Kapteyn Astronomical Institute, University of Groningen, P.O. Box 800, 9700AV, Groningen, The Netherlands
9
Space Telescope Science Institute (STScI), 3700 San martin Drive, Baltimore, MD 21218, USA
10
Center for Frontier Science, Chiba University, 1-33 Yayoi-cho, Inage-ku, Chiba 263-8522, Japan
11
David A. Dunlap Department of Astronomy and Astrophysics, University of Toronto, 50 St. George Street, Toronto, Ontario M5S 3H4, Canada
12
Dunlap Institute for Astronomy and Astrophysics, 50 St. George Street, Toronto, Ontario M5S 3H4, Canada
13
Institute for Cosmic Ray Research, The University of Tokyo, 5-1-5 Kashiwanoha, Kashiwa, Chiba 277-8582, Japan
14
Division of Physics, Faculty of Pure and Applied Sciences, University of Tsukuba, Tsukuba, Ibaraki 305-8571, Japan
15
Tomonaga Center for the History of the Universe (TCHoU), Faculty of Pure and Applied Sciences, University of Tsukuba, Tsukuba, Ibaraki 305-8571, Japan
16
Department of Astronomy, University of Texas, Austin, TX 78712, USA
17
Institute of Science and Technology Austria (ISTA), Am Campus 1, 3400 Klosterneuburg, Austria
18
Department of Physics, School of Advanced Science and Engineering, Faculty of Science and Engineering, Waseda University, 3-4-1 Okubo, Shinjuku, Tokyo 169-8555, Japan
19
Waseda Research Institute for Science and Engineering, Faculty of Science and Engineering, Waseda University, 3-4-1 Okubo, Shinjuku, Tokyo 169-8555, Japan
20
DARK, Niels Bohr Institute, University of Copenhagen, Jagtvej 155A, 2200 Copenhagen, Denmark
21
University of Massachusetts Amherst, 710 North Pleasant Street, Amherst, MA 01003-9305, USA
22
Department of Astronomy, Stockholm University, Oscar Klein Centre, AlbaNova University Centre, 106 91 Stockholm, Sweden
23
AURA for the European Space Agency (ESA), Space Telescope Science Institute, 3700 San Martin Dr., Baltimore, MD 21218, USA
24
UK Astronomy Technology Centre, Royal Observatory Edinburgh, Blackford Hill, Edinburgh EH9 3HJ, UK
★ Corresponding author: This email address is being protected from spambots. You need JavaScript enabled to view it.
Received:
2
February
2026
Accepted:
19
June
2026
Abstract
We present very deep (≈11 hours on-source) JWST/MIRI low-resolution spectroscopy of the rest-frame optical emission of U37126, a UV-bright (MUV ≃ −20) mildly lensed (μ ≃ 2.2) galaxy at z = 10.255. The continuum emission is well detected in the NIRSpec and MIRI spectra, but no nebular recombination or metal emission lines are observed (EW0 (Hβ+[O III]) ≤ 300 Å and EW0 (Hα) ≤ 400 Å at 3σ). Combined with the exceptionally blue UV continuum slope, βUV ≃ −2.9, and flat Balmer break, these constraints indicate a stellar population dominated by very young and massive stars with a strongly suppressed nebular contribution. Comparisons with synthetic stellar population models indicate that U37126 requires a very high ionizing photon production efficiency, log(ξion/Hz erg−1) ≃ 25.75, and a nearly unity Lyman continuum escape fraction, of fesc ≥ 86% (3σ) based on the Hα flux limit and fesc = 0.94 ± 0.06 derived independently from fitting the spectral energy distribution (SED). The best-fit SED yields a (delensed) stellar mass of M★ ≃ 107.8 M⊙ and a star formation rate SFR ≃ 10 M⊙ yr−1 (specific SFR ∼ 160 Gyr−1). Together with its very compact size, reff ≃ 61 pc, this yields a very high stellar mass and SFR surface densities, ΣM★ ≃ 3 × 10³ M⊙ pc−2 and ΣSFR ≃ 400 M⊙ yr−1 kpc−2. Together with the lack of detectable nebular emission, these properties suggest that U37126 is undergoing a so-called interstellar medium-naked starburst phase, possibly driven by an extremely efficient gas-to-star conversion followed by strong feedback that has cleared the remaining gas from its stellar core, which allowed most Lyman continuum photons to escape. Finally, we show that even a small fraction of galaxies such as U37126 (≃3–6%), with an extreme Lyman continuum production and escape, might contribute disproportionately (≃50–100%) to the ionizing photon budget during cosmic reionization.
Key words: galaxies: high-redshift / galaxies: ISM / galaxies: starburst / dark ages / reionization / first stars
© The Authors 2026
 Open Access article, published by EDP Sciences, under the terms of the Creative Commons Attribution License (https://creativecommons.org/licenses/by/4.0), which permits unrestricted use, distribution, and reproduction in any medium, provided the original work is properly cited.
This article is published in open access under the Subscribe to Open model. This email address is being protected from spambots. You need JavaScript enabled to view it. to support open access publication.
1. Introduction
The James Webb Space Telescope (JWST) fundamentally reshapes our understanding of galaxy formation in the early Universe by enabling the detection and detailed characterization of the first galaxies within the first few hundred million years after the Big Bang (e.g., Castellano et al. 2022; Curtis-Lake et al. 2023; Harikane et al. 2023; Pérez-González et al. 2023; Carniani et al. 2024; Castellano et al. 2024; Harikane et al. 2024; Napolitano et al. 2025; Chemerynska et al. 2026; Naidu et al. 2026). Deep NIRCam imaging and NIRSpec spectroscopy provide unprecedented access to the rest-frame ultraviolet (UV) and optical emission of galaxies at redshifts z ≳ 7, while MIRI extends such studies to even higher redshifts. Together, JWST observations now robustly constrain the physical properties of the earliest galaxies that were previously inaccessible, including their stellar populations, star formation histories, and nebular emission (e.g., Álvarez-Márquez et al. 2024; Bunker et al. 2023; Fujimoto et al. 2024; Álvarez-Márquez et al. 2025; Helton et al. 2026; Zavala et al. 2025; Donnan et al. 2026; Roberts-Borsani et al. 2026; Tang et al. 2026).
The UV continuum slope, βUV ( ), is a widely used spectral diagnostic for the physical conditions in star-forming galaxies. Prior to JWST, observations established that typical star-forming galaxies at z ≳ 2 exhibit relatively blue UV slopes (β ≃ −2) and that the UV continua become systematically bluer toward higher redshifts and fainter UV luminosities (e.g., Bouwens et al. 2012; Finkelstein et al. 2012; Bouwens et al. 2014; Bhatawdekar & Conselice 2021). These trends are generally interpreted as reflecting lower dust attenuation and younger stellar populations in early galaxies. Recent JWST observations have extended these measurements even above z > 10 with improved precision, revealing an increasing prevalence of very steep UV slopes among the earliest galaxies (e.g., Topping et al. 2022; Cullen et al. 2023, 2024; Morales et al. 2024; Topping et al. 2024a; Dottorini et al. 2025; Messa et al. 2025; Saxena et al. 2026).
While moderately blue βUV can readily be produced by the hot massive stars expected in young stellar populations, it is considerably more challenging to achieve very steep slopes (β ≲ −2.6). It also requires additional physical conditions. At the young ages (≲10 Myr) necessary to generate such intrinsically blue stellar continua, nebular emission powered by ionizing photons typically contributes significantly to the observed spectrum, acting to redden the emergent UV spectrum (e.g., Bouwens et al. 2010). As a result, stellar population models generally predict that UV slopes approaching β ≃ −3 are rare or unobservable in systems in which ionizing photons are efficiently reprocessed by the surrounding gas (e.g., Katz et al. 2025). Extremely blue UV slopes thus indicate conditions in which the contribution of nebular emission to the emergent UV spectrum is strongly suppressed. This naturally occurs when a significant fraction of Lyman continuum (LyC; with > 13.6 eV) ionizing photons escape from H II regions before they are reprocessed into nebular line and continuum emission.
Galaxies exhibiting extremely steep UV slopes together with weak nebular emission thus are compelling candidates for systems with exceptionally high LyC escape fractions and enhanced ionizing photon output. This framework was first explored by Zackrisson et al. (2013, 2017), who showed that the combination of steep UV slopes and weak rest-optical emission lines provides a powerful means of identifying strong LyC emitters. This has the advantage of not only selecting sources with very high LyC fesc, but also with exceptionally high ionizing photon production efficiencies, ξion = QH/LUV, where QH is the hydrogen-ionizing photon production rate, and LUV is the UV luminosity. Such high ξion values are expected in very young stellar populations that are required to reproduce extremely steep UV continuum slopes.
Nevertheless, and with a few exceptions, (Marques-Chaves et al. 2022; Kim et al. 2023), confirmed that low-redshift LyC emitters exhibit only moderately blue βUV (Chisholm et al. 2022) and generally strong nebular emission lines, with rest-frame Hβ equivalent widths exceeding > 150 Å (e.g., Izotov et al. 2016, 2018; Flury et al. 2022). Only recently, JWST started to reveal a rare but non-negligible population of z > 6 sources with extremely blue UV slopes and weak nebular emission lines (Topping et al. 2022; Hainline et al. 2024; Donnan et al. 2025; Yanagisawa et al. 2025), often with inferred LyC escape fractions well above fesc > 50% (e.g., Giovinazzo et al. 2026).
We present the discovery of another such system, UNCOVER-37126 at z = 10.255 (hereafter U37126), which was previously identified by Atek et al. (2023) and was spectroscopically confirmed by Fujimoto et al. (2024). Leveraging ultra-deep JWST/MIRI spectroscopy of its rest-frame optical emission, together with ancillary NIRCam imaging and NIRSpec spectroscopy, we show that U37126 exhibits an extremely steep UV continuum slope and a nondetection of nebular emission lines, consistent with a LyC escape fraction close to unity. The paper is organized as follows. Section 2 presents the MIRI, NIRCam, and NIRSpec observations. Section 3 describes the observational results, which are discussed in Section 4. Finally, Section 5 summarizes our conclusions. Throughout this work, we use a concordance cosmology with Ωm = 0.31 and H0 = 67.7 km s−1 Mpc−1 (Planck Collaboration VI 2020).
2. JWST observations and data reduction
U37126 was observed with the Low Resolution Spectrograph (LRS; Kendrew et al. 2015) of the Mid-InfraRed Instrument (MIRI; Rieke et al. 2015; Wright et al. 2015, 2023) on 7–8 November 2025 as part of the PRImordial galaxy Survey with MIRI Spectroscopy at z ∼ 10 (PRISMS; program ID 8051; PIs: J. Álvarez-Márquez & L. Colina; Álvarez-Márquez et al. 2026). These observations provide a spectral coverage between a wavelength range of 4.80 − 14.0 μm using a  slit, that is, from λrest ≃ 0.43 − 1.20 μm in the rest frame, and a spectral resolution of R ∼ 100. The total on-source integration time was 39 696 s (≃11.0 h), obtained using a customized four-point dither strategy repeated over 12 dithers. The target acquisition was made using the F560W filter on a GAIA DR3 reference star.
The data reduction followed Álvarez-Márquez et al. (2026). Briefly, we used version 1.20.2 of the JWST calibration pipeline and CRDS context jwst_1464.pmap, following the standard MIRI LRS procedures (Bushouse et al. 2025) with additional custom steps to optimize background subtraction and artifact removal. These included wavelength masking, master and residual background subtraction, and sigma clipping to mitigate detector artifacts and cosmic-ray residuals. The final combined 2D spectrum and 1D extracted spectrum were produced using the pipeline stage 3, with the 1D spectrum extracted using a  aperture and corrected for aperture losses using the standard JWST reference files (jwst_miri_apcorr_0017.fits; for more details, see Álvarez-Márquez et al. 2026).
In addition to the MIRI LRS observations, NIRCam imaging and NIRSpec spectroscopy of U37126 are publicly available as part of the UNCOVER project1. NIRCam photometry, combining medium- and broadband filters from F070W to F480M, was taken from the UNCOVER DR3 SUPER catalog (Suess et al. 2024; Weaver et al. 2024). NIRSpec Micro-Shutter Assembly (MSA) spectroscopy, obtained with the low-resolution PRISM (R ∼ 100), was taken from the UNCOVER data release 4 (Bezanson et al. 2024). We used the fully reduced and calibrated NIRSpec spectrum (≃4.4 hours on-source) published by Fujimoto et al. (2024). Finally, we adopted the updated gravitational magnification from the UNCOVER DR4, μ = 2.19 ± 0.05 (Furtak et al. 2023; Price et al. 2025).
To place all JWST observations of U37126 on a consistent relative flux scale, we first computed synthetic NIRSpec photometry convolving the NIRSpec spectrum with the filter transmission functions of all medium- and broadband NIRCam filters in which the source was significantly detected (≥3σ; F150W–F480M) and compared it to the corresponding NIRCam photometry. This yielded a scaling factor of ≃1.41, which was applied to the NIRSpec spectrum. For the MIRI LRS spectrum, we computed synthetic photometry over the common spectral range λobs = 4.85 − 5.30 μm, where the continuum is significantly detected in NIRSpec and MIRI. The flux densities between the two spectra in this region are consistent, and we therefore applied no additional scaling to the MIRI LRS spectrum. Figure 1 shows the combined NIRSpec and MIRI spectra together with the NIRCam photometry.
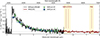 |
Fig. 1. NIRSpec/PRISM (black) and MIRI/LRS (red) spectra of U37126 with the 1σ uncertainties shown in gray. The expected locations of the main rest-frame optical emission lines, Hβ, [O III] λλ4960,5008, and Hα, are indicated with dashedred lines. NIRCam photometry from broad- and medium-band filters is overplotted in blue and green, respectively. |
3. Results
U37126 was first identified by Atek et al. (2023) as a photometric redshift candidate at  based on NIRCam photometry (ID: 39074). A spectroscopic redshift of zspec = 10.255 ± 0.001 was subsequently reported by Fujimoto et al. (2024) based on the unambiguous detection of the Lyα break. A tentative detection of the N III] λ1750 emission line was also discussed by Fujimoto et al. (2024), but we found no significant emission at the reported wavelength, nor evidence of any other rest-frame UV or optical emission lines in the NIRSpec and MIRI spectra (Fig. 1). We therefore adopted the redshift z = 10.255 ± 0.001 inferred from the Lyα break throughout this work. Finally, U37126 was recently observed in the far-infrared with ALMA, but neither dust continuum emission nor [O III] 88 μm line emission was detected, yielding upper limits of log(Mdust/M⊙) < 6.06 and L([O III] 88 μm) < 2 × 10⁸ L⊙, respectively (Algera et al. 2025).
3.1. Spectral properties from NIRSpec, NIRCam, and MIRI
The βUV was measured using several independent methods based on NIRSpec and NIRCam. We first fit the NIRSpec/PRISM spectrum over a broad and continuous rest-frame window, 1400 − 3600 Å, thereby excluding regions that might be affected by intergalactic medium (IGM) absorption blueward of 1400 Å and by the Balmer break at longer wavelengths. A power-law fit using lmfit (Newville et al. 2025) yielded βUV = −2.79 ± 0.07. We then adopted the continuum windows defined by Calzetti et al. (1994), which avoid ISM absorption features, stellar P-Cygni profiles, and nebular emission lines. To remain consistent with the above criteria, we restricted the fit to windows at λrest ≥ 1400 Å, obtaining βUV = −2.83 ± 0.09. As an alternative spectral diagnostic, we fit a first-order polynomial to the wavelength intervals 2180 − 2220 Å and 2780 − 2820 Å following Leitherer et al. (1999). This method yielded βUV = −3.05 ± 0.16. Finally, we used the NIRCam broadband photometry in F200W and F277W, which sample the rest-frame range λrest ≃ 1800 − 2500 Å. From this, we obtained βUV = −2.86 ± 0.20. Taken together, these independent diagnostics consistently indicate that U37126 shows a steep UV continuum slope, all with βUV ≲ −2.7. Taking the simple average of these measurements, obtained from different spectral regions and instruments (NIRSpec and NIRCam), and adopting their standard deviation as the uncertainty, we derived a fiducial UV slope of βUV = −2.88 ± 0.10.
Another key spectral diagnostic is the strength of the Balmer break, which is sensitive to the age of the stellar population and to the relative contribution of nebular emission. For consistency and to facilitate a direct comparison with the stellar population models discussed next in Section 3.2, we estimated the Balmer break strength of U37126 from the NIRSpec spectrum as the flux density ratio (in Fν) between λrest = 4200 Å and λrest = 3400 Å, measured within spectral windows of width Δλrest = 400 Å. We find a ratio of  . For comparison, using the observed NIRCam photometry in the F356W and F444W filters, which sample the emission shortward and longward of the Balmer break, respectively, we derived a consistent flux density ratio of
  . As discussed further in Section 3.2, the inferred Balmer break strength rules out single-burst stellar populations older than ≳6 Myr and continuous star formation histories with ages ≳16 Myr.
Finally, we analyzed the MIRI/LRS spectrum. At the redshift of U37126 (z = 10.255), the Hβ, [O III] λλ 4960,5008, and Hα emission lines are expected at λobs = 5.47 μm, 5.64 μm, and 7.39 μm, respectively, but none of them are significantly detected (Fig. 1)2. We estimated their upper flux limits by measuring the root mean square (rms) of the spectrum within a rest-frame window of Δλ = 300 Å centered on the expected position of each line (yellow regions in Figure 1), and we adopted the MIRI/LRS instrumental resolutions of R ≃ 49 and R ≃ 89 for [O III] and Hα, respectively (Kendrew et al. 2015), that is, we assumed that the emission lines are unresolved. We also considered an intrinsic [O III] 5008/4960 ratio of 2.98 (Osterbrock & Ferland 2006).
Under these assumptions, we derived 3σ limits of F ([OIII] λ5008) ≤ 6.6 × 10⁻¹⁹ erg s−1 cm−2 and F (Hα) ≤ 6.9 × 10⁻¹⁹ erg s−1 cm−2. The continuum emission is significantly detected in the MIRI/LRS ranges λobs = 4.8 − 5.6 μm (37.2 ± 4.1 nJy) and 5.85 − 6.73 μm (26.1 ± 5.3 nJy), while no significant signal is observed at λobs ≥ 7.0 μm (≤28 nJy at 3σ). We estimated the continuum emission at the wavelengths of [O III] λ5008 and Hα from the best-fit spectral energy distribution (SED, Section 3.3), finding continuum flux densities of ≃35.8 nJy and ≃27.7 nJy, respectively. These values imply 3σ rest-frame equivalent-width limits under EW0([O III] λ5008)≤174 Å and EW0(Hα)≤400 Å. For Hβ, we assumed case-B recombination with an intrinsic line ratio of IHα/IHβ = 2.78, assuming Te = 1.5 × 10⁴ K and ne = 103 cm−3 (Luridiana et al. 2015). This yielded an upper limit of F(Hβ)≤2.5 × 10⁻¹⁹ erg s−1 cm−2 and EW0(Hβ)≤64 Å. We emphasize that the Hβ flux and equivalent-width limits are dependent on the assumed case-B recombination conditions. These measurements are summarized in Table 1.
Summary of the properties of U37126. Global quantities have been corrected for lensing magnification.
Finally, we briefly examined the spectral region around Lyα. Figure 2 shows the rest-frame Lyα break of U37126, and for comparison, that of MACS0647-JD (Heintz et al. 2024), a star-forming galaxy at a similar redshift (z = 10.170) and with comparable global properties (e.g., stellar mass and star formation rate). MACS0647-JD exhibits a strong damped Lyα absorption feature, corresponding to a neutral hydrogen column density of NHI ≃ 2.5 × 1022 cm−2 (Heintz et al. 2024). In contrast, U37126 shows a very sharp Lyα break, suggestive of a low H I column density along the line of sight. A recent analysis of U37126 by Mason et al. (2026) modeled the Lyα break using the low-resolution PRISM spectrum and inferred a neutral hydrogen column density of log(NHI/cm−1) = 19.2 ± 1.5. Although formally higher than the optically thin limit for LyC escape (NHI ≲ 2 × 1017 cm−2), the large uncertainty remains statistically consistent with a very high escape fraction at ∼1.3σ level.
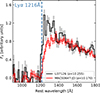 |
Fig. 2. Comparison of the rest-frame Lyα break of U37126 (black) with that of MACS0647-JD (z = 10.170), which shows a strong damped Lyα absorption feature (NHI ≃ 2.5 × 1022 cm−2, Heintz et al. 2024). |
3.2. Predictions from synthetic stellar models
We compare the observed spectral properties derived in Section 3.1 with predictions from synthetic stellar population models. We adopted the Binary Population and Spectral Synthesis models (BPASS v2.2.1; Stanway & Eldridge 2018), using their default IMF with a slope of −2.35 and an upper mass cutoff of 300 M⊙ (imf135_300). We assumed a metallicity Z = 0.003 (Z/Z⊙ ≃ 0.15 for Z⊙ = 0.02), consistent with values reported for galaxies of comparable MUV at similar redshifts (e.g., Stiavelli et al. 2023; Boyett et al. 2024; Hsiao et al. 2024; Álvarez-Márquez et al. 2025; Helton et al. 2026). Predictions for additional metallicities, from solar to Z/Z⊙ = 0.5%, are presented in Appendix A (Figures A.1–A.4, respectively).
We considered instantaneous-burst and constant star formation histories, with ages from 1 to 100 Myr. For each model, we computed the ionizing photon production rate QH and predicted the associated nebular continuum emission using PyNeb (Luridiana et al. 2015). We assumed nebular conditions with Te = 1.5 × 10⁴ K and ne = 103 cm−3 that are expected at very high redshifts (e.g., Isobe et al. 2023), and we included free–free and free–bound emission by H and He, and the two-photon continuum of H. Hydrogen recombination-line luminosities (e.g., Hα) were obtained using the coefficients from Osterbrock & Ferland (2006). We additionally included the contribution of the Hγ and Hδ emission lines, as these are sampled by the spectral regions used to infer the Balmer break strength ( , see next). The total emergent spectrum is then given by Ftotal = Fstellar + (1 − fesc)×Fnebular, where the factor (1 − fesc) accounts for the ionizing escape fraction, that is, LyC photons not reprocessed into nebular emission. We also assumed negligible dust attenuation given the extremely steep UV slope.
For each model and fesc, we measured the UV slope, Balmer-break strength, and EW0 (Hα) using the same method as applied to U37126 (Section 3.1). Figure 3 (top) shows the predicted quantities as a function of age for fesc = 0, 0.5, and 0.9 (red, green, and blue, respectively). Overall, we recover the expected trends already discussed in previous works: increasing fesc suppresses the nebular continuum and line emission, yielding steeper UV slopes and lower EW0 (Hα) at a fixed age (e.g., Zackrisson et al. 2013, 2017). UV slopes steeper than βUV < −2.7 necessarily require a substantial escape of ionizing photons, and this is expected to hold regardless of the assumed IMF, metallicity, and age of the underlying stellar population (cf. Katz et al. 2025; Schaerer et al. 2025), and more broadly, for any ionizing source.
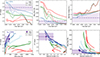 |
Fig. 3. Predictions from BPASS synthetic stellar and nebular emission models (Z/Z⊙ ≃ 0.15, Te = 1.5 × 10⁴ K, and ne = 103 cm−3) for the UV continuum slope (βUV), EW0 (Hα), and the Balmer break strength ( |

The Balmer break, traced here by the flux density ratio  , is close to unity for all burst and constant-SFH models at young ages, reflecting the strong contribution of nebular continuum in the
  but also the emission lines (Hγ and Hδ) to
  , unless fesc is very high (90%, blue). At ages ≳6 Myr (≳15 Myr) for single-burst models (constant star formation), the strength of the Balmer break increases with the stellar age, reflecting the rising contribution of lower-mass stars (A-type) to the integrated spectrum (e.g., Kuruvanthodi et al. 2024; Looser et al. 2024; Baker et al. 2025).
The observational constraints for U37126 are overplotted in Fig. 3. They favor stellar populations with very high fesc along with young ages, ≃2 − 10 Myr for constant star formation or ≃1 − 3 Myr for single-burst models. Thus, our results indicate that the lack of nebular emission in the MIRI/LRS spectrum is primarily driven by an exceptionally high fesc and very young stellar populations and not by an evolved population with reduced LyC production. While single stellar population models (dashed red in Fig. 3) with ages > 6 Myr can match the observed EW0(Hα) upper limit, they cannot simultaneously reproduce the observed steep UV slope and weak Balmer break. As a simple estimate, we considered a 5 Myr constant-SFH BPASS model redshifted to z = 10.255 and scaled to match the observed spectrum. This scaled BPASS model, shown in Figure 5 (violet), has log(QH/s−1)≃54.4 (delensed) and a high ionizing photon production efficiency, log(ξion/Hz erg−1) ≃ 25.75. For comparison, if we had used the Hα limit assuming fesc = 0, we would obtain log(ξion/Hz erg−1) ≤ 25.02 (2σ), that is, we would underpredict its true ξion by > 0.73 dex. Together with our upper limit on the Hα luminosity (L (Hα) ≤ 4.5 × 1041 erg s−1, delensed), our results indicate an fesc ≥ 86% at 3σ for U37126, assuming a stellar metallicity of 15% Z⊙. Figure 4 shows the corresponding 3σ limits on the LyC escape fraction derived using the same method across a range of stellar metallicities (0.5% to 100% Z⊙) and gas electron temperatures (1.0–2.5 × 10⁴ K). At low metallicities (≤0.15 Z⊙), we find fesc ≥ 86–91% (3σ), whereas at higher metallicities (∼0.5–1.0 Z⊙), the limits decrease to fesc ≥ 69–80% (3σ). We note, however, that other independent indicators (e.g., βUV) still favor high escape fractions at higher metallicities (fesc ≳ 90%; see Figures A.1 and A.2).
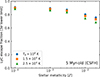 |
Fig. 4. Limits (3σ) on the Lyman continuum escape fraction derived from the upper limit on the observed (delensed) Hα luminosity as a function of stellar metallicity (from 0.5% to 100% solar) assuming a 5 Myr constant-SFH. Different symbols and colors correspond to assumed gas electron temperatures of 104 K (blue), 1.5 × 10⁴ K (orange), and 2.5 × 10⁴ K (green). |
In summary, our results indicate a high LyC escape fraction that is largely independent of the assumed stellar population properties (fesc ≥ 86% at 3σ for our fiducial model). We emphasize that given the limited observational constraints, these conclusions are also somewhat agnostic to the nature of the ionizing source. In particular, regardless of whether the ionizing radiation is dominated by a young stellar population or includes a contribution from an AGN, the combination of a hot ionizing source (βUV ≃ −2.9) and the lack of detectable nebular emission implies that only a small fraction of ionizing photons is absorbed by the interstellar medium.
3.3. Spectral energy distribution and global properties
We fit the SED using the SpectroPhotometric version of the code CIGALE (V.2022.1; Burgarella et al. 2005; Boquien et al. 2019; Burgarella et al. 2025), incorporating all NIRCam photometry, the NIRSpec/PRISM spectrum, and MIRI/LRS measurements of the [O III] λ5008 and Hα upper flux limits and the continuum emission between λobs = 4.8 − 5.6 μm, 5.85 − 6.73 μm, and > 7.0 μm (see Section 3.1). We excluded all observations below λrest < 1400 Å from the fit since they may be affected by IGM absorption and the effect is not properly handled by CIGALE.
The star formation history (SFH) was modeled assuming constant star formation with ages varying from 1 to 20 Myr in steps of 1 Myr. We adopted stellar population models from Bruzual & Charlot (2003), assuming a Chabrier (2003) IMF and metallicities from Z/Z⊙ = 2 − 20%. The ionization parameter ranged from log(U) = −3.0 to −1.5 in 0.5 dex steps. We adopted the Milky Way dust extinction law from Cardelli et al. (1989) with RV = 3.1 as the dust attenuation law for the nebular emission and the Calzetti et al. (2000) for the stellar emission. The color excess of the nebular gas was allowed to vary from 0 to 0.5 mag. The escape of LyC photons was allowed to vary from 0 to 0.999. Finally, we added an uncertainty of 10% to all dataset points to account for cross-calibration systematics between NIRSpec, NIRCam, and MIRI.
Our best-fit SED model ( ), shown in Figure 5, is characterized by a stellar population with a constant star formation rate SFR = 9.6 ± 4.6 M⊙ yr−1 (10 Myr weighted), a stellar mass log(M★/M⊙) = 7.7 ± 0.06, and an age of 6.8 ± 1.6 Myr (where global properties are corrected for magnification, assuming μ = 2.19). This yields a specific star formation rate sSFR = 160 ± 80 Gyr−1. The color excess is negligible, E(B − V) = 0.01 ± 0.01 mag., as expected given the very steep UV slope of the best-fit model, βUV = −2.85 ± 0.05 (and consistent with our measurements in Section 3.1). The nebular metallicity is found to be Z/Z⊙ = 7.8 ± 7.1%.
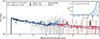 |
Fig. 5. Best-fit SED of U37126 derived with CIGALE (solid black curve) and a pure stellar 5 Myr old BPASS model (CSFH with Z/Z⊙ = 15%, dashed violet line). The NIRSpec/PRISM and MIRI/LRS spectra are shown in gray and red, respectively, and NIRCam photometric measurements and MIRI/LRS synthetic photometry are indicated by blue and red circles. The inset panel displays the posterior probability density function of the Lyman continuum escape fraction. |
The best-fit model also provides a very high LyC escape fraction, fesc = 0.94 ± 0.06 (Figure 5, inset panel), consistent with the results obtained in Section 3.2. Finally, using the demagnified size of reff = 61 ± 6 pc derived next in Section 3.4, we obtained a stellar mass and SFR surface densities of log(ΣM★/M⊙ pc−2) = 3.40 ± 0.10 and log(ΣSFR/M⊙ yr−1 kpc−2) = 2.61 ± 0.22, respectively. These values are substantially higher than those of typical star-forming galaxies at high-z (e.g., Morishita et al. 2024) and are instead comparable to those found in young massive star clusters and globular clusters (e.g., Vanzella et al. 2023) and in some of the most extreme sources at the highest redshifts (Castellano et al. 2022; Tacchella et al. 2023; Naidu et al. 2026). These properties are summarized in Table 1.
3.4. Morphology and size
The morphology of U37126 is compact in the NIRCam imaging, as illustrated in the top panels of Fig. 6. To quantify its structural properties, we modeled the light distribution using PySersic (Pasha & Miller 2023). PySersic performs forward modeling of galaxy morphologies with Sérsic profiles convolved with a supplied point spread function (PSF) and employs a Bayesian framework to explore the posterior distribution of all parameters and their degeneracies.
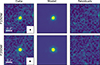 |
Fig. 6. NIRCam F150W (top) and F200W (bottom) 1″ × 1″ cutouts of U37126. The middle and right panels show the Sérsic best-fit models obtained with PySersic and the corresponding residuals, respectively. The PSFs are shown in the left panels. |
Empirical PSFs from the UNCOVER DR4 release (Suess et al. 2024; Weaver et al. 2024) are available for all NIRCam bands, but only at a pixel scale of 0.04″ pix−1. Because the short-wavelength NIRCam images (e.g., F150W and F200W) have been resampled in UNCOVER DR4 to a pixel scale of 0.02″ pix−1, we generated PSFs for these bands using STPSF3 (Perrin et al. 2014). We followed Morishita et al. (2024) and Weibel et al. (2024) and set the jitter_sigma parameter in WebbPSF to 0.022, which has been shown to reproduce the observed NIRCam PSFs best.
We fit 2D Sérsic models, allowing the Sérsic index to vary between 0.5 and 6.0, while leaving the total flux, effective radius, ellipticity, and position angle free. Given the significantly higher S/N in the NIRCam broadband filters relative to the medium bands, we restricted our morphological analysis to the broadband imaging alone and also excluded the F444W image for the same reason (low S/N). Each fit was performed on a 1″ × 1″ cutout, and all fits were centered on U37126.
For the short-wavelength NIRCam images, we measured effective radii of reff = 24 ± 2 mas in F150W and reff = 22 ± 2 mas in F200W, respectively (Figure 6), and a Sérsic index of n = 1.64 ± 0.26. We adopted the F200W value, as this band probes the rest-frame UV at ≃1750 Å. Because U37126 is moderately magnified by A2744, with μ = 2.19 ± 0.05 (Furtak et al. 2023; Price et al. 2025), we obtained a demagnified radius of reff = 61 ± 6 pc at z = 10.255. At longer wavelengths, the best-fit models yield reff ≲ 0.5 pix (or reff ≲ 0.02″). Thus, U37126 appears to be unresolved in the rest-optical with reff < 160 pc (or < 100 pc after lensing correction).
4. Discussion
4.1. Comparison with other confirmed strong LyC emitters and z > 6 candidates
Our results strongly support a scenario in which U37126 produces and leaks large numbers of LyC photons. These constraints are driven by the combination of its extremely steep UV continuum and the nondetection of nebular emission, and indirectly, from the very sharp Lyα break. Although extreme, similar properties have been identified with JWST in a small number of sources at z ∼ 6 − 10 (Topping et al. 2022; Hainline et al. 2024; Yanagisawa et al. 2025; Giovinazzo et al. 2026; Jecmen et al. 2026). These galaxies share comparably blue UV continua and unusually weak nebular emission, which indicates very young stellar populations with very high LyC fesc. Interestingly, several of these galaxies also show high SFRs within extremely compact morphologies (reff < 260 pc). This results in a very high ΣSFR, comparable to that inferred for U37126, log(ΣSFR/M⊙ yr−1 kpc−2)≃2.6, and it is consistent with expectations for strong LyC leakage (Sharma et al. 2017; Naidu et al. 2020).
Recent JWST studies have further suggested a dichotomy among galaxies at z ≳ 10 (Harikane et al. 2025; Roberts-Borsani et al. 2026), separating extended systems with relatively weak emission lines, in some cases, accompanied by Balmer breaks (Harikane et al. 2026; Álvarez-Márquez et al. 2026), which might be undergoing a recent decline in star formation (e.g., Helton et al. 2026), from very compact galaxies (reff ≲ 100 pc) experiencing recent bursts and exhibiting strong UV and/or optical emission lines (e.g., Bunker et al. 2023; Castellano et al. 2024; Álvarez-Márquez et al. 2025; Zavala et al. 2025). Figure 7 shows the effective radius and star formation rate surface density of the small sample of z > 10 sources with MIRI constraints on the rest-optical emission. The color scale encodes the rest-frame equivalent width EW0(Hβ+[O III]). Compact systems generally occupy the regime of high ΣSFR and large equivalent widths. U37126 lies in this compact high-ΣSFR regime, but shows unusually weak nebular emission, which is naturally explained by its very high LyC escape fraction.
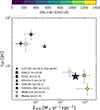 |
Fig. 7. Effective radius (reff) as a function of star formation rate surface density (ΣSFR) for galaxies at z > 10 with MIRI constraints on EW0 (Hβ+[O III]) (color-coded, from Castellano et al. 2022; Goulding et al. 2023; Tacchella et al. 2023; Calabrò et al. 2024; Carniani et al. 2024; Álvarez-Márquez et al. 2025; Helton et al. 2026; Zavala et al. 2025; Harikane et al. 2026, and Álvarez-Márquez et al. 2026). The symbols denote individual sources, and the open symbols indicate sources without available EW0 measurements (Arrabal Haro et al. 2023; Naidu et al. 2026). U37126 (star) occupies the compact high-ΣSFR regime, but shows unusually weak nebular emission with EW0 (Hβ+[O III]) < 296 Å (3σ) compared to other compact systems (e.g., GNz11 and GHz2), consistent with a high LyC escape fraction. |
To further place U37126 in context, we compared its observed properties with those of confirmed LyC emitters at lower redshifts (z < 4), where LyC escape can be measured directly. We first note that the majority of known LyC emitters exhibit relatively modest escape fractions and UV slopes βUV > −2.5 (e.g., Izotov et al. 2018; Steidel et al. 2018; Marques-Chaves et al. 2021; Flury et al. 2022; Kerutt et al. 2024). Only a small subset shows fesc > 50%, and nearly all of them exhibit strong nebular emission, with typical Hβ equivalent widths of ∼100 − 300 Å (de Barros et al. 2016; Izotov et al. 2016; Vanzella et al. 2016; Izotov et al. 2018; Rivera-Thorsen et al. 2019; Flury et al. 2022). An exception is the strong LyC leaker J1316+2614 at z = 3.6, which has a measured fesc ≃ 87%, EW0 (Hβ)≃35 Å, and βUV ≃ −2.6 (Marques-Chaves et al. 2022) although it is much brighter. It represents the closest known analog to U37126 and to other z > 6 strong LyC emitting candidates with steep UV slopes and weak nebular emission.
At face value, the observed high fesc and strong nebular emission in some confirmed strong LyC emitters appear to be at odds with the predictions and with the properties of U37126 (Fig. 3). However, these observations are not necessarily contradictory. The measured fesc in low-z LyC emitters probes LyC escape along the line of sight toward the young stars, whereas nebular emission traces a more global 4π-averaged escape fraction. Strongly anisotropic LyC leakage can therefore result in high apparent fesc values while still producing prominent nebular emission (e.g., Flury et al. 2022; Jaskot et al. 2024a). In addition, LyC flux measurements close to the Lyman limit may be boosted by nebular bound-free emission (Inoue 2010; Simmonds et al. 2024b), potentially leading to an overestimation of the stellar fesc. As recently shown by Izotov et al. (2025), this effect appears to be significant in J1243+4646, the strongest LyC emitter at z ≃ 0.3 that is also a strong line emitter (fesc ≃ 72% and EW0 (Hβ) ≃ 221 Å, Izotov et al. 2018).
These results thus suggest that sources such as U37126, which are characterized by very steep UV slopes with faint nebular emission, may be rare or absent at z < 4. However, it remains unclear whether this reflects a genuinely low number density at lower redshifts, possibly due to the specific physical conditions required to form such systems (see Section 4.2), or if they have been systematically overlooked in LyC surveys due to selection effects (e.g., Bergvall et al. 2013), as the confirmation of spectroscopic redshifts generally relies on strong nebular emission.
4.2. Conditions for forming ISM-naked starbursts with a LyC escape fraction of nearly unity
The nature of sources such as U37126 is intriguing because typical starburst galaxies are gas rich and exhibit strong nebular emission. The stringent 3σ upper limits on the equivalent widths, together with the very steep UV continuum and a weak or flat Balmer break strength, indicate that nebular emission is intrinsically weak and that a small fraction of LyC photons at most is being reprocessed by the surrounding gas.
To obtain a rough estimate of the characteristic size of the ionized region associated with U37126, we computed the Strömgren radius,
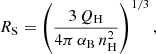
where QH ≈ 1054.4 s−1 (Section 3), nH is the hydrogen number density of the surrounding gas, and αB is the case-B recombination coefficient. For typical electron temperatures Te ≃ (1–2)×104 K and gas densities nH ≃ 102–103 cm−3, we infer Strömgren radii of RS ≈ 50 − 200 pc. These scales are comparable to or exceed the size of the stellar emission (reff ≃ 61 pc; Section 3.4). Under such extreme conditions, any substantial gas reservoir located within or around U37126 is expected to be efficiently ionized, and therefore, most likely detectable in the NIRSpec and MIRI spectra.
One possible exception is a scenario in which the ionized gas is extremely diffuse, because the line luminosities scale as  . Even if all LyC photons were fully reprocessed within H II regions, the nondetection of Hα emission might, in principle, be explained by an extremely low electron density (ne ≲ 10−2 cm−3). However, such conditions are rarely observed and are particularly unlikely for U37126 (z = 10.255), given the expected increase in the electron density toward higher redshifts (e.g., Isobe et al. 2023). Moreover, the extreme stellar mass and SFR surface densities of U37126 would instead favor high electron densities (e.g., Reddy et al. 2023a,b). Consistent with this expectation, nearly all sources at z > 10 with sizes comparable to that of U37126 (reff ≈ 61 pc) exhibit evidence for extremely high gas densities (Harikane et al. 2025), several of them shown in the bottom right corner of Figure 7 (e.g., GNz11 and GHz2). Taken together, the absence of detectable nebular emission in U37126 suggests that the galaxy is largely depleted of its interstellar medium. U37126 thus behaves as an ISM-free starburst, raising the question of how such conditions can be achieved.
One possibility is that during its intense star formation episode, the bulk of the natal gas in U37126 was rapidly and efficiently converted into stars, leaving little residual gas available to absorb and reprocess LyC photons. Dekel et al. (2023) (see also Li et al. 2024) predicted that extremely high gas surface densities (Σgas ≳ 3 × 10³ M⊙ pc−2) can lead to the formation of feedback-free starbursts (FFB), in which gas clouds collapse on very short free-fall timescales (∼1 Myr). This makes star formation very efficient, since the cloud collapse occurs before the onset of mechanical feedback (e.g., SNe). While the gas surface density of U37126 cannot be measured directly, the observed stellar mass surface density, log(ΣM★/M⊙ pc−2) = 3.40 ± 0.10, suggests a pre-star formation gas surface density of at least comparable magnitude, thus satisfying the condition for an FFB. Observationally, high star-formation efficiencies have been inferred (> 40%; Dessauges-Zavadsky et al. 2025) and predicted (> 70%; Marques-Chaves et al. 2024) to explain the strong LyC escape that was directly measured in the strong leaker J1316+2614 at z = 3.6 with fesc ≈ 87% and EW0 (Hβ)≃35 Å (Marques-Chaves et al. 2022).
An alternative but not mutually exclusive scenario is that strong feedback has removed gas and dust from the stellar core of U37126, and potentially to larger distances4. In this context, Ferrara et al. (2023) proposed that radiation pressure on dust and gas can drive powerful radiative feedback during super-Eddington phases. These conditions are expected in the early stages of a starburst, when the sSFR exceeds a critical threshold of ≳25 Gyr−1 (Fiore et al. 2023), which is satisfied in this source (≃160 Gyr−1). These phases can also facilitate substantial LyC leakage, as shown recently by Ferrara et al. (2025). Furthermore, recent hydrodynamic simulations have shown that strong radiative outflows can only be efficiently launched in very dense systems with high star formation efficiencies, leading simultaneously to strong LyC leakage (Menon et al. 2025). Observational evidence of extreme outflows like these has been reported in a handful of powerful starbursts with an elevated sSFR (Crespo Gómez et al. 2025; Marques-Chaves et al. 2026), including in confirmed low-z LyC emitters (e.g., Komarova et al. 2025). However, these systems still exhibit intense nebular emission, unlike U37126.
In summary, the absence of detectable gas in U37126 might reflect an evolutionary sequence in which exceptionally efficient star formation rapidly consumes the natal gas, followed by intense feedback that expels the remaining material, including dust, from the stellar core. In the absence of subsequent gas accretion, U37126 might then evolve rapidly into a post-starburst or recently quenched system, such as the systems recently identified by JWST at high-z (e.g., Looser et al. 2024).
4.3. Implications for cosmic reionization
The discovery of powerful ionizing sources such as U37126 has important implications for cosmic reionization. The ionizing photon budget is commonly expressed through the comoving ionizing emissivity, ṅion, defined as ṅion = ρUV ξion fesc, where ρUV is the integral of the UV luminosity function (Robertson et al. 2013). Observations indicate that the average galaxy population in reasonably complete samples down to MUV ≈ −17 at z ≳ 6 exhibits log(ξion/Hz erg−1)≃25.2 − 25.3 (e.g., Choustikov et al. 2024; Mascia et al. 2024; Simmonds et al. 2024a; Pahl et al. 2025; Begley et al. 2026), which is consistent with or only marginally higher than pre-JWST canonical values (e.g., Robertson et al. 2015). For these ξion, reionization models typically require population-averaged escape fractions of fesc ≃ 10 − 20% (Robertson et al. 2015), which is broadly supported by inferences using indirect LyC indicators (Mascia et al. 2023; Jaskot et al. 2024b; Jecmen et al. 2026), but with large scatter and sensitive to assumptions about the faint-end slope and cutoff of the UV luminosity function (e.g., Finkelstein et al. 2019; Korber et al. 2026). For simplicity, we adopted a fiducial scenario in which reionization is sustained by an averaged galaxy population characterized by fesc = 15% and log(ξion/Hz erg−1) = 25.25.
We now consider a simple illustrative scenario in which the ionizing budget is fully dominated by sources similar to U37126. Owing to their exceptionally high ξion and near-unity fesc, such systems might contribute disproportionately to ṅion even though they are rare. Requiring the ionizing emissivity contributed by these extreme sources to match that of the fiducial galaxy population yields

where fN is the fraction of such extreme sources relative to the total galaxy population. Adopting the properties inferred for U37126, log(ξion/Hz erg−1)≃25.75 and fesc ≥ 86% (3σ; Section 3), we find fN ≲ 6%.
While this scenario is intentionally simplistic, implicitly assuming that such extreme values of ξion and fesc are independent of UV luminosity and populate the full luminosity function, it nevertheless illustrates that even a tiny fraction of powerful ionizing sources such as U37126 might contribute significantly, or might even dominate the ionizing photon budget during reionization. This picture is consistent with the results of Papovich et al. (2026), who reported that the majority (≃82%) of galaxies at z ≃ 5 − 8 exhibit negligible LyC escape (fesc < 1%), while only a small subset are strong LyC emitters, suggesting a highly bimodal distribution in fesc where reionization might be driven by rare but efficient leakers.
In this regard, recent JWST observations have revealed a progressive steepening of UV slopes with increasing redshift (e.g., Topping et al. 2022; Cullen et al. 2024; Austin et al. 2025; Dottorini et al. 2025), with several sources at z ≳ 6 exhibiting extremely blue continua (βUV < −2.8). As illustrated in Fig. 8, such UV slopes require very young stellar populations, implying elevated ionizing photon production efficiencies, ξion ≳ 1025.6 Hz erg−1, together with high LyC escape fractions (fesc ≳ 50%; see Fig. 3). Moreover, the statistical analysis of Topping et al. (2024b) identified a small but non-negligible fraction (≃3.4%) of high-redshift sources with βUV < −2.8 and indications of weak nebular emission, closely resembling U37126, which is comparable to the fN ≲ 6% of extreme LyC emitters required in our illustrative scenario. If spectroscopically confirmed, such systems might already account for a substantial fraction (≳50%) of the total ionizing photon budget during cosmic reionization.
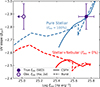 |
Fig. 8. Relation between the UV slope (βUV) and the ionizing photon production efficiency (ξion) for stellar population synthesis models with (red) and without (blue) the contribution of nebular emission, i.e., representing the extreme cases of fesc = 0 and fesc = 1, respectively. The filled and open circles indicate ξion derived from the SED fitting and from the Hα flux limit assuming fesc = 0, respectively. |
5. Summary and conclusions
We have presented very deep (≃11 h on-source) JWST/MIRI LRS rest-frame optical spectroscopy of U37126, a MUV = −20.10 mildly lensed (μ ∼ 2.2) galaxy at z = 10.255 previously identified with NIRSpec spectroscopy by Fujimoto et al. (2024). The source exhibits an exceptionally steep UV continuum slope, βUV ≃ −2.9, a weak Balmer break, a sharp Lyman-α break, and intrinsically faint nebular emission. Despite the clear detection of the continuum in the NIRSpec/PRISM and MIRI/LRS spectra, no recombination or metal emission lines are detected. We derived stringent 3σ rest-frame equivalent width upper limits of ≤64 Å, ≤174 Å, and ≤400 Å for Hβ, [O III] λ5008, and Hα, respectively.
Combining these observational constraints with synthetic stellar population models, we showed that the spectral properties of U37126 require extremely young stellar ages and a very high Lyman-continuum escape fraction. Our results indicate ages ≤2 Myr for instantaneous bursts or ≤10 Myr for constant star formation, implying a very high ionizing photon production efficiency (log(ξion/Hz erg−1)≥25.6). From the Hα luminosity limit, we derived a conservative lower limit of fesc ≥ 86% (3σ), while an independent SED fitting favored fesc = 0.94 ± 0.06.
U37126 is extremely compact, with a delensed effective radius of reff ≃ 61 pc. The best-fit SED yields a (delensed) stellar mass of M★ ≃ 107.8 M⊙ and a star formation rate SFR ≃ 10 M⊙ yr−1. This yields very high stellar mass and star-formation-rate surface densities of log(ΣM★/M⊙ pc−2)≃3.4 and log(ΣSFR/M⊙ yr−1 kpc−2)≃2.6, respectively, which are only comparable to those found in young massive star clusters and the most extreme sources at the highest redshifts.
Together with the lack of detectable nebular emission, these properties suggest that U37126 is undergoing an ISM-free starburst phase, in which the ISM is strongly depleted and only a small fraction of ionizing photons are reprocessed by surrounding gas. These conditions may result from an extremely efficient gas-to-star conversion and/or strong feedback that has efficiently cleared the ISM from its stellar core. While our results indicate that LyC photons escape efficiently from the ISM of U37126, recent constraints on the neutral hydrogen column density from the Lyα break (log(NHI/cm−2) = 19.2 ± 1.5) indicated that substantial neutral gas may still be present along the line of sight. Therefore, while our observations favor a very high escape fraction from the galaxy itself, it remains unclear whether the escaping LyC radiation has already reached and ionized its surrounding environment on larger scales.
Although systems such as U37126 are likely rare, their extreme properties that combine a high production and escape of LyC photons suggest that they might contribute disproportionately to the ionizing photon budget during cosmic reionization. Even a small fraction of such sources (∼3–6%) can account for a substantial share (∼50–100%) of the required ionizing emissivity. This scenario is consistent with emerging JWST evidence of increasingly blue UV continua and weak nebular emission among galaxies with the highest redshifts. If confirmed in larger statistical samples, compact highly efficient LyC emitters such as U37126 may represent a key population for driving and sustaining cosmic reionization.
Acknowledgments
We thank the anonymous referee for the useful comments and suggestions. This work is based on observations made with the NASA/ESA/CSA James Webb Space Telescope. The data were obtained from the Mikulski Archive for Space Telescopes at the Space Telescope Science Institute, which is operated by the Association of Universities for Research in Astronomy, Inc., under NASA contract NAS 5-03127 for JWST. These observations are associated with program #8051. J.A.-M., C.P.-J., B.R.P. acknowledge support from grant PID2024-158856NA-I00, J.A.-M., L.C., C.P.-J., B.R.P. acknowledge support from grant PID2021-127718NB-100, P.G.P.-G. acknowledges support from grant PID2022-139567NB-I00 from the Spanish Ministry of Science and Innovation/State Agency of Research MCIN/AEI/10.13039/501100011033 and by “ERDF A way of making Europe”. J.A.-M., L.C., C.P.-J., B.R.P., P.G.P.-G. acknowledge support by grant CSIC/BILATERALES2025/BIJSP25022. M.C. acknowledges INAF GO Grant 2024 “Revealing the nature of bright galaxies at cosmic dawn with deep JWST spectroscopy”. T.H. was supported by JSPS KAKENHI 25K00020. Y.H. acknowledges support from the Japan Society for the Promotion of Science (JSPS) Grant-in-Aid for Scientific Research (24H00245), the JSPS Core-to-Core Program (JPJSCCA20210003), and the JSPS International Leading Research (22K21349). Y.F. is supported by JSPS KAKENHI Grant Numbers JP22K21349 and JP23K13149. D.L. was supported by research grants (VIL16599,VIL54489) from VILLUM FONDEN. P.S. acknowledges support from INAF RF2024 Large Grant “UNDUST: UNveiling the Dawn of the Universe with JWST” The data were obtained from the Mikulski Archive for Space Telescopes at the Space Telescope Science Institute, which is operated by the Association of Universities for Research in Astronomy, Inc., under NASA contract NAS 5-03127 for JWST; and from the European JWST archive (eJWST) operated by the ESDC. This research made use of Photutils, an Astropy package for detection and photometry of astronomical sources (Bradley et al. 2022).
References
- Algera, H. S. B., Weaver, J. R., Bakx, T. J. L. C., et al. 2025, Open J. Astrophys., submitted [arXiv:2512.14486] [Google Scholar]
- Álvarez-Márquez, J., Colina, L., Crespo Gómez, A., et al. 2024, A&A, 686, A85 [NASA ADS] [CrossRef] [EDP Sciences] [Google Scholar]
- Álvarez-Márquez, J., Crespo Gómez, A., Colina, L., et al. 2025, A&A, 695, A250 [NASA ADS] [CrossRef] [EDP Sciences] [Google Scholar]
- Álvarez-Márquez, J., Colina, L., Crespo-Gomez, A., et al. 2026, A&A, submitted [arXiv:2602.02323] [Google Scholar]
- Arrabal Haro, P., Dickinson, M., Finkelstein, S. L., et al. 2023, Nature, 622, 707 [NASA ADS] [CrossRef] [Google Scholar]
- Atek, H., Chemerynska, I., Wang, B., et al. 2023, MNRAS, 524, 5486 [NASA ADS] [CrossRef] [Google Scholar]
- Austin, D., Conselice, C. J., Adams, N. J., et al. 2025, ApJ, 995, 43 [Google Scholar]
- Baker, W. M., D’Eugenio, F., Maiolino, R., et al. 2025, A&A, 697, A90 [NASA ADS] [CrossRef] [EDP Sciences] [Google Scholar]
- Begley, R., McLure, R. J., Cullen, F., et al. 2026, MNRAS, 545, staf1995 [Google Scholar]
- Bergvall, N., Leitet, E., Zackrisson, E., & Marquart, T. 2013, A&A, 554, A38 [NASA ADS] [CrossRef] [EDP Sciences] [Google Scholar]
- Bezanson, R., Labbe, I., Whitaker, K. E., et al. 2024, ApJ, 974, 92 [NASA ADS] [CrossRef] [Google Scholar]
- Bhatawdekar, R., & Conselice, C. J. 2021, ApJ, 909, 144 [NASA ADS] [CrossRef] [Google Scholar]
- Boquien, M., Burgarella, D., Roehlly, Y., et al. 2019, A&A, 622, A103 [NASA ADS] [CrossRef] [EDP Sciences] [Google Scholar]
- Bouwens, R. J., Illingworth, G. D., Oesch, P. A., et al. 2010, ApJ, 708, L69 [CrossRef] [Google Scholar]
- Bouwens, R. J., Illingworth, G. D., Oesch, P. A., et al. 2012, ApJ, 754, 83 [Google Scholar]
- Bouwens, R. J., Illingworth, G. D., Oesch, P. A., et al. 2014, ApJ, 793, 115 [Google Scholar]
- Boyett, K., Trenti, M., Leethochawalit, N., et al. 2024, Nat. Astron., 8, 657 [CrossRef] [Google Scholar]
- Bradley, L., Sipőcz, B., Robitaille, T., et al. 2022, https://doi.org/10.5281/zenodo.6825092 [Google Scholar]
- Bruzual, G., & Charlot, S. 2003, MNRAS, 344, 1000 [NASA ADS] [CrossRef] [Google Scholar]
- Bunker, A. J., Saxena, A., Cameron, A. J., et al. 2023, A&A, 677, A88 [NASA ADS] [CrossRef] [EDP Sciences] [Google Scholar]
- Burgarella, D., Buat, V., & Iglesias-Páramo, J. 2005, MNRAS, 360, 1413 [NASA ADS] [CrossRef] [Google Scholar]
- Burgarella, D., Buat, V., Theulé, P., et al. 2025, A&A, 699, A336 [NASA ADS] [CrossRef] [EDP Sciences] [Google Scholar]
- Bushouse, H., Eisenhamer, J., Dencheva, N., et al. 2025, https://doi.org/10.5281/zenodo.17515973 [Google Scholar]
- Calabrò, A., Castellano, M., Zavala, J. A., et al. 2024, ApJ, 975, 245 [CrossRef] [Google Scholar]
- Calzetti, D., Kinney, A. L., & Storchi-Bergmann, T. 1994, ApJ, 429, 582 [Google Scholar]
- Calzetti, D., Armus, L., Bohlin, R. C., et al. 2000, ApJ, 533, 682 [NASA ADS] [CrossRef] [Google Scholar]
- Cardelli, J. A., Clayton, G. C., & Mathis, J. S. 1989, ApJ, 345, 245 [Google Scholar]
- Carniani, S., Hainline, K., D’Eugenio, F., et al. 2024, Nature, 633, 318 [CrossRef] [Google Scholar]
- Castellano, M., Fontana, A., Treu, T., et al. 2022, ApJ, 938, L15 [NASA ADS] [CrossRef] [Google Scholar]
- Castellano, M., Napolitano, L., Fontana, A., et al. 2024, ApJ, 972, 143 [Google Scholar]
- Chabrier, G. 2003, PASP, 115, 763 [Google Scholar]
- Chemerynska, I., Atek, H., Furtak, L. J., et al. 2026, MNRAS, 546, staf2267 [Google Scholar]
- Chisholm, J., Saldana-Lopez, A., Flury, S., et al. 2022, MNRAS, 517, 5104 [CrossRef] [Google Scholar]
- Choustikov, N., Katz, H., Saxena, A., et al. 2024, MNRAS, 529, 3751 [NASA ADS] [CrossRef] [Google Scholar]
- Crespo Gómez, A., Tamura, Y., Colina, L., et al. 2025, A&A, submitted [arXiv:2511.14658] [Google Scholar]
- Cullen, F., McLure, R. J., McLeod, D. J., et al. 2023, MNRAS, 520, 14 [NASA ADS] [CrossRef] [Google Scholar]
- Cullen, F., McLeod, D. J., McLure, R. J., et al. 2024, MNRAS, 531, 997 [NASA ADS] [CrossRef] [Google Scholar]
- Curtis-Lake, E., Carniani, S., Cameron, A., et al. 2023, Nat. Astron., 7, 622 [NASA ADS] [CrossRef] [Google Scholar]
- de Barros, S., Vanzella, E., Amorín, R., et al. 2016, A&A, 585, A51 [NASA ADS] [CrossRef] [EDP Sciences] [Google Scholar]
- Dekel, A., Sarkar, K. C., Birnboim, Y., Mandelker, N., & Li, Z. 2023, MNRAS, 523, 3201 [NASA ADS] [CrossRef] [Google Scholar]
- Dessauges-Zavadsky, M., Marques-Chaves, R., Schaerer, D., et al. 2025, A&A, 693, A17 [NASA ADS] [CrossRef] [EDP Sciences] [Google Scholar]
- Donnan, C. T., Dickinson, M., Taylor, A. J., et al. 2025, ApJ, 993, 224 [Google Scholar]
- Donnan, C. T., McLeod, D. J., McLure, R. J., et al. 2026, ApJ, 1002, 134 [Google Scholar]
- Dottorini, D., Calabrò, A., Pentericci, L., et al. 2025, A&A, 698, A234 [NASA ADS] [CrossRef] [EDP Sciences] [Google Scholar]
- Ferrara, A., Pallottini, A., & Dayal, P. 2023, MNRAS, 522, 3986 [NASA ADS] [CrossRef] [Google Scholar]
- Ferrara, A., Giavalisco, M., Pentericci, L., et al. 2025, Open J. Astrophys., 8, 125 [Google Scholar]
- Finkelstein, S. L., Papovich, C., Salmon, B., et al. 2012, ApJ, 756, 164 [NASA ADS] [CrossRef] [Google Scholar]
- Finkelstein, S. L., D’Aloisio, A., Paardekooper, J.-P., et al. 2019, ApJ, 879, 36 [Google Scholar]
- Fiore, F., Ferrara, A., Bischetti, M., Feruglio, C., & Travascio, A. 2023, ApJ, 943, L27 [NASA ADS] [CrossRef] [Google Scholar]
- Flury, S. R., Jaskot, A. E., Ferguson, H. C., et al. 2022, ApJ, 930, 126 [NASA ADS] [CrossRef] [Google Scholar]
- Fujimoto, S., Wang, B., Weaver, J. R., et al. 2024, ApJ, 977, 250 [NASA ADS] [CrossRef] [Google Scholar]
- Furtak, L. J., Zitrin, A., Weaver, J. R., et al. 2023, MNRAS, 523, 4568 [NASA ADS] [CrossRef] [Google Scholar]
- Giovinazzo, E., Oesch, P. A., Weibel, A., et al. 2026, A&A, 707, A352 [NASA ADS] [CrossRef] [EDP Sciences] [Google Scholar]
- Goulding, A. D., Greene, J. E., Setton, D. J., et al. 2023, ApJ, 955, L24 [NASA ADS] [CrossRef] [Google Scholar]
- Hainline, K. N., D’Eugenio, F., Jakobsen, P., et al. 2024, ApJ, 976, 160 [NASA ADS] [CrossRef] [Google Scholar]
- Harikane, Y., Ouchi, M., Oguri, M., et al. 2023, ApJS, 265, 5 [NASA ADS] [CrossRef] [Google Scholar]
- Harikane, Y., Nakajima, K., Ouchi, M., et al. 2024, ApJ, 960, 56 [NASA ADS] [CrossRef] [Google Scholar]
- Harikane, Y., Inoue, A. K., Ellis, R. S., et al. 2025, ApJ, 980, 138 [NASA ADS] [Google Scholar]
- Harikane, Y., Perez-Gonzalez, P. G., Alvarez-Marquez, J., et al. 2026, ArXiv e-prints [arXiv:2601.21833] [Google Scholar]
- Heintz, K. E., Watson, D., Brammer, G., et al. 2024, Science, 384, 890 [NASA ADS] [CrossRef] [Google Scholar]
- Helton, J. M., Morrison, J. E., Hainline, K. N., et al. 2026, ApJ, 1004, L30 [Google Scholar]
- Hsiao, T. Y.-Y., Álvarez-Márquez, J., Coe, D., et al. 2024, ApJ, 973, 81 [NASA ADS] [CrossRef] [Google Scholar]
- Inoue, A. K. 2010, MNRAS, 401, 1325 [NASA ADS] [CrossRef] [Google Scholar]
- Isobe, Y., Ouchi, M., Nakajima, K., et al. 2023, ApJ, 956, 139 [NASA ADS] [CrossRef] [Google Scholar]
- Izotov, Y. I., Schaerer, D., Thuan, T. X., et al. 2016, MNRAS, 461, 3683 [Google Scholar]
- Izotov, Y. I., Worseck, G., Schaerer, D., et al. 2018, MNRAS, 478, 4851 [Google Scholar]
- Izotov, Y. I., Schaerer, D., Worseck, G., et al. 2025, A&A, 704, A19 [NASA ADS] [CrossRef] [EDP Sciences] [Google Scholar]
- Jaskot, A. E., Silveyra, A. C., Plantinga, A., et al. 2024a, ApJ, 972, 92 [NASA ADS] [CrossRef] [Google Scholar]
- Jaskot, A. E., Silveyra, A. C., Plantinga, A., et al. 2024b, ApJ, 973, 111 [NASA ADS] [CrossRef] [Google Scholar]
- Jecmen, M. C., Chisholm, J., Atek, H., et al. 2026, ApJ, 1001, 234 [Google Scholar]
- Katz, H., Cameron, A. J., Saxena, A., et al. 2025, Open J. Astrophys., 8, 104 [Google Scholar]
- Kendrew, S., Scheithauer, S., Bouchet, P., et al. 2015, PASP, 127, 623 [NASA ADS] [CrossRef] [Google Scholar]
- Kerutt, J., Oesch, P. A., Wisotzki, L., et al. 2024, A&A, 684, A42 [NASA ADS] [CrossRef] [EDP Sciences] [Google Scholar]
- Kim, K. J., Bayliss, M. B., Rigby, J. R., et al. 2023, ApJ, 955, L17 [NASA ADS] [CrossRef] [Google Scholar]
- Komarova, L., Oey, M. S., Marques-Chaves, R., et al. 2025, ApJ, 994, 192 [Google Scholar]
- Korber, D., Schaerer, D., Marques-Chaves, R., et al. 2026, A&A, 710, L15 [NASA ADS] [CrossRef] [EDP Sciences] [Google Scholar]
- Kuruvanthodi, A., Schaerer, D., Marques-Chaves, R., et al. 2024, A&A, 691, A310 [NASA ADS] [CrossRef] [EDP Sciences] [Google Scholar]
- Leitherer, C., Schaerer, D., Goldader, J. D., et al. 1999, ApJS, 123, 3 [Google Scholar]
- Li, Z., Dekel, A., Sarkar, K. C., et al. 2024, A&A, 690, A108 [NASA ADS] [CrossRef] [EDP Sciences] [Google Scholar]
- Looser, T. J., D’Eugenio, F., Maiolino, R., et al. 2024, Nature, 629, 53 [Google Scholar]
- Luridiana, V., Morisset, C., & Shaw, R. A. 2015, A&A, 573, A42 [NASA ADS] [CrossRef] [EDP Sciences] [Google Scholar]
- Marques-Chaves, R., Schaerer, D., Álvarez-Márquez, J., et al. 2021, MNRAS, 507, 524 [NASA ADS] [CrossRef] [Google Scholar]
- Marques-Chaves, R., Schaerer, D., Álvarez-Márquez, J., et al. 2022, MNRAS, 517, 2972 [CrossRef] [Google Scholar]
- Marques-Chaves, R., Schaerer, D., Vanzella, E., et al. 2024, A&A, 691, A87 [NASA ADS] [CrossRef] [EDP Sciences] [Google Scholar]
- Marques-Chaves, R., Schaerer, D., Dessauges-Zavadsky, M., et al. 2026, A&A, 711, A112 [NASA ADS] [CrossRef] [EDP Sciences] [Google Scholar]
- Mascia, S., Pentericci, L., Calabrò, A., et al. 2023, A&A, 672, A155 [NASA ADS] [CrossRef] [EDP Sciences] [Google Scholar]
- Mascia, S., Pentericci, L., Calabrò, A., et al. 2024, A&A, 685, A3 [NASA ADS] [CrossRef] [EDP Sciences] [Google Scholar]
- Mason, C. A., Chen, Z., Stark, D. P., et al. 2026, A&A, 705, A114 [NASA ADS] [CrossRef] [EDP Sciences] [Google Scholar]
- Menon, S. H., Burkhart, B., Somerville, R. S., Thompson, T. A., & Sternberg, A. 2025, ApJ, 987, 12 [Google Scholar]
- Messa, M., Vanzella, E., Loiacono, F., et al. 2025, A&A, 694, A59 [NASA ADS] [CrossRef] [EDP Sciences] [Google Scholar]
- Morales, A. M., Finkelstein, S. L., Leung, G. C. K., et al. 2024, ApJ, 964, L24 [NASA ADS] [CrossRef] [Google Scholar]
- Morishita, T., Stiavelli, M., Chary, R.-R., et al. 2024, ApJ, 963, 9 [NASA ADS] [CrossRef] [Google Scholar]
- Naidu, R. P., Tacchella, S., Mason, C. A., et al. 2020, ApJ, 892, 109 [NASA ADS] [CrossRef] [Google Scholar]
- Naidu, R. P., Oesch, P. A., Brammer, G., et al. 2026, Open J. Astrophys., 9, 56033 [Google Scholar]
- Napolitano, L., Castellano, M., Pentericci, L., et al. 2025, A&A, 693, A50 [NASA ADS] [CrossRef] [EDP Sciences] [Google Scholar]
- Newville, M., Otten, R., Nelson, A., et al. 2025, https://doi.org/10.5281/zenodo.15014437 [Google Scholar]
- Osterbrock, D. E., & Ferland, G. J. 2006, Astrophysics of Gaseous Nebulae and Active Galactic Nuclei [Google Scholar]
- Pahl, A., Topping, M. W., Shapley, A., et al. 2025, ApJ, 981, 134 [Google Scholar]
- Papovich, C., Cole, J. W., Hu, W., et al. 2026, ApJ, 1000, 111 [Google Scholar]
- Pasha, I., & Miller, T. B. 2023, J. Open Source Softw., 8, 5703 [NASA ADS] [CrossRef] [Google Scholar]
- Pérez-González, P. G., Costantin, L., Langeroodi, D., et al. 2023, ApJ, 951, L1 [CrossRef] [Google Scholar]
- Perrin, M. D., Sivaramakrishnan, A., Lajoie, C.-P., et al. 2014, SPIE Conf. Ser., 9143, 91433X [NASA ADS] [Google Scholar]
- Planck Collaboration VI. 2020, A&A, 641, A6 [NASA ADS] [CrossRef] [EDP Sciences] [Google Scholar]
- Price, S. H., Bezanson, R., Labbe, I., et al. 2025, ApJ, 982, 51 [Google Scholar]
- Reddy, N. A., Sanders, R. L., Shapley, A. E., et al. 2023a, ApJ, 951, 56 [NASA ADS] [CrossRef] [Google Scholar]
- Reddy, N. A., Topping, M. W., Sanders, R. L., Shapley, A. E., & Brammer, G. 2023b, ApJ, 952, 167 [CrossRef] [Google Scholar]
- Rieke, G. H., Wright, G. S., Böker, T., et al. 2015, PASP, 127, 584 [NASA ADS] [CrossRef] [Google Scholar]
- Rivera-Thorsen, T. E., Dahle, H., Chisholm, J., et al. 2019, Science, 366, 738 [Google Scholar]
- Roberts-Borsani, G., Oesch, P. A., Ellis, R., et al. 2026, MNRAS, 548, stag701 [Google Scholar]
- Robertson, B. E., Furlanetto, S. R., Schneider, E., et al. 2013, ApJ, 768, 71 [Google Scholar]
- Robertson, B. E., Ellis, R. S., Furlanetto, S. R., & Dunlop, J. S. 2015, ApJ, 802, L19 [Google Scholar]
- Saxena, A., Cameron, A. J., Katz, H., et al. 2026, MNRAS, 548, stag808 [Google Scholar]
- Schaerer, D., Guibert, J., Marques-Chaves, R., & Martins, F. 2025, A&A, 693, A271 [NASA ADS] [CrossRef] [EDP Sciences] [Google Scholar]
- Sharma, M., Theuns, T., Frenk, C., et al. 2017, MNRAS, 468, 2176 [NASA ADS] [CrossRef] [Google Scholar]
- Simmonds, C., Tacchella, S., Hainline, K., et al. 2024a, MNRAS, 527, 6139 [Google Scholar]
- Simmonds, C., Verhamme, A., Inoue, A. K., et al. 2024b, MNRAS, 530, 2133 [NASA ADS] [CrossRef] [Google Scholar]
- Stanway, E. R., & Eldridge, J. J. 2018, MNRAS, 479, 75 [NASA ADS] [CrossRef] [Google Scholar]
- Steidel, C. C., Bogosavljević, M., Shapley, A. E., et al. 2018, ApJ, 869, 123 [Google Scholar]
- Stiavelli, M., Morishita, T., Chiaberge, M., et al. 2023, ApJ, 957, L18 [NASA ADS] [CrossRef] [Google Scholar]
- Suess, K. A., Weaver, J. R., Price, S. H., et al. 2024, ApJ, 976, 101 [Google Scholar]
- Tacchella, S., Eisenstein, D. J., Hainline, K., et al. 2023, ApJ, 952, 74 [NASA ADS] [CrossRef] [Google Scholar]
- Tang, M., Stark, D. P., Mason, C. A., et al. 2026, ApJ, 1001, 38 [Google Scholar]
- Topping, M. W., Stark, D. P., Endsley, R., et al. 2022, ApJ, 941, 153 [NASA ADS] [CrossRef] [Google Scholar]
- Topping, M. W., Stark, D. P., Endsley, R., et al. 2024a, MNRAS, 529, 4087 [NASA ADS] [CrossRef] [Google Scholar]
- Topping, M. W., Stark, D. P., Senchyna, P., et al. 2024b, MNRAS, 529, 3301 [NASA ADS] [CrossRef] [Google Scholar]
- Vanzella, E., de Barros, S., Vasei, K., et al. 2016, ApJ, 825, 41 [NASA ADS] [CrossRef] [Google Scholar]
- Vanzella, E., Claeyssens, A., Welch, B., et al. 2023, ApJ, 945, 53 [NASA ADS] [CrossRef] [Google Scholar]
- Weaver, J. R., Cutler, S. E., Pan, R., et al. 2024, ApJS, 270, 7 [NASA ADS] [CrossRef] [Google Scholar]
- Weibel, A., Oesch, P. A., Barrufet, L., et al. 2024, MNRAS, 533, 1808 [NASA ADS] [CrossRef] [Google Scholar]
- Wright, G. S., Wright, D., Goodson, G. B., et al. 2015, PASP, 127, 595 [NASA ADS] [CrossRef] [Google Scholar]
- Wright, G. S., Rieke, G. H., Glasse, A., et al. 2023, PASP, 135, 048003 [NASA ADS] [CrossRef] [Google Scholar]
- Yanagisawa, H., Ouchi, M., Nakajima, K., et al. 2025, ApJ, 988, 86 [Google Scholar]
- Zackrisson, E., Inoue, A. K., & Jensen, H. 2013, ApJ, 777, 39 [NASA ADS] [CrossRef] [Google Scholar]
- Zackrisson, E., Binggeli, C., Finlator, K., et al. 2017, ApJ, 836, 78 [NASA ADS] [CrossRef] [Google Scholar]
- Zavala, J. A., Castellano, M., Akins, H. B., et al. 2025, Nat. Astron., 9, 155 [Google Scholar]
The reduced NIRSpec spectrum (v4) from the Dawn JWST Archive extends up to λobs ≃ 5.5 μm, but Hβ is not detected either.
Given the widths of the NIRSpec/MSA and MIRI/LRS apertures of ≃0.2″ and 0.5″, respectively, within which no nebular emission appears detected. This corresponds to ∼0.8 kpc and ∼2.1 kpc at z = 10.25, i.e., much larger than the size of U37126 (reff ≃ 61 pc).
Appendix A: BPASS predictions for different metallicities
Figures A.1, A.2, A.3, and A.4 show the model predictions of the UV slope, EW0 (Hα) and the Balmer break strength as a function of age (top) and their combination (bottom) for stellar metallicities of Z = Z⊙, Z/Z⊙ = 50%, Z/Z⊙ = 5%, and Z/Z⊙ = 0.5%, respectively.
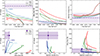 |
Fig. A.1. Same as Figure 3 but for BPASS models with stellar metallicity of Z = 0.02 (or Z/Z⊙ = 100%). |
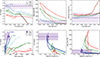 |
Fig. A.2. Same as Figure 3 but for BPASS models with stellar metallicity of Z = 0.01 (or Z/Z⊙ = 50%). |
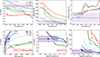 |
Fig. A.3. Same as Figure 3 but for BPASS models with stellar metallicity of Z = 0.001 (or Z/Z⊙ = 5%). |
 |
Fig. A.4. Same as Figure 3 but for BPASS models with stellar metallicity of Z = 0.0001 (or Z/Z⊙ = 0.5%). |
All Tables
Summary of the properties of U37126. Global quantities have been corrected for lensing magnification.
All Figures
|
Fig. 1. NIRSpec/PRISM (black) and MIRI/LRS (red) spectra of U37126 with the 1σ uncertainties shown in gray. The expected locations of the main rest-frame optical emission lines, Hβ, [O III] λλ4960,5008, and Hα, are indicated with dashedred lines. NIRCam photometry from broad- and medium-band filters is overplotted in blue and green, respectively. |
| In the text | |
|
Fig. 2. Comparison of the rest-frame Lyα break of U37126 (black) with that of MACS0647-JD (z = 10.170), which shows a strong damped Lyα absorption feature (NHI ≃ 2.5 × 1022 cm−2, Heintz et al. 2024). |
| In the text | |
|
Fig. 3. Predictions from BPASS synthetic stellar and nebular emission models (Z/Z⊙ ≃ 0.15, Te = 1.5 × 10⁴ K, and ne = 103 cm−3) for the UV continuum slope (βUV), EW0 (Hα), and the Balmer break strength ( |
| In the text | |
|
Fig. 4. Limits (3σ) on the Lyman continuum escape fraction derived from the upper limit on the observed (delensed) Hα luminosity as a function of stellar metallicity (from 0.5% to 100% solar) assuming a 5 Myr constant-SFH. Different symbols and colors correspond to assumed gas electron temperatures of 104 K (blue), 1.5 × 10⁴ K (orange), and 2.5 × 10⁴ K (green). |
| In the text | |
|
Fig. 5. Best-fit SED of U37126 derived with CIGALE (solid black curve) and a pure stellar 5 Myr old BPASS model (CSFH with Z/Z⊙ = 15%, dashed violet line). The NIRSpec/PRISM and MIRI/LRS spectra are shown in gray and red, respectively, and NIRCam photometric measurements and MIRI/LRS synthetic photometry are indicated by blue and red circles. The inset panel displays the posterior probability density function of the Lyman continuum escape fraction. |
| In the text | |
|
Fig. 6. NIRCam F150W (top) and F200W (bottom) 1″ × 1″ cutouts of U37126. The middle and right panels show the Sérsic best-fit models obtained with PySersic and the corresponding residuals, respectively. The PSFs are shown in the left panels. |
| In the text | |
|
Fig. 7. Effective radius (reff) as a function of star formation rate surface density (ΣSFR) for galaxies at z > 10 with MIRI constraints on EW0 (Hβ+[O III]) (color-coded, from Castellano et al. 2022; Goulding et al. 2023; Tacchella et al. 2023; Calabrò et al. 2024; Carniani et al. 2024; Álvarez-Márquez et al. 2025; Helton et al. 2026; Zavala et al. 2025; Harikane et al. 2026, and Álvarez-Márquez et al. 2026). The symbols denote individual sources, and the open symbols indicate sources without available EW0 measurements (Arrabal Haro et al. 2023; Naidu et al. 2026). U37126 (star) occupies the compact high-ΣSFR regime, but shows unusually weak nebular emission with EW0 (Hβ+[O III]) < 296 Å (3σ) compared to other compact systems (e.g., GNz11 and GHz2), consistent with a high LyC escape fraction. |
| In the text | |
|
Fig. 8. Relation between the UV slope (βUV) and the ionizing photon production efficiency (ξion) for stellar population synthesis models with (red) and without (blue) the contribution of nebular emission, i.e., representing the extreme cases of fesc = 0 and fesc = 1, respectively. The filled and open circles indicate ξion derived from the SED fitting and from the Hα flux limit assuming fesc = 0, respectively. |
| In the text | |
|
Fig. A.1. Same as Figure 3 but for BPASS models with stellar metallicity of Z = 0.02 (or Z/Z⊙ = 100%). |
| In the text | |
|
Fig. A.2. Same as Figure 3 but for BPASS models with stellar metallicity of Z = 0.01 (or Z/Z⊙ = 50%). |
| In the text | |
|
Fig. A.3. Same as Figure 3 but for BPASS models with stellar metallicity of Z = 0.001 (or Z/Z⊙ = 5%). |
| In the text | |
|
Fig. A.4. Same as Figure 3 but for BPASS models with stellar metallicity of Z = 0.0001 (or Z/Z⊙ = 0.5%). |
| In the text | |
Current usage metrics show cumulative count of Article Views (full-text article views including HTML views, PDF and ePub downloads, according to the available data) and Abstracts Views on Vision4Press platform.
Data correspond to usage on the plateform after 2015. The current usage metrics is available 48-96 hours after online publication and is updated daily on week days.
Initial download of the metrics may take a while.