


Fig. 5.
Download original image
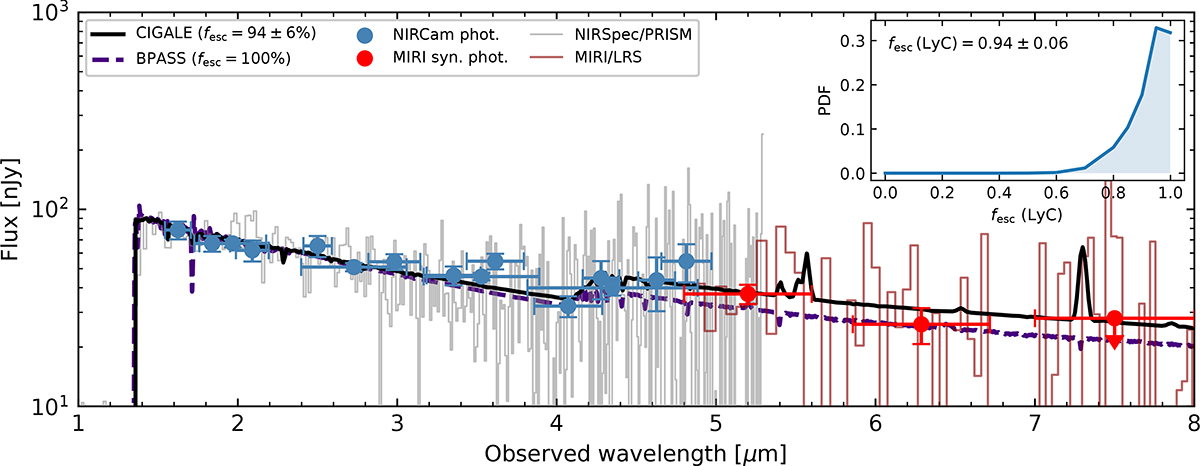
Best-fit SED of U37126 derived with CIGALE (solid black curve) and a pure stellar 5 Myr old BPASS model (CSFH with Z/Z⊙ = 15%, dashed violet line). The NIRSpec/PRISM and MIRI/LRS spectra are shown in gray and red, respectively, and NIRCam photometric measurements and MIRI/LRS synthetic photometry are indicated by blue and red circles. The inset panel displays the posterior probability density function of the Lyman continuum escape fraction.
Current usage metrics show cumulative count of Article Views (full-text article views including HTML views, PDF and ePub downloads, according to the available data) and Abstracts Views on Vision4Press platform.
Data correspond to usage on the plateform after 2015. The current usage metrics is available 48-96 hours after online publication and is updated daily on week days.
Initial download of the metrics may take a while.