


| Issue |
A&A
Volume 711, July 2026
|
|
|---|---|---|
| Article Number | A246 | |
| Number of page(s) | 15 | |
| Section | Stellar structure and evolution | |
| DOI | https://doi.org/10.1051/0004-6361/202659212 | |
| Published online | 20 July 2026 | |
Shaping the horizontal branch: The role of envelope mass in the evolution of stripped core-helium-burning stars
1
Instituto de Física y Astronomía, Universidad de Valparaíso, Av. Gran Bretaña 1111, 5030 Casilla, Valparaíaso, Chile
2
School of Physics and Astronomy, Monash University, Clayton, VIC 3800, Australia
3
Australian Research Council Centre of Excellence for Gravitational Wave Discovery, Clayton, VIC 3800, Australia
★ Corresponding authors: This email address is being protected from spambots. You need JavaScript enabled to view it.
, This email address is being protected from spambots. You need JavaScript enabled to view it.
Received:
29
January
2026
Accepted:
28
May
2026
Abstract
The location of a star along the horizontal branch (HB) during core-helium burning is primarily determined by the amount of mass lost by its progenitor. We investigate the formation and properties of stripped core-helium-burning stars, focusing on how the residual hydrogen-envelope mass (Menv) and the timing of envelope removal shape their properties. We used the MESA stellar evolution code to model stars that lose their hydrogen envelopes on the first giant branch. We explored two limiting cases for the timing of stripping, corresponding to the minimum and maximum core masses for helium ignition, for progenitors with initial masses below ∼6 M⊙ at two metallicities (Z = 0.02 and Z = 0.004), while systematically varying Menv. As expected, the effective temperature along the HB decreases as Menv increases. We determined the maximum Menv required to avoid subsequent evolution through the thermally pulsing asymptotic giant branch, which ranges from ∼0.05 M⊙ for low-mass progenitors to ∼0.30 M⊙ for intermediate-mass progenitors. In low-mass progenitors, early envelope removal triggers a late hot flash, naturally explaining the hottest blue hook stars. In intermediate-mass systems, partial envelope stripping can produce extended pre-HB configurations consistent with puffed-up stripped stars observed in binaries with Be companions. Our post-stripping evolutionary tracks are publicly available for use in binary evolution and population synthesis studies.
Key words: binaries: general / stars: evolution / stars: mass-loss / subdwarfs
© The Authors 2026
 Open Access article, published by EDP Sciences, under the terms of the Creative Commons Attribution License (https://creativecommons.org/licenses/by/4.0), which permits unrestricted use, distribution, and reproduction in any medium, provided the original work is properly cited.
This article is published in open access under the Subscribe to Open model. This email address is being protected from spambots. You need JavaScript enabled to view it. to support open access publication.
1. Introduction
The horizontal branch (HB) is a nearly horizontal sequence of stars at a similar luminosity in the Hertzsprung–Russell (HR) diagram of globular clusters, corresponding to the phase of core-helium (He) burning after the first giant branch (FGB). It spans a wide range of stellar properties, including cool red HB stars, RR Lyrae pulsators in the instability strip (e.g. Karczmarek et al. 2017), blue HB and extreme horizontal branch (EHB) stars at higher effective temperatures (e.g. Heber 2009; Brown et al. 2016), and, in some clusters, the fainter and bluer ‘blue hook’ stars (e.g. Moehler et al. 2004).
Observationally, the frequent appearance of ‘gaps’ along the HB in some globular clusters has led to the idea that distinct HB populations exist. Three main discontinuities are commonly identified (see, e.g. Brown et al. 2016, and references therein): at ∼11 500 K within the blue HB; at ∼20 000 K, separating the EHB from the blue HB; and at ∼32 000−36 000 K between the EHB and blue hook stars. These may reflect changes in stellar parameters, such as helium (He) abundance, rotation, or diffusion efficiency, associated with the multiple stellar populations (e.g. Marino et al. 2013), or physical processes affecting the hottest, most stripped HB stars (Brown et al. 2016).
Theoretically, a star’s location along the HB is primarily set by the mass of the hydrogen (H) envelope remaining after He ignition. Larger envelopes produce red HB stars, while progressively smaller envelopes yield hotter, more compact configurations, eventually reaching the EHB (e.g. Dorman et al. 1993; D’Cruz et al. 1996). In extreme cases, stars with nearly absent H envelopes can form, which are hotter, more He-rich, and less luminous than canonical EHB stars, corresponding to the blue hook population (e.g. Moehler et al. 2004).
Several channels have been proposed to explain the required mass loss. Single-star mechanisms include enhanced winds near the FGB tip (D’Cruz et al. 1996), or a delayed He-flash due to rotation-induced mixing (Sweigart 1997a). For EHB stars, however, binary interactions are likely dominant, particularly in the Galactic field (Han et al. 2002; Pelisoli et al. 2020). Binary channels include common-envelope (CE) evolution (Paczynski 1976), stable Roche-lobe overflow (RLOF), and the merger of two He white dwarfs (e.g. Zhang & Jeffery 2012; Geier et al. 2022). For blue hook stars, in particular, the small amount of residual H is thought to result from a late He-core flash, occurring along the white-dwarf cooling track. These stars are therefore also referred to as ‘late hot flashers’ (Moehler et al. 2004).
Core-He-burning stars with typical masses around half a solar mass located at the EHB, are commonly referred to as hot subdwarfs (Heber 1986; Han et al. 2002; Arancibia-Rojas et al. 2024). Observationally, they are identified and classified based on the lines visible in their spectra (e.g. Geier et al. 2017; Dawson et al. 2026). These spectral characteristics correlate with the stellar effective temperature (Teff) and surface gravity (log g), which can be inferred from model atmosphere fits. Therefore, hot subdwarfs are often discussed in the Teff − log g plane. A widely used definition is that of Heber (1987), who defined them as stars with log g > 5, further subdividing them into subdwarf B (sdB) stars (20 000 < Teff < 30 000 K) and slightly hotter subdwarf O/B (sdOB) stars (30 000 < Teff < 40 000 K). Theoretically, they correspond to core-He-burning stars with H envelopes too thin (typically ≲0.01 − 0.02 M⊙) to sustain H-shell burning (e.g. Heber 2016).
Subdwarf B and OB (sdB/sdOB) stars and EHB stars are often treated as separate populations. EHB stars correspond to stars observed at the blue end of the HB in globular clusters, while sdBs are their field counterparts (e.g. D’Cruz et al. 1996; Brown et al. 2016). The theoretical distinction, however, is less clear-cut. Further complicating the picture, some authors (e.g. Dorman et al. 1993; D’Cruz et al. 2000) define EHB stars (and their field analogues, sdBs) not only by their present-day properties, but also by their post-core-He-burning evolution. According to this definition, EHB stars are core-He-burning stars with H envelopes too thin to ascend the thermally pulsing asymptotic giant branch (TPAGB). They also refer to field sdB and sdOB stars as corresponding to the bluest EHB stars, characterised by the lowest envelope masses (Menv). Dorman et al. (1993) estimated the critical Menv to avoid the later AGB phases as approximately 0.05 M⊙.
By investigating post-EHB tracks, D’Cruz et al. (1996) showed that small differences in Menv can lead to significantly different evolutionary outcomes. For instance, HB stars with very thin envelopes (Menv ≲ 0.02 M⊙) do not develop an extended convective envelope after He exhaustion in the core, remaining hot and luminous during a short phase called AGB-manqué, where they can be observed as subdwarf O (sdO) stars Whitney et al. (1998), D’Cruz et al. (2000), after which the star moves directly to the white dwarf cooling sequence. For intermediate envelope masses (∼0.02 − 0.05 M⊙), stars partially ascend the AGB but do not reach the TPAGB phase, becoming post-early AGB stars (e.g. Brocato et al. 1990), and they may undergo a thermal pulse as they evolve towards the white dwarf cooling sequence. Finally, stars with larger H envelopes can reach the TPAGB phase.
Depending on the adopted classification criteria, whether based on observable properties, the absence of H-shell burning, or post-HB evolutionary fate, the distinction between sdB/sdOB and EHB stars remains somewhat ambiguous, because they do not uniquely specify the stellar properties. Moreover, previous studies of post-EHB evolution have primarily focused on low-mass progenitors that ignite He degenerately, as expected in old globular clusters. However, field sdB stars may arise from more massive progenitors with non-degenerate cores.
In this study, we use the Modules for Experiments in Stellar Astrophysics (MESA1) code (Paxton et al. 2011, 2013, 2015, 2018, 2019; Jermyn et al. 2023) to model stars that lose a substantial portion of their envelope on the FGB but still manage to ignite He in their cores. We explore how varying the residual Menv impacts their location in the HR and Kiel diagrams, the duration of the core-He-burning phase, the presence (or strength) of H-shell burning during this phase, and their subsequent evolution after central He exhaustion. We also aim to determine the maximum Menv that a core-He-burning star can retain while still being classified as a hot subdwarf or EHB star, according to the theoretical criteria discussed above, and whether these thresholds, established for low-mass progenitors, remain valid for more massive stars that do not develop degenerate He cores on the FGB. Finally, to evaluate how the timing of He ignition influences the residual Menv and the properties of core-He-burning stars we compute two limiting cases for envelope stripping: (i) removal when the star is at the tip of the FGB, and (ii) removal when the He-core mass reaches the minimum required for He ignition. For the FGB-tip-stripping case, we additionally explore two different metallicities to assess how composition affects these outcomes.
Given the theoretical focus of this work we adopt a consistent terminology throughout. While acknowledging the observational distinction between field sdB/sdOB stars and cluster EHB stars, our models treat them as a unified physical phenomenon: core-He-burning stars with H envelopes sufficiently thin that H-shell burning does not dominate the stellar luminosity. Therefore, for clarity and brevity, we refer to these objects collectively as ‘hot subdwarfs’, while sdB and sdOB denote stars within the corresponding Teff and log g ranges (Heber 1987), and EHB refers to the blue end of the horizontal branch.
2. MESA models
Testing the influence of the timing of envelope stripping and the residual H-envelope using the MESA binary module would require finely tuning the initial orbital parameters, which is computationally expensive. In contrast, the star module allows us to remove an arbitrary fraction of the envelope at any chosen point on the FGB using the relax_mass prescription, providing direct control over the residual Menv. This approach corresponds to a fast envelope removal method, in which the envelope is stripped as rapidly as numerically possible while maintaining convergence in MESA2.
The stellar models used in this work follow the setup of Arancibia-Rojas et al. (2024). Convection was treated with mixing-length theory (αMLT = 1.8), adopting the Schwarzschild criterion with predictive mixing, while the exponential diffusive scheme for overshooting with fov = 0.016 (Herwig 2000) was included during the main sequence. FGB mass loss was implemented using a Reimers prescription with η = 0.5.
Only two modifications with respect to the inlist presented in Arancibia-Rojas et al. (2024) were implemented. First, we activated core overshooting also during the core-He-burning phase. Our previous work (Arancibia-Rojas et al. 2024) focused on the range of sdB masses for different progenitors, without addressing the subsequent evolution after core-He exhaustion. In the present study, core overshooting during core-He burning is essential, as it affects the growth of the convective core and thus the core mass, which in turn influences the remaining envelope mass and the star’s post-HB evolutionary path. Second, unlike our previous study, where models did not reach the AGB due to the fixed Menv = 0.01 M⊙, here we also consider stars with more massive H envelopes. Therefore, we included AGB mass loss after core-He exhaustion. We adopted the prescription of Vassiliadis & Wood (1993) in order to avoid overly rapid envelope removal that would otherwise prevent the occurrence of thermal pulses. These changes allow us to follow the models after central He exhaustion and evaluate whether they reach the TPAGB.
We evolved a grid of stars with initial masses ranging from 0.8 to 6 M⊙. The lower limit roughly corresponds to the minimum mass required to evolve off the main sequence within a Hubble time for low-metallicity populations, such as those in globular clusters. The upper limit was chosen to extend into the intermediate-mass regime, where helium ignition occurs under non-degenerate conditions, allowing us to consistently explore both degenerate and non-degenerate He ignition channels within a single framework. At the same time, progenitors more massive than ∼6 M⊙ become increasingly rare due to the initial mass function, and would produce comparatively massive core-He-burning remnants with very short lifetimes in the hot subdwarf phase (see Arancibia-Rojas et al. 2024). Also, as will be shown in the next section, our models already indicate that progenitors with masses around 6 M⊙ produce core-He-burning stars with very high effective temperatures, exceeding the typical range of sdB/sdOB stars.
We first considered models in which the envelope was removed at the tip of the FGB for a fixed metallicity of Z = 0.02. We then computed a second set in which the envelope was removed earlier on the FGB, when the core mass was close to the minimum value required for He ignition after stripping, as derived in Arancibia-Rojas et al. (2024), allowing us to test how the internal structure at ignition affects the subsequent evolution. Finally, we repeated the FGB-tip-stripping models for Z = 0.004 to evaluate the role of metallicity on the location and duration of the core-He-burning phase and the subsequent evolution. These two metallicities correspond to those for which the minimum and maximum core masses required for He ignition after stripping were computed in our previous work (Arancibia-Rojas et al. 2024), to enable direct comparison with previous binary population synthesis models (Han et al. 2002). Z = 0.02 represents a typical Population I metallicity, while Z = 0.004 is commonly associated with thick-disc populations (Gilmore et al. 1989).
We systematically varied the residual Menv. For each progenitor, we began with 0.005 M⊙, followed by 0.01 M⊙, and then increased Menv in steps of 0.01 M⊙, stopping once the resulting core-He-burning models start to cluster at the red end of the HB, at effective temperatures of ∼4000 − 5000 K, where red clump stars are observed (e.g. Girardi 2016), and further increases in Menv produce only minor changes in Teff. This approach allowed us to quantify how the mass of the retained envelope governs the position on the HR diagram, the duration of core-He burning, and the post-He-burning evolution.
We identified the hot subdwarf phase in our models using two internal conditions:
-
Central He abundance 0.98 > Yc > 10−4, which is the standard MESA definition for the core-He-burning stage.
-
Nuclear energy generation dominated by He burning reactions.
These criteria isolate core-He-burning stars with H envelopes too thin to sustain significant H-shell burning, thereby excluding pre-He-ignition models and redder HB stars where H burning provides a substantial fraction of the luminosity. We note that, given the differences between theoretical and observational definitions discussed in Sect. 1, some of our models satisfy our identification criteria as hot subdwarf stars but may lie outside the canonical sdB/sdOB temperature ranges in the Teff − log g plane.
3. Results
We first analyse the results for our baseline models, with a metallicity of Z = 0.02, for which the H envelope was removed at the tip of the FGB. This allows us to isolate the impact of Menv on the subsequent evolution. Then, we explore the models where the envelope was stripped earlier on the FGB, and finally, we address the models with a lower metallicity (Z = 0.004).
3.1. Envelope removal at the tip of the FGB for Z = 0.02
Figure 1 shows the evolutionary tracks in the HR diagram for a star with an initial mass of 1.5 M⊙, stripped of its envelope at the tip of the FGB, leaving three different residual masses for the H envelope: 0.01 M⊙ (blue), 0.03 M⊙ (yellow), and 0.06 M⊙ (red). The evolution from the zero-age main sequence (ZAMS) to the tip of the FGB is shown in light grey, with the white star marking the tip of the FGB. Increasing Menv shifts the star’s location to redder colours along the HB, as also observed in post-stable mass transfer MESA models from Bobrick et al. (2024), and affects the post-core-He-burning evolution, reproducing the three distinct paths shown by Dorman et al. (1993). Models with a very thin H envelope (Menv < 0.01 − 0.02 M⊙) undergo an AGB-manqué phase for a few Myr after core-He exhaustion, driven by He-shell burning, before evolving directly onto the white dwarf cooling track. Models with only slightly more massive envelopes (Menv ∼ 0.02 − 0.05 M⊙) reach the early AGB (EAGB), where instabilities in the H- and He-burning shells cause loops in the HR diagram. The envelope is too small to ascend the TPAGB, so the star evolves onto a post-EAGB track, reaching a maximum radius of ∼55 R⊙. Finally, models with larger envelopes (Menv ≳ 0.05 M⊙) sustain stable H-shell burning, ascend the AGB, and reach the TPAGB phase, reaching, for example, a maximum radius of ∼160 R⊙ for the model with Menv = 0.06 M⊙.
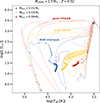 |
Fig. 1. Evolutionary tracks in the HR diagram for a 1.5 M⊙ star stripped of its envelope at the tip of the FGB (white star), with three different values for Menv: 0.01 M⊙ (blue), 0.03 M⊙ (yellow), and 0.06 M⊙ (red). The solid lines indicate the full MESA tracks, empty circles mark timesteps of 1 Myr, and filled circles mark the hot subdwarf phase (as defined in Section 2). The grey line shows the evolution from the ZAMS to the tip of the FGB. |
To better visualise the evolution of key structural and observable parameters over time, we present in Figs. 2–4 the evolution of luminosity, radius, effective temperature, and mass from the moment of envelope removal through to the white dwarf cooling track for the same three models shown in Fig. 1.
 |
Fig. 2. Evolutionary track of a star with an initial mass of 1.5 M⊙ stripped to an envelope mass of Menv = 0.01 M⊙, from envelope removal to the white dwarf cooling track. From top to bottom, the panels correspond to the evolution of: stellar luminosity (total in black, He-burning in red, and H-burning in blue); stellar radius; effective temperature; and mass (total in solid black and H-free core mass in dashed grey). The two red dashed vertical lines mark the interval corresponding to the hot subdwarf phase (as defined in Section 2). |
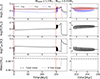 |
Fig. 3. Left: same as in Fig. 2 but for Menv = 0.03 M⊙. Right: zoomed-in view highlighting the oscillatory behaviour in luminosity caused by variations of the nuclear reaction rates in the burning shells. |
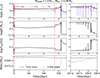 |
Fig. 4. Left: same as in Fig. 2 but for Menv = 0.06 M⊙. Right: zoomed-in view focusing on the TPAGB phase. |
Following the envelope removal, the star stripped to Menv = 0.01 M⊙ (Fig. 2) undergoes a brief initial readjustment phase (0.018 Myr) at high luminosity and large radius, where strong stellar winds remove ∼30% of the residual envelope. The star then contracts, and Teff rises, experiencing a few off-centre He flashes before it settles onto the main HB locus, where the start of the hot subdwarf phase is marked by the first vertical red dashed line. After core-He exhaustion, the star remains hot for several Myr, powered mainly by He-shell burning. Towards the end of this phase, a sharp increase in Teff is observed, associated with an intensification of H burning that consumes most of the remaining envelope, reducing the Menv to ∼5 × 10⁻⁴ M⊙. This path is consistent with a hot subdwarf that transitions through an sdO (AGB-manqué) phase before becoming a white dwarf.
As we increase the residual envelope, some models (with Menv ∼ 0.02 − 0.05 M⊙) experience a series of oscillations during the EAGB phase (Fig. 3). These are characterised by quasi-periodic variations in the energy output from both the H- and He-burning shells, accompanied by corresponding changes in the stellar radius and Teff. We examined the level of degeneracy through the star immediately before the onset of a luminosity increase and found that this behaviour is not associated with degeneracy. However, the He-burning shell at that time was confined to an extremely thin convective region (with a thickness of the order of a few centimetres). Therefore, we conclude that the star experiences thermally driven luminosity oscillations caused by marginal thin-shell instabilities, which are exacerbated by the low pressure from the overlying low-mass H envelope. After a few tens of oscillations, the star settles into a stable double-shell burning configuration and H-burning gradually becomes the main contributor to the total luminosity. The stellar radius increases and the star evolves along an AGB-like track, decreasing Teff, and transitions directly from the EAGB to the white dwarf cooling sequence without undergoing thermal pulses.
For Menv ≳ 0.05 M⊙, the H-rich envelope provides sufficient pressure to suppress the thermal oscillations on the EAGB (Fig. 4). The star proceeds smoothly to the TPAGB phase where the low envelope mass allows the changes in luminosity, radius, and Teff induced by each thermal pulse to be clearly seen, resembling the thermal pulses in canonical AGB stars with substantially reduced H envelopes (see, e.g. Fig. 4 in Iben & Renzini 1983).
The three models share the characteristic that the onset of He-burning occurs quickly after stripping at the FGB tip, preventing significant envelope loss prior to the hot subdwarf phase.
Figure 5 shows a 3 M⊙ progenitor with a non-degenerate core, left with a massive 0.31 M⊙ residual envelope, the minimum required for this star to reach the TPAGB. Following stripping, although the He core has already ignited, the star’s luminosity is dominated by H-shell burning for several tens of Myr, during which it remains in an extended configuration and does not satisfy our criteria for hot subdwarf stars (Sect. 2). Only after a substantial fraction of the H envelope is processed and incorporated into the core does He-burning become the main energy source, allowing the star to contract and enter the hot subdwarf phase. While non-degenerate progenitors, such as the the one in Fig. 5, can reach the FGB tip with a smaller core mass (∼0.4 M⊙), the large envelope in this specific case fuels a prolonged H-burning phase that significantly increases the He-core mass to nearly 0.6 M⊙, resulting in a much shorter hot subdwarf phase. It is important to note, however, that this outcome is a direct consequence of the massive envelope left on the star. This particular model was chosen to illustrate that the onset of He-burning is not sufficient to classify a stripped star as a hot subdwarf. A 3 M⊙ progenitor stripped of most of its envelope would not have experienced significant core growth and would have a longer hot subdwarf phase, consistent with the mass-lifetime relation presented in (Arancibia-Rojas et al. 2024, Fig. 10).
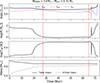 |
Fig. 5. Same as in Fig. 2, but for MZAMS = 3 M⊙ and Menv = 0.31 M⊙, which is the minimum required for this progenitor to experience a thermal pulse. |
In Fig. 6, we show the minimal required envelope mass to reach the TPAGB phase and core mass as a function of MZAMS. The top panel shows the envelope mass initially left with the relax_mass process (black circles), as well as at the beginning and end of the hot subdwarf phase (red and blue crosses, respectively). The bottom panel displays the total He core mass at the tip of the FGB (black circles), along with the enclosed mass at which the MESA degeneracy parameter η ∼ EF/kBT exceeds 4 (red squares), indicating strongly degenerate material3, where EF is the Fermi energy of free electrons, kB is the Boltzmann constant, and T is the local temperature. For progenitors with MZAMS ≲ 1.8 M⊙, the core is strongly degenerate, and Menv changes very little after stripping. For models with MZAMS of 1.9 and 2.0 M⊙, which mark the transition to non-degenerate cores, a substantial fraction of the envelope is consumed during the hot subdwarf phase, feeding the growth of the He-core. These progenitors have the lowest core masses at the FGB tip and consequently exhibit the longest hot-subdwarf lifetimes. In the intermediate-mass range (MZAMS ∼ 2.5 − 4 M⊙), the H-burning shell initially dominates, processing most of the envelope during a pre-hot subdwarf phase (from envelope stripping to the point when He-core burning becomes dominant). This is reflected in the large drop in Menv between the value imposed through relax_mass and the value at the onset of the hot subdwarf phase. The resulting core is more massive, leading to a short hot subdwarf phase, during which little additional H is consumed. Finally, for the most massive progenitors (MZAMS ≳ 4 M⊙), the He-core at the FGB tip is already very massive, leading to very brief pre-hot subdwarf and hot subdwarf phases with little change in Menv.
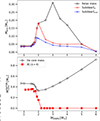 |
Fig. 6. Top panel: critical envelope mass required to reach the TPAGB phase, as a function of MZAMS. Black circles show the initial residual envelope mass set by the relax_mass process. Red plus signs and blue crosses show the envelope mass at the beginning and end of the subsequent subdwarf phase, respectively. Bottom panel: He-core mass at the tip of the FGB phase (black circles) and the enclosed mass of the strongly degenerate region (η > 4, red squares) within that core. |
Figure 7 shows the evolution of the critical models (the first that reach the TPAGB for each MZAMS) in the Menv − MHe, core plane, from the point of envelope stripping (black circles) to the beginning (red plus signs) and end (blue crosses) of the hot subdwarf phase. The two panels show starkly different evolutionary behaviours. For degenerate progenitors (left), the pre-hot subdwarf phase is very short, and Menv decreases minimally. During the hot subdwarf phase, Menv is gradually reduced by H-shell burning and stellar winds. The latter is evident as the decrease in Menv is larger than the corresponding increase in MHe, core. The reduction of Menv is larger for MZAMS = 1.8 − 2.0 M⊙, which have the lowest core masses and the longest hot-subdwarf lifetimes. Conversely, for non-degenerate progenitors (right), the pre–hot subdwarf phase, with H burning dominating the luminosity, is significantly longer. This leads to substantial core growth and envelope reduction before the hot subdwarf phase begins. This behaviour becomes less pronounced as the initial mass increases (which is clear for the 5 and 6 M⊙ models) because their more massive He cores make them evolve far more rapidly, leaving little time for additional core growth or envelope reduction. A clear trend is seen at the end of the hot subdwarf phase (blue crosses) in both panels: a more massive core requires a less massive residual H envelope to eventually ascend the AGB and trigger thermal pulses.
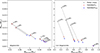 |
Fig. 7. Evolution in the Menv − MHe, core plane for the first models that reach the TPAGB phase for the different ZAMS masses (labelled at the beginning of each track). Progenitors with degenerate (left panel) and non-degenerate (right panel) ignition are shown separately. Black circles indicate Menv and MHe, core immediately after stripping, while red plus signs and blue crosses mark the beginning and end of the subdwarf phase, respectively. The lines trace the mass evolution from stripping to the end of core-He-burning. Pre-hot subdwarf evolution (before He burning becomes dominant) is connected with dashed lines, while evolution during the hot subdwarf phase is shown with solid lines. |
In Fig. 8 we provide a comprehensive overview of our entire grid of models, showing their location in the HR (top) and Kiel (bottom) diagrams exclusively during the hot subdwarf phase for different instantaneous H-envelope masses (given by the different colours). The models are separated into low-mass (MZAMS ≤ 1.9 M⊙, left panels) and intermediate-mass (MZAMS ≥ 2.0 M⊙, right panels) progenitors. For clarity, we only show two representative models for MZAMS = 0.8 − 1.6 M⊙, as their evolutionary paths are nearly identical due to their very similar core masses at the FGB tip (Fig. 6). A clear, universal trend is observed: increasing Menv systematically shifts the tracks towards lower Teff and log g, which is consistent with the simulations from Bobrick et al. (2024). The dashed box in the Kiel diagram marks the sdB/sdOB region (Heber 1987). For low-mass progenitors (up to MZAMS ∼ 2.5 M⊙), only models with the thinnest H-envelopes (Menv ≲ 0.02 M⊙) are hot enough to fall in this region. Higher-mass progenitors (∼3.0 − 4.0 M⊙) populate it more densely across a wider range of envelope masses. For the most massive progenitors (MZAMS ≳ 5.0 M⊙), models with thin envelopes become too hot and luminous, surpassing the 40 000 K upper boundary of the canonical sdOB region. Such objects are expected to be relatively rare both because massive stars are intrinsically less common and because their large He cores (MHe, core > 0.7 M⊙) burn helium so quickly that their hot-subdwarf lifetimes are extremely short.
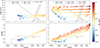 |
Fig. 8. Location of our models during the hot subdwarf phase (as defined in Sect. 2) in the HR (top) and Kiel (bottom) diagrams. Left and right panels separate low-mass progenitors (MZAMS ≤ 1.9 M⊙), with degenerate He cores, from higher-mass ones (MZAMS ≥ 2.0 M⊙), that ignite He under non-degenerate or mildly degenerate conditions. Different symbols denote different ZAMS masses. Colours indicate the instantaneous H-envelope mass on a logarithmic scale (to provide better resolution at lower masses). The solid grey line marks the ZAMS (computed with MESA), the dashed box in the Kiel diagrams outlines the canonical sdB/sdOB region (Heber 1987), and the shaded area in the HR diagrams shows the instability strip from (Karczmarek et al. 2017), where RR Lyrae–type pulsators are expected. |
The luminosity trends in Fig. 8 primarily reflect the progenitor’s core mass. Models with MZAMS ≲ 1.6 M⊙ show extremely similar behaviour. Between ∼1.6 and 2.0 M⊙, the luminosity slightly decreases with increasing MZAMS, while for higher-mass progenitors it clearly increases. This mirrors the behaviour of the He-core mass at the tip of the FGB (Fig. 6), which is nearly constant (∼0.46 − 0.47 M⊙) for MZAMS ≲ 1.6 M⊙, drops to a minimum (∼0.33 M⊙) around MZAMS = 2 M⊙, and then rises steadily for higher-mass progenitors. The MZAMS = 2.0 M⊙ model, with a mildly degenerate core, was included in the right-hand panel to better illustrate the continuous trend of increasing luminosity with core mass for stars with MZAMS ≥ 2.0 M⊙.
Finally, many models, even those with relatively thin envelopes, lie outside and to the right of the canonical sdB/sdOB box. The prevalence of observed hot subdwarfs with very thin envelopes might suggest that binary interactions forming these stars are extremely successful at removing the H-envelope. However, observational biases may also contribute: stars with more massive residual H envelopes might not exhibit the spectral features used to classify sdB/sdOB stars, making them harder to identify, even if they descend from binary interactions.
We have so far only considered stripping occurring close to the FGB tip; in reality, stripping may occur earlier. We explore the consequences of earlier removal in the next section.
3.2. Early-removal models
We now explore a scenario in which the H envelope was removed earlier, at the minimum core mass required for He ignition after stripping, as derived in Arancibia-Rojas et al. (2024)4.
We first examine the detailed evolution of a 1.5 M⊙ progenitor with Menv = 0.01 M⊙ (left panels of Figs. 9 and 10). In the HR diagram, we compare the model stripped at the FGB tip (blue) with the early-stripping counterpart (black). Following the abrupt envelope removal, the remnant undergoes an initial readjustment phase at high luminosity while maintaining a large radius (log R/R⊙ > 2). This phase is much longer (0.064 Myr vs. 0.018 Myr) and more efficient at reducing the envelope mass by wind-driven mass loss (∼65% vs. ∼30%) than the tip-removal case. The remnant then evolves at roughly constant luminosity while Teff increases to ∼100 000 K- a planetary-nebula-nucleus-like path not seen in the tip-removal case. It then contracts and cools along a white-dwarf-like track where a late He flash occurs. The star then returns to higher luminosities, experiencing a few off-centre He flashes before finally settling into a stable core-He-burning phase. The resulting hot subdwarf has an envelope an order of magnitude less massive, is significantly hotter (Teff ∼ 29 000 − 35 000 K), and slightly less luminous than its tip-stripped counterpart, i.e. more consistent with blue hook stars.
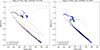 |
Fig. 9. Comparison of post-stripping evolutionary tracks in the HR diagram for MZAMS = 1.5 M⊙ (left) and MZAMS = 3.0 M⊙ (right) in the tip FGB (blue) and early (black) removal scenarios. All models shown were left with a residual envelope of 0.01 M⊙. The symbol coding is the same as in Fig. 1. |
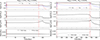 |
Fig. 10. Evolution of physical parameters after stripping in the early-removal scenario for MZAMS = 1.5 M⊙ (left) and MZAMS = 3.0 M⊙ (right) models with Menv = 0.01 M⊙. The panels show the same quantities as in Fig. 2. |
At least for progenitors with strongly degenerate cores, the early-removal scenario requires a larger initial envelope to achieve the same post-He core burning outcome as in the FGB-tip-stripping scenario. For instance, leaving post-stripping envelopes of 0.03 M⊙ or 0.06 M⊙ for the 1.5 M⊙ progenitor, which led to post-EAGB and TPAGB evolution in the FGB-tip-stripping scenario, respectively (Fig. 1), now, in both cases results in an AGB-manqué evolution. A post stripping envelope of ∼0.10 M⊙ is required to reach the EAGB, and ∼0.11 M⊙ to reach the TPAGB. The latter ensures that after the core-He-burning phase, the star retains a H envelope of ∼0.04 M⊙, similar to the critical threshold identified in the FGB-tip-stripping case (see Fig. 7).
The evolutionary path for progenitors with non-degenerate cores is markedly different, as illustrated by the 3 M⊙ progenitor with Menv = 0.01 M⊙ (right panels of Figs. 9 and 10). The star does not remain luminous while increasing Teff after stripping, as higher-mass stars are much less expanded on the FGB. For instance, at the FGB tip, the radius of a 3.0 M⊙ star is ∼45 R⊙, compared to ∼160 R⊙ for a 1.5 M⊙ star. In the early-removal case, the difference is even more dramatic (∼11 R⊙ vs. ∼145 R⊙). The readjustment phase after stripping is extremely rapid (it is not even resolved in the MESA output), and wind-driven mass loss is negligible. Instead, the remnant enters a relatively long-lived phase (∼6 Myr) of slow contraction, during which core-He burning increases smoothly5, while H-shell burning continues to dominate the luminosity, and the radius gradually decreases from ∼0.4 R⊙ to ∼0.07 R⊙. By the time He-burning becomes the dominant energy source, only a small fraction of its envelope (∼14%) has been incorporated into the core, and virtually none has been lost through winds. This behaviour of negligible wind loss, however, is specific to models with very low-mass envelopes. Increasing the post-stripping Menv yields a larger radius after stripping and more vigorous H-shell burning, which increases mass loss through both winds and core growth. The timescale for He-burning to become the dominant energy source in the early-removal case (∼6 Myr) is significantly longer than for the same initial mass in the tip-removal case (∼0.08 Myr), as a consequence of the lower He-core mass.
To generalise these findings, in Fig. 11 we show the evolution in the Menv − MHe, core plane for the critical models that reach the TPAGB in the early-removal scenario, to compare with the tip-removal case (Fig. 7). For progenitors with degenerate cores (MZAMS ≤ 2.0 M⊙, left panels), the early-removal scenario introduces a significant pre-hot subdwarf mass-loss phase not seen in the tip-removal case. The additional initial envelope mass required to reach the TPAGB is much larger for the strongly degenerate models (MZAMS ≤ 1.8 M⊙). Despite these different initial paths, the envelope masses during the hot subdwarf phase (red plus signs and blue crosses) are remarkably similar in the tip- and early-removal cases. This is expected, as the condition to reach the TPAGB primarily depends on the envelope mass remaining after the core-He-burning phase, which should be similar in both scenarios for these critical models. Also, for stars with MZAMS ≤ 2.0 M⊙, the difference between the minimum core mass required for He ignition and the maximum core mass reached at the FGB tip is only ∼0.02 M⊙ (Arancibia-Rojas et al. 2024). This small range explains why the final outcomes for the tip- and early-removal scenarios are not drastically different for a given progenitor.
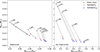 |
Fig. 11. Same as in Fig. 7, but for the critical models that reach the TPAGB in the early-removal scenario. |
For non-degenerate progenitors, on the contrary, the difference between the minimum core mass for He ignition and the core mass at the FGB tip becomes progressively larger with increasing MZAMS. In fact, for initial masses greater than ∼3 M⊙, any core mass found after the main sequence is sufficient to ignite He upon envelope removal. This means that for our early-removal models, these massive progenitors were stripped while on the subgiant branch, before even reaching the FGB. The required envelope to reach the TPAGB phase is slightly larger in the early-removal case (Fig. 11). For instance, the 3 M⊙ progenitor requires an initial envelope of 0.34 M⊙ in the early-removal scenario, compared to the 0.31 M⊙ in the FGB-tip-stripping case (see Fig. 7). The change in envelope mass during the pre-hot subdwarf phase is significant for the 3.0, 3.5, and 4.0 M⊙ models, but diminishes for the 5.0 M⊙ model and becomes almost negligible for the 6.0 M⊙ progenitor. These two most massive progenitors already have very massive cores at the terminal-age main sequence, more massive than canonical hot subdwarfs (> 0.5 M⊙), and therefore evolve extremely rapidly through both the pre-hot subdwarf and hot subdwarf phases, which explains the limited consumption of the envelope. The final core masses in the early-removal scenario are systematically shifted to lower values compared to the tip-removal models, but still follow a clear linear relation between the final envelope mass and the core mass required to reach the TPAGB.
The distribution of the early-removal models in the HR and Kiel diagrams is shown in Fig. A.1 of the Appendix. For degenerate progenitors (left panels), this channel produces hotter, more compact hot subdwarfs that are slightly less luminous than the corresponding tip-removal models. The key difference is that the extended pre-ignition evolution and the late hot flash in the early-removal scenario consume a much larger fraction of the envelope, even though the initial envelope masses match those in Fig. 8. Consequently, the whole population shifts towards higher temperatures and surface gravities, placing a larger fraction of models within the canonical sdB/sdOB region. For higher-mass progenitors with non-degenerate cores (right-hand panels), the early-removal tracks cluster systematically at higher Teff and some models reach the hot subdwarf phase with thinner H envelopes. This occurs because the pre–hot subdwarf evolution, dominated by H-shell burning, is substantially longer, leading to more extensive envelope consumption despite the absence of a late hot flash. For the more massive progenitors, models with relatively large envelope masses (Menv ∼ 0.4 − 0.5 M⊙) remain relatively hot, i.e. do not undergo substantial radial expansion. As a result, the distribution becomes more compressed, with many models clustering below the ZAMS and a reduced spread in Teff, compared to the FGB-tip-removal case. This behaviour likely reflects the larger He-core masses in these models (> 0.6 M⊙), which result in a deeper gravitational potential and more tightly bound envelopes, inhibiting strong expansion.
3.3. Lower metallicity models
Finally, we repeated our grid of models with envelope removal at the tip of the FGB, but for a lower metallicity (Z = 0.004). Figure A.2 of the Appendix shows the location of these low-metallicity models in the HR and Kiel diagrams. The overall behaviour is similar to the Z = 0.02 case, but with systematic shifts. Firstly, for a given progenitor and envelope mass, the low-metallicity stars are slightly hotter (bluer) and have slightly higher surface gravities. Their luminosities, however, remain very similar, as the increase in Teff is compensated by the smaller radius. Secondly, even for envelope masses up to 0.5 M⊙, the vast majority of models remain on the blue side of the RR Lyrae instability strip, firmly in the blue HB region.
These trends can be understood by examining the core and envelope structure, as shown in Fig. 12. At the tip of the FGB, the He-core mass (bottom panel) is similar but slightly larger at lower metallicity (except for the range MZAMS ∼ 1.7 − 2.0 M⊙). The lower opacity of the metal-poor envelope allows energy to escape more efficiently, leading to a more compact stellar configuration for a given mass. Consequently, stars with lower metallicity reach higher Teff and log g during the core-He-burning phase, an effect that is particularly noticeable in cases where He ignition occurs under degenerate conditions. Regarding the maximum envelope mass required to reach the TPAGB phase (top panel of Fig. 12), the resulting trends are very similar for both metallicities. The differences are typically about 0.01 M⊙, which is consistent with the small differences in the core masses at the FGB tip.
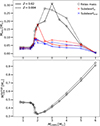 |
Fig. 12. Same as in Fig. 6 but comparing for models with two different metallicities: Z = 0.02 (solid lines) and Z = 0.004 (dashed lines). The enclosed mass of the strongly degenerate region is not shown in this case. |
4. Discussion and further implications
The results presented in this work provide a quantitative link between the residual H envelope mass (Menv) and the evolutionary fate of core-He-burning stars, particularly their location on the HB and their subsequent evolution.
The evolutionary outcomes of such core-He-burning stars can explain a variety of observed peculiar objects, including anomalously massive MS stars, peculiar red giants, and AGB-manqué stars, among others.
4.1. Revisiting the continuity of the horizontal branch
In agreement with Bobrick et al. (2024), our models show that the location of core He-burning stars in the HR diagram depends sensitively on the residual envelope mass, with Teff and log g inversely correlated with Menv. In our calculations, Menv is treated as a free parameter and sampled over a wide range, without imposing constraints from specific evolutionary channels. Under the assumption that different evolutionary pathways (e.g. varying mass-loss efficiencies through winds or binary interactions) could produce a broad and effectively continuous distribution of residual H-envelope masses, the HB would appear as a continuous sequence in the HR diagram. However, whether such a distribution is realised in nature remains uncertain, and our results do not, by themselves, predict the presence or absence of the gaps commonly observed along the HB (e.g. Brown et al. 2016). These gaps may instead reflect additional physical processes (e.g. diffusion efficiency, rotation, or He enrichment) associated with multiple stellar populations (e.g. Marino et al. 2013).
An interesting result of our models is that core He-burning stars with Menv ∼ 0.01 − 0.02 M⊙ naturally populate the region between 10 000 and 20 000 K. This overlaps in Teff with the population of more than two thousand cool H-dominated subdwarf stars identified by Kepler et al. (2016) in the Sloan Digital Sky Survey (Data Release 12), labelled as ‘sdA’ stars with Teff ≲ 20 000 K and log g ≳ 5.5. Subsequent spectroscopic re-analyses including metals (Pelisoli et al. 2018) lowered this limit to log g > 5. Pelisoli et al. (2018) argued that the sdA class is likely a mixture of metal-poor A/F dwarfs, blue stragglers, extremely low-mass (ELM) and pre-ELM white dwarfs. Our results suggest that the cooler, thicker-envelope counterparts of sdB stars, if they exist, represent a natural extension of the EHB towards lower temperatures, but are unlikely to account for the bulk of the observed sdA population with higher surface gravities, though some could be photometrically mixed within the sdA sample and potentially distinguished through surface-gravity measurements.
4.2. Binarity as a function of HB location
The observed binary fraction along the HB shows a striking gradient that provides an important empirical constraint on the role of binary interactions in envelope removal.
EHB stars: It is now widely accepted that field sdB/sdOB stars are predominantly formed through binary interaction channels (Han et al. 2002; Chen et al. 2013; Vos et al. 2019). Radial-velocity surveys primarily probe the short-period post-CE population, yielding an intrinsic close-binary fraction of up to ∼70% in early studies (Maxted et al. 2001), and ∼45 − 55% in more recent analyses (Napiwotzki et al. 2004; Copperwheat et al. 2011; Geier et al. 2022). These systems typically have orbital periods ranging from hours to a few days, in good agreement with predictions from binary population synthesis models for the CE ejection channel. In addition, a population of long-period sdB+MS binaries with orbital periods of hundreds to thousands of days, typically identified through composite spectra, has been firmly established in recent years (e.g. Vos et al. 2019), consistent with formation through stable RLOF. While these systems are largely invisible to radial-velocity surveys targeting short periods, their existence implies that the total binary fraction among field sdB stars is higher than the close post-CE binary fraction alone. However, the much lower binary fraction observed for their EHB counterparts in globular clusters suggests that additional formation channels may operate in dense stellar environments (e.g. Latour et al. 2018). Overall, the observational evidence supports the view that the extreme envelope stripping required to form the hottest core-He-burning stars (Menv ≲ 0.02 M⊙) is achieved through multiple binary interaction channels operating over a wide range of orbital separations, at least for the field population.
Blue HB stars: Observational constraints on the binary fraction of blue HB (BHB) stars remain uncertain. Guo et al. (2025) report a binary fraction of 32 ± 3%, decreasing to 29 ± 3% for metal-poor (halo) stars and increasing to 51 ± 11% for metal-rich (disc) stars. The metallicity dependence suggests two coexisting formation channels: single-star evolution dominated by wind mass loss in low-metallicity populations, and binary interactions in more metal-rich ones. Moreover, hotter blue HB stars (closer to the EHB) show a significantly higher binary fraction (45 ± 6%) than their cooler counterparts (closer to the RR Lyrae stars instability strip, 23 ± 5%). In contrast, Culpan et al. (2025) report a very low binary fraction (< 2.2%) for BHB stars in the inner Galactic halo, significantly lower than both the values reported by Guo et al. (2025) and the binary fractions observed in main-sequence and red giant progenitors. They argue that previous estimates might have been affected by contamination and suggest that either single-star channels dominate BHB formation or that binary companions do not survive the BHB formation process, at least in the predominantly low-metallicity halo populations probed by this study. If confirmed, such a low binary fraction would imply a much more abrupt transition in binarity along the HB, with BHB stars being largely single. On the other hand, higher binary fractions as reported by Guo et al. (2025) would support a more gradual transition with envelope mass.
RR Lyrae: These stars correspond to HB objects retaining relatively more massive H envelopes (Menv ≳ 0.05 M⊙) and occupying the instability strip. Observationally, only a small number of binary candidates have been identified, predominantly in systems with orbital periods P ≳ 1000 days based on light-travel-time effect studies (Hajdu et al. 2015, 2021), while dedicated radial-velocity surveys have not confirmed post-interaction systems (Barnes et al. 2021; Poretti et al. 2025). Although RR Lyrae stars have traditionally been associated with single-stellar evolution in old, metal-poor populations, recent binary evolution models show that they can also form through partial envelope stripping during the FGB phase in interacting binaries (Bobrick et al. 2024). In this framework, RR Lyrae may be truly single, single-made binaries (with wide companions that do not affect their evolution), or binary-made RR Lyrae formed via mass transfer, with the latter predicted to preferentially trace metal-rich and relatively young populations in the Galactic disc. From an evolutionary perspective, RR Lyrae stars probe the regime of modest envelope stripping on the HB, representing an intermediate outcome between classical HB stars and more strongly stripped objects such as hot subdwarfs.
Taken together, these observational constraints may suggest a general trend along the HB, in which decreasing envelope mass is accompanied by an increasing importance of binary interactions. However, the behaviour of BHB stars remains uncertain, with some studies supporting a gradual increase in binary fraction towards lower envelope masses, while others point to a much lower binary fraction, implying a more abrupt transition. This highlights the need for caution when linking envelope mass and binarity, and suggests that multiple formation channels, possibly depending on environment and stellar population, may coexist across the HB.
4.3. Binary evolution channels
The evolutionary channel through which a stripped core-He-burning star forms has direct consequences for both its orbital configuration and its internal structure, in particular for the mass of the residual H envelope. The physical nature of the binary interaction – either a dynamically unstable CE phase or stable RLOF – determines how efficiently the envelope is stripped and how the orbit responds.
CE Evolution: hot subdwarfs stars in short period binaries (P ≲ 2 d), are predominantly formed through CE evolution, as such compact orbits naturally result from the dramatic orbital shrinkage during the CE phase. The CE efficiency is governed by the energy balance equation, where the orbital energy released by the inspiral must overcome the envelope’s binding energy (e.g. Paczynski 1976). The precise amount of H retained after CE ejection remains uncertain, as detailed calculations show that it depends sensitively on the adopted definition of the bifurcation point separating the ejected envelope from the core (Ivanova et al. 2013). Nevertheless, CE evolution is expected to impose a much tighter upper limit on the residual envelope mass than stable RLOF, with models consistently predicting very low H envelope masses in systems that successfully emerge from the CE phase (see, e.g. Althaus et al. 2026). In addition, the short orbital periods of post-CE systems imply compact separations that do not allow the long-term survival of extended H envelopes around the stripped star, which must remain confined within its Roche lobe (Xiong et al. 2017). If too much H remains, nuclear-driven expansion would trigger renewed mass loss, further reducing the envelope mass. As a result, CE remnants are expected to retain only very thin H envelopes, with typical masses ≲10−2 M⊙.
Stable RLOF: For hot subdwarfs in wider binaries, stable RLOF is the dominant channel, typically producing systems with orbital periods of ∼500 − 1500 days (Vos et al. 2020) with relatively massive companions (A to early K types), as required for mass transfer from a giant donor to remain stable. The ability of stable RLOF to produce hot subdwarfs stars is primarily regulated by the evolutionary stage of the donor at the onset of mass transfer. Given the relatively long duration of a stable mass transfer phase compared to a CE phase, if stable mass transfer is initiated sufficiently close to the tip of the FGB, He ignition can cause the contraction of the donor, naturally terminating mass transfer while the envelope is only partially stripped (Bobrick et al. 2024). Therefore, stable RLOF can produce a much broader range of envelope masses than CE evolution. Our models with intermediate envelope masses could therefore represent the outcome of prematurely detached RLOF during stable mass transfer.
4.4. Late hot flash and chemical signatures in the early-removal scenario
Our early-removal models for low-mass progenitors (MZAMS ≲ 2.0 M⊙, Sect. 3.2) show that a late He flash occurs after envelope removal, along the white-dwarf cooling track. As predicted by previous studies (e.g. D’Cruz et al. 1996; Sweigart 1997b; Sweigart et al. 2002; Cassisi et al. 2003), this event leads to the rapid consumption of a significant fraction of the residual H envelope. This naturally yields hotter, more compact hot subdwarfs stars and provides a compelling explanation for the blue hook population, which is difficult to reproduce with standard FGB-tip-removal models (e.g. D’Cruz et al. 1996; Whitney et al. 1998; Moehler et al. 2002, 2004; Brown et al. 2010).
The flash-induced convection also dredges up core-processed material, potentially offering a natural origin for sdB stars with anomalous heavy-metal surface abundances (Battich et al. 2023), despite their high surface gravities.
For higher-mass progenitors, He ignites smoothly even after very early stripping, implying that blue-hook stars should not arise from progenitors with MZAMS ≳ 2.0 M⊙.
4.5. Puffed-up stripped stars
Stripped He stars are expected to undergo rapid thermal contraction immediately after envelope removal. However, recent observations reveal ‘puffed-up’ stripped He stars (e.g. El-Badry & Quataert 2021; Villaseñor et al. 2023; Dutta & Klencki 2024; Picco et al. 2026), which are significantly larger and cooler than typical hot subdwarfs and overlap with the post-AGB and B-type main-sequence regions. These stars are found in binaries with more massive B- or Be-type companions, indicating that they are most likely products of stable RLOF rather than CE ejection. Their observed properties (low surface gravity and relatively low masses) suggest that they are recently stripped remnants still contracting towards the hot subdwarf phase.
Our models with larger H-envelope mass (Menv ∼ 0.05 − 0.30 M⊙) provide a theoretical link to this observed population. Such stars can remain inflated for several Myr before contracting towards the hot subdwarf region, with the duration of both phases increasing with Menv. For example, the 3.0 M⊙ model with a 0.31 M⊙ envelope (Fig. 5), remains large and cool for roughly 20 Myr, then contracts slowly for a few Myr before reaching the hot subdwarf locus.
The observations of these inflated remnants support a picture of varying mass-loss efficiencies across binaries: highly efficient channels (e.g. CE) produce hot subdwarfs stars quickly, whereas less efficient or prematurely detached RLOF in more massive binaries can yield extended, puffed-up remnants over longer timescales. These objects may therefore represent either newly partially stripped stars still contracting towards the HB phase, or the evolved descendant (post-HB) of partially stripped stars. Both interpretations are consistent with their observed presence of B/Be-type companions, which likely accreted mass and angular momentum during the interaction.
5. Summary
We have explored the evolution of stripped core-He-burning stars with varying residual H-envelope masses using MESA, comparing the FGB-tip-stripping and an early-removal scenario across a range of progenitor masses and two metallicities. Our main conclusions, which provide a unified framework for understanding HB morphology and hot-subdwarf formation, are as follows:
-
The position of a core-He-burning star on the HB is primarily determined by the mass of its residual H envelope. Stars with Menv ≲ 0.01 − 0.02 M⊙ become hot subdwarfs (sdB or sdOB) located on the EHB, while increasing envelope mass shifts them to cooler Teff. This relation, previously identified in detailed binary evolution models for post-stable RLOF (Bobrick et al. 2024), is also relevant for post-CE binaries and provides a direct theoretical link between the stripping efficiency and the observed HB properties.
-
We determined the maximum envelope mass that can be retained after stripping to avoid reaching the TPAGB phase after core-He exhaustion. For low-mass stars (MZAMS ≲ 1.7 M⊙), this limit matches previous estimates of ∼0.05 M⊙, rising up to ∼0.3 M⊙ for MZAMS ∼ 3.0 M⊙, and decreasing again at higher masses. For non-degenerate progenitors, however, most of the H envelope is burned and converted to He before settling on the HB. The allowed envelope mass is not substantially affected by metallicity, and is slightly larger for the early-removal scenario.
-
The early-removal scenario in low-mass progenitors (MZAMS ≲ 2.0 M⊙) triggers a late hot flash that consumes nearly all remaining H, naturally producing the hottest, most compact remnants and accounting for the blue-hook population and associated abundance anomalies observed in some sdB stars. More massive progenitors ignite He non-degenerately and are therefore not expected to form blue-hook stars.
-
Observationally, the apparent increase of the close-binary fraction towards the EHB in the field is consistent with the idea that CE interactions play an important role in forming the bluest hot subdwarf stars (sdB/sdOB), which require extremely thin H envelopes. However, the binary fraction may vary in dense or low-metallicity environments, and alternative formation channels could contribute.
-
The existence of puffed-up stripped stars with massive (often Be-type) companions indicates that binary mass loss can also leave substantial envelopes. These systems likely result from less efficient or prematurely detached RLOF in more massive binaries. Our models show that retaining a larger envelope keeps the remnant inflated and cool for several Myr, matching the observed prolonged inflated state of puffed-up stripped stars.
These results highlight the decisive role of envelope mass in shaping HB morphology and the evolution of stripped stars.
Data availability
The MESA evolutionary tracks and inlist files are available at https://doi.org/10.5281/zenodo.19380267
Acknowledgments
EAR, MZ, MV and ADR acknowledge support from FONDECYT (grant 1250525). EAR and ADR also acknowledge support from ANID-Subdirección de Capital Humano/Doctorado Nacional/2025 (Grants 21250458 and 21250519). AB acknowledges support from the Australian Research Council (ARC) Centre of Excellence for Gravitational Wave Discovery (OzGrav), through project number CE230100016.
References
- Althaus, L. G., Córsico, A. H., Zorotovic, M., et al. 2026, A&A, 708, A155 [NASA ADS] [CrossRef] [EDP Sciences] [Google Scholar]
- Arancibia-Rojas, E., Zorotovic, M., Vučković, M., et al. 2024, MNRAS, 527, 11184 [Google Scholar]
- Barnes, T. G., III, Guggenberger, E., & Kolenberg, K. 2021, AJ, 162, 117 [Google Scholar]
- Battich, T., Miller Bertolami, M. M., Serenelli, A. M., Justham, S., & Weiss, A. 2023, A&A, 680, L13 [NASA ADS] [CrossRef] [EDP Sciences] [Google Scholar]
- Bobrick, A., Iorio, G., Belokurov, V., et al. 2024, MNRAS, 527, 12196 [Google Scholar]
- Brocato, E., Matteucci, F., Mazzitelli, I., & Tornambe, A. 1990, ApJ, 349, 458 [Google Scholar]
- Brown, T. M., Sweigart, A. V., Lanz, T., et al. 2010, ApJ, 718, 1332 [NASA ADS] [CrossRef] [Google Scholar]
- Brown, T. M., Cassisi, S., D’Antona, F., et al. 2016, ApJ, 822, 44 [NASA ADS] [CrossRef] [Google Scholar]
- Cassisi, S., Schlattl, H., Salaris, M., & Weiss, A. 2003, ApJ, 582, L43 [NASA ADS] [CrossRef] [Google Scholar]
- Chen, X., Han, Z., Deca, J., & Podsiadlowski, P. 2013, MNRAS, 434, 186 [Google Scholar]
- Copperwheat, C. M., Morales-Rueda, L., Marsh, T. R., Maxted, P. F. L., & Heber, U. 2011, MNRAS, 415, 1381 [Google Scholar]
- Culpan, R., Dorsch, M., Pelisoli, I., et al. 2025, A&A, 704, A326 [NASA ADS] [CrossRef] [EDP Sciences] [Google Scholar]
- Dawson, H., Dorsch, M., Geier, S., et al. 2026, A&A, 707, A6 [NASA ADS] [CrossRef] [EDP Sciences] [Google Scholar]
- D’Cruz, N. L., Dorman, B., Rood, R. T., & O’Connell, R. W. 1996, ApJ, 466, 359 [CrossRef] [Google Scholar]
- D’Cruz, N. L., O’Connell, R. W., Rood, R. T., et al. 2000, ApJ, 530, 352 [CrossRef] [Google Scholar]
- Dorman, B., Rood, R. T., & O’Connell, R. W. 1993, ApJ, 419, 596 [NASA ADS] [CrossRef] [Google Scholar]
- Dutta, D., & Klencki, J. 2024, A&A, 687, A215 [NASA ADS] [CrossRef] [EDP Sciences] [Google Scholar]
- El-Badry, K., & Quataert, E. 2021, MNRAS, 502, 3436 [NASA ADS] [CrossRef] [Google Scholar]
- Geier, S., Østensen, R. H., Nemeth, P., et al. 2017, A&A, 600, A50 [NASA ADS] [CrossRef] [EDP Sciences] [Google Scholar]
- Geier, S., Dorsch, M., Pelisoli, I., et al. 2022, A&A, 661, A113 [NASA ADS] [CrossRef] [EDP Sciences] [Google Scholar]
- Gilmore, G., Wyse, R. F. G., & Kuijken, K. 1989, ARA&A, 27, 555 [NASA ADS] [CrossRef] [Google Scholar]
- Girardi, L. 2016, ARA&A, 54, 95 [Google Scholar]
- Guo, Y., Chen, K., Li, Z., et al. 2025, A&A, 702, A11 [NASA ADS] [CrossRef] [EDP Sciences] [Google Scholar]
- Hajdu, G., Catelan, M., Jurcsik, J., et al. 2015, MNRAS, 449, L113 [NASA ADS] [CrossRef] [Google Scholar]
- Hajdu, G., Pietrzyński, G., Jurcsik, J., et al. 2021, ApJ, 915, 50 [NASA ADS] [CrossRef] [Google Scholar]
- Han, Z., Podsiadlowski, P., Maxted, P. F. L., Marsh, T. R., & Ivanova, N. 2002, MNRAS, 336, 449 [Google Scholar]
- Heber, U. 1986, A&A, 155, 33 [NASA ADS] [Google Scholar]
- Heber, U. 1987, in IAU Colloq. 95: Second Conference on Faint Blue Stars, eds. A. G. D. Philip, D. S. Hayes, & J. W. Liebert, 79 [Google Scholar]
- Heber, U. 2009, ARA&A, 47, 211 [Google Scholar]
- Heber, U. 2016, PASP, 128, 082001 [Google Scholar]
- Herwig, F. 2000, A&A, 360, 952 [NASA ADS] [Google Scholar]
- Iben, I., & Renzini, A. 1983, ARA&A, 21, 271 [NASA ADS] [CrossRef] [Google Scholar]
- Ivanova, N., Justham, S., Chen, X., et al. 2013, A&ARv, 21, 59 [Google Scholar]
- Jermyn, A. S., Bauer, E. B., Schwab, J., et al. 2023, ApJS, 265, 15 [NASA ADS] [CrossRef] [Google Scholar]
- Karczmarek, P., Wiktorowicz, G., Iłkiewicz, K., et al. 2017, MNRAS, 466, 2842 [CrossRef] [Google Scholar]
- Kepler, S. O., Pelisoli, I., Koester, D., et al. 2016, MNRAS, 455, 3413 [NASA ADS] [CrossRef] [Google Scholar]
- Latour, M., Randall, S. K., Calamida, A., Geier, S., & Moehler, S. 2018, A&A, 618, A15 [NASA ADS] [CrossRef] [EDP Sciences] [Google Scholar]
- Marino, A. F., Milone, A. P., & Lind, K. 2013, ApJ, 768, 27 [Google Scholar]
- Maxted, P. F. L., Heber, U., Marsh, T. R., & North, R. C. 2001, MNRAS, 326, 1391 [CrossRef] [Google Scholar]
- Moehler, S., Sweigart, A. V., Landsman, W. B., & Dreizler, S. 2002, A&A, 395, 37 [NASA ADS] [CrossRef] [EDP Sciences] [Google Scholar]
- Moehler, S., Sweigart, A. V., Landsman, W. B., Hammer, N. J., & Dreizler, S. 2004, A&A, 415, 313 [NASA ADS] [CrossRef] [EDP Sciences] [Google Scholar]
- Napiwotzki, R., Karl, C. A., Lisker, T., et al. 2004, Ap&SS, 291, 321 [NASA ADS] [CrossRef] [Google Scholar]
- Paczynski, B. 1976, IAU Symp., 73, 75 [NASA ADS] [Google Scholar]
- Paxton, B., Bildsten, L., Dotter, A., et al. 2011, ApJS, 192, 3 [Google Scholar]
- Paxton, B., Cantiello, M., Arras, P., et al. 2013, ApJS, 208, 4 [Google Scholar]
- Paxton, B., Marchant, P., Schwab, J., et al. 2015, ApJS, 220, 15 [Google Scholar]
- Paxton, B., Schwab, J., Bauer, E. B., et al. 2018, ApJS, 234, 34 [NASA ADS] [CrossRef] [Google Scholar]
- Paxton, B., Smolec, R., Schwab, J., et al. 2019, ApJS, 243, 10 [Google Scholar]
- Pelisoli, I., Kepler, S. O., & Koester, D. 2018, MNRAS, 475, 2480 [NASA ADS] [CrossRef] [Google Scholar]
- Pelisoli, I., Vos, J., Geier, S., Schaffenroth, V., & Baran, A. S. 2020, A&A, 642, A180 [NASA ADS] [CrossRef] [EDP Sciences] [Google Scholar]
- Picco, A., Marchant, P., Sana, H., et al. 2026, A&A, 705, A225 [NASA ADS] [CrossRef] [EDP Sciences] [Google Scholar]
- Poretti, E., Le Borgne, J. F., Correa, M., et al. 2025, A&A, 703, A286 [NASA ADS] [CrossRef] [EDP Sciences] [Google Scholar]
- Sweigart, A. V. 1997a, ApJ, 474, L23 [NASA ADS] [CrossRef] [Google Scholar]
- Sweigart, A. V. 1997b, in The Third Conference on Faint Blue Stars, eds. A. G. D. Philip, J. Liebert, R. Saffer, & D. S. Hayes, 3 [Google Scholar]
- Sweigart, A. V., Brown, T. M., Lanz, T., Landsman, W. B., & Hubeny, I. 2002, ASP Conf. Ser., 265, 261 [Google Scholar]
- Vassiliadis, E., & Wood, P. R. 1993, ApJ, 413, 641 [Google Scholar]
- Villaseñor, J. I., Lennon, D. J., Picco, A., et al. 2023, MNRAS, 525, 5121 [CrossRef] [Google Scholar]
- Vos, J., Vučković, M., Chen, X., et al. 2019, MNRAS, 482, 4592 [NASA ADS] [CrossRef] [Google Scholar]
- Vos, J., Bobrick, A., & Vučković, M. 2020, A&A, 641, A163 [NASA ADS] [CrossRef] [EDP Sciences] [Google Scholar]
- Whitney, J. H., Rood, R. T., O’Connell, R. W., et al. 1998, ApJ, 495, 284 [Google Scholar]
- Xiong, H., Chen, X., Podsiadlowski, P., Li, Y., & Han, Z. 2017, A&A, 599, A54 [NASA ADS] [CrossRef] [EDP Sciences] [Google Scholar]
- Zhang, X., & Jeffery, C. S. 2012, MNRAS, 419, 452 [NASA ADS] [CrossRef] [Google Scholar]
Version-r15140.
Although this approach may qualitatively resemble a CE phase in terms of timescale, it is not intended to represent the CE channel only, because CE ejection is expected to produce only small residual H-envelope masses, as discussed in detail in Sect. 4.3.
For η = 4 the electron degeneracy pressure is roughly twice that of an ideal electron gas.
Strictly, the minimum core mass in Arancibia-Rojas et al. (2024) was derived for Menv = 0.01 M⊙. A larger residual envelope might allow for He ignition with a slightly less massive core.
The three loops visible for the tip-removal model in Fig. 9 are He-shell flashes occurring after the core-He-burning phase, which disappear if the Menv is increased. A detailed discussion is beyond the scope of this paper.
Appendix A: Supplementary figures
Here we present HR and Kiel diagrams illustrating the location of stripped stars during the hot subdwarf phase (as defined in Sect. 2) for the early-envelope-removal models (Fig. A.1) and for the lower metallicity models (Z = 0.004, Fig. A.2). The figures follow the same layout, symbols, and colour coding as Fig. 8, allowing for a direct comparison with the reference models computed for envelope removal at the FGB tip and Z = 0.02.
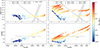 |
Fig. A.1. Same as in Fig. 8 for the early-removal scenario. The same range of H envelope masses during the hot subdwarf phase was intentionally used to allow a direct comparison of the evolutionary tracks with those from the tip-removal scenario. |
Appendix B: Tables
Here we present supplementary tables summarising a selected subset of stellar-evolution parameters of interest for the models discussed in this work. These quantities are intended to be useful for binary population and related evolutionary studies, while the complete evolutionary tracks, including the full MESA output for each model, are publicly available on Zenodo. Columns (1) and (2) list the input parameters, namely the zero-age main sequence (ZAMS) mass and the envelope mass remaining immediately after the relax_mass procedure, respectively. Columns (3) and (4) give the core and envelope masses at the beginning of the hot subdwarf phase, while Columns (5) and (6) report the corresponding values at core-He exhaustion. Column (7) lists the maximum stellar radius reached after core-He burning, while Column (8) indicates the evolutionary phase at which this maximum radius is attained.
Tables B.1 and B.3 present models in which the envelope was removed at the FGB tip for metallicities Z = 0.02 and Z = 0.004, respectively, while Table B.2 lists the corresponding early-removal model with Z = 0.02.
Stellar evolution parameters of interest for models with Z = 0.02 and envelope removal at the FGB tip.
Same as in Table B.1 but for the early removal models
Same as in Table B.1 but for Z = 0.004
The full version of these tables is available at https://doi.org/10.5281/zenodo.19380267
All Tables
Stellar evolution parameters of interest for models with Z = 0.02 and envelope removal at the FGB tip.
All Figures
|
Fig. 1. Evolutionary tracks in the HR diagram for a 1.5 M⊙ star stripped of its envelope at the tip of the FGB (white star), with three different values for Menv: 0.01 M⊙ (blue), 0.03 M⊙ (yellow), and 0.06 M⊙ (red). The solid lines indicate the full MESA tracks, empty circles mark timesteps of 1 Myr, and filled circles mark the hot subdwarf phase (as defined in Section 2). The grey line shows the evolution from the ZAMS to the tip of the FGB. |
| In the text | |
|
Fig. 2. Evolutionary track of a star with an initial mass of 1.5 M⊙ stripped to an envelope mass of Menv = 0.01 M⊙, from envelope removal to the white dwarf cooling track. From top to bottom, the panels correspond to the evolution of: stellar luminosity (total in black, He-burning in red, and H-burning in blue); stellar radius; effective temperature; and mass (total in solid black and H-free core mass in dashed grey). The two red dashed vertical lines mark the interval corresponding to the hot subdwarf phase (as defined in Section 2). |
| In the text | |
|
Fig. 3. Left: same as in Fig. 2 but for Menv = 0.03 M⊙. Right: zoomed-in view highlighting the oscillatory behaviour in luminosity caused by variations of the nuclear reaction rates in the burning shells. |
| In the text | |
|
Fig. 4. Left: same as in Fig. 2 but for Menv = 0.06 M⊙. Right: zoomed-in view focusing on the TPAGB phase. |
| In the text | |
|
Fig. 5. Same as in Fig. 2, but for MZAMS = 3 M⊙ and Menv = 0.31 M⊙, which is the minimum required for this progenitor to experience a thermal pulse. |
| In the text | |
|
Fig. 6. Top panel: critical envelope mass required to reach the TPAGB phase, as a function of MZAMS. Black circles show the initial residual envelope mass set by the relax_mass process. Red plus signs and blue crosses show the envelope mass at the beginning and end of the subsequent subdwarf phase, respectively. Bottom panel: He-core mass at the tip of the FGB phase (black circles) and the enclosed mass of the strongly degenerate region (η > 4, red squares) within that core. |
| In the text | |
|
Fig. 7. Evolution in the Menv − MHe, core plane for the first models that reach the TPAGB phase for the different ZAMS masses (labelled at the beginning of each track). Progenitors with degenerate (left panel) and non-degenerate (right panel) ignition are shown separately. Black circles indicate Menv and MHe, core immediately after stripping, while red plus signs and blue crosses mark the beginning and end of the subdwarf phase, respectively. The lines trace the mass evolution from stripping to the end of core-He-burning. Pre-hot subdwarf evolution (before He burning becomes dominant) is connected with dashed lines, while evolution during the hot subdwarf phase is shown with solid lines. |
| In the text | |
|
Fig. 8. Location of our models during the hot subdwarf phase (as defined in Sect. 2) in the HR (top) and Kiel (bottom) diagrams. Left and right panels separate low-mass progenitors (MZAMS ≤ 1.9 M⊙), with degenerate He cores, from higher-mass ones (MZAMS ≥ 2.0 M⊙), that ignite He under non-degenerate or mildly degenerate conditions. Different symbols denote different ZAMS masses. Colours indicate the instantaneous H-envelope mass on a logarithmic scale (to provide better resolution at lower masses). The solid grey line marks the ZAMS (computed with MESA), the dashed box in the Kiel diagrams outlines the canonical sdB/sdOB region (Heber 1987), and the shaded area in the HR diagrams shows the instability strip from (Karczmarek et al. 2017), where RR Lyrae–type pulsators are expected. |
| In the text | |
|
Fig. 9. Comparison of post-stripping evolutionary tracks in the HR diagram for MZAMS = 1.5 M⊙ (left) and MZAMS = 3.0 M⊙ (right) in the tip FGB (blue) and early (black) removal scenarios. All models shown were left with a residual envelope of 0.01 M⊙. The symbol coding is the same as in Fig. 1. |
| In the text | |
|
Fig. 10. Evolution of physical parameters after stripping in the early-removal scenario for MZAMS = 1.5 M⊙ (left) and MZAMS = 3.0 M⊙ (right) models with Menv = 0.01 M⊙. The panels show the same quantities as in Fig. 2. |
| In the text | |
|
Fig. 11. Same as in Fig. 7, but for the critical models that reach the TPAGB in the early-removal scenario. |
| In the text | |
|
Fig. 12. Same as in Fig. 6 but comparing for models with two different metallicities: Z = 0.02 (solid lines) and Z = 0.004 (dashed lines). The enclosed mass of the strongly degenerate region is not shown in this case. |
| In the text | |
|
Fig. A.1. Same as in Fig. 8 for the early-removal scenario. The same range of H envelope masses during the hot subdwarf phase was intentionally used to allow a direct comparison of the evolutionary tracks with those from the tip-removal scenario. |
| In the text | |
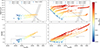 |
Fig. A.2. Same as in Fig. 8 for Z = 0.004. |
| In the text | |
Current usage metrics show cumulative count of Article Views (full-text article views including HTML views, PDF and ePub downloads, according to the available data) and Abstracts Views on Vision4Press platform.
Data correspond to usage on the plateform after 2015. The current usage metrics is available 48-96 hours after online publication and is updated daily on week days.
Initial download of the metrics may take a while.