


Fig. 9
Download original image
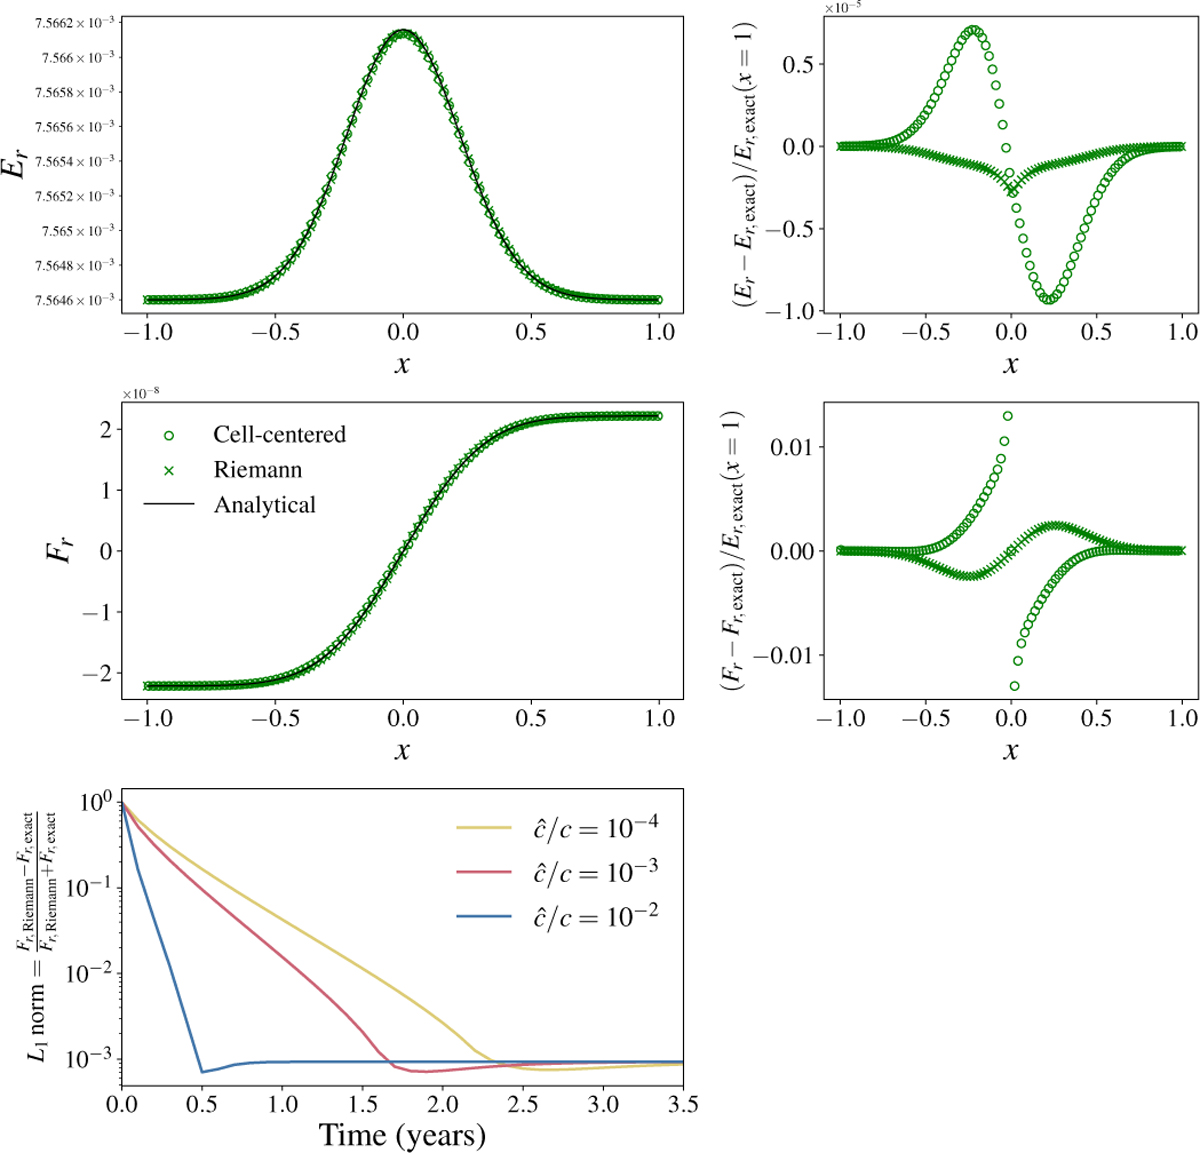
Top left and center left: radiative energy and radiative flux as a function of x for the vertical diffusion test. Empty circles show the cell-centered values. Crosses show the values of radiative flux from the Riemann solver and radiative energy reconstructed from the Riemann fluxes of energy and flux. The black line shows the analytical solution. Top right and center right: difference between our simulation and the analytical solution. Bottom: L1 relative norm for three different reduced speed of light ĉ/c = 10−2, 10−3, and 10−4 as blue, red, and yellow lines, respectively.
Current usage metrics show cumulative count of Article Views (full-text article views including HTML views, PDF and ePub downloads, according to the available data) and Abstracts Views on Vision4Press platform.
Data correspond to usage on the plateform after 2015. The current usage metrics is available 48-96 hours after online publication and is updated daily on week days.
Initial download of the metrics may take a while.