


Fig. 2
Download original image
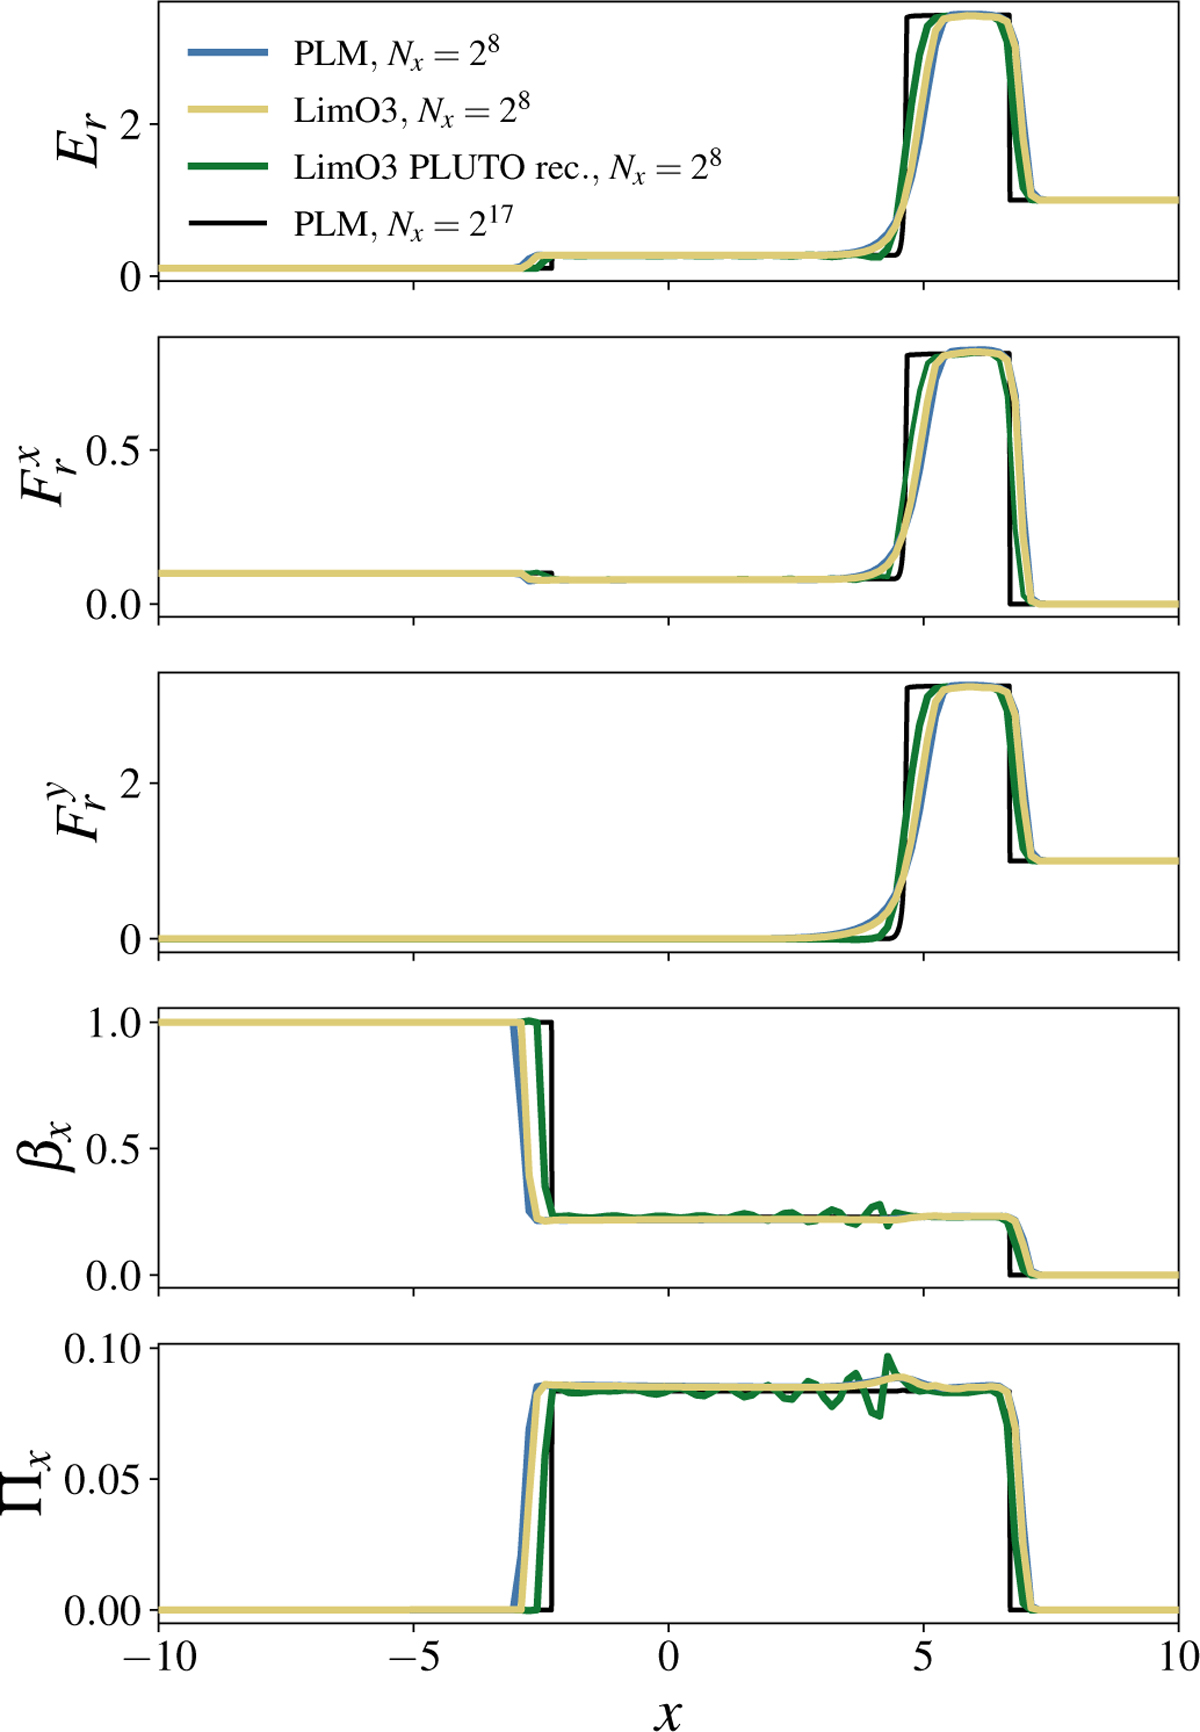
Second test of an optically thin shock tube. The blue and green lines show the results of simulations with 2° radial cells using a PLM reconstruction and a LimO3 reconstruction, respectively, with our reconstruction of f on the faces. The red line shows the result of a simulation with 2° radial cells using a PLM reconstruction with PLUTO’s reconstruction of f on the faces. The black line shows the reference solution using PLM reconstruction with 217 radial cells.
Current usage metrics show cumulative count of Article Views (full-text article views including HTML views, PDF and ePub downloads, according to the available data) and Abstracts Views on Vision4Press platform.
Data correspond to usage on the plateform after 2015. The current usage metrics is available 48-96 hours after online publication and is updated daily on week days.
Initial download of the metrics may take a while.