


Fig. 2.
Download original image
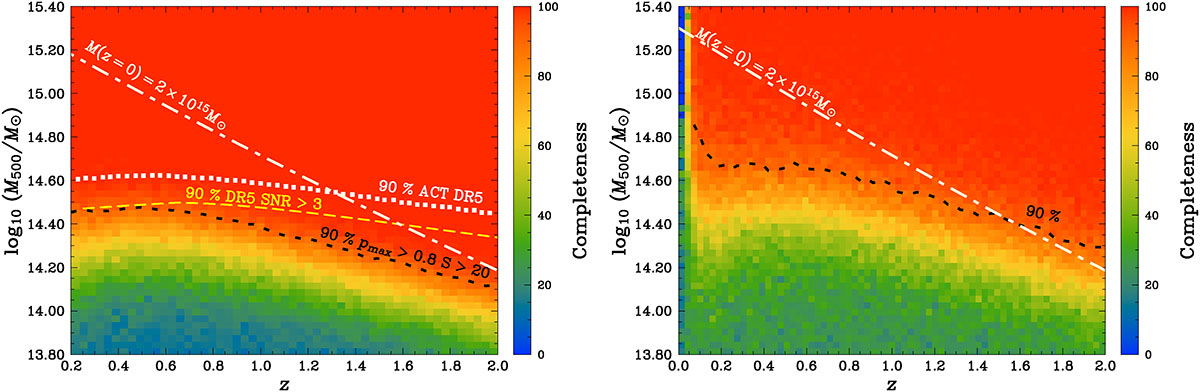
Estimated completeness of the DL based cluster catalogue (without Planck SZcat selection) in the (M500c, z) plane. The black dashed line corresponds to detection thresholds of pmax > 0.8 and S > 20. The white dash-dotted line represents the average mass evolution of a 2 × 10¹⁵ M⊙ cluster over redshift (from Fakhouri et al. 2010). Left panel: Within the ACT DR5 footprint (13 211 deg2). The black dashed contour shows the 90% completeness of the catalogue, while the solid yellow line marks the same level for the ACT DR5 S/N > 3 catalogue at matched purity. The ComPACT achieves higher completeness than ACT DR5S/N > 3 at fixed purity, especially for massive clusters at high redshift, while both catalogues perform comparably at low z. Right panel: Outside the ACT DR5 footprint (∼3000 deg2). Catalogue retains high completeness for massive clusters across the redshift range, demonstrating its potential to identify new systems beyond existing survey coverage.
Current usage metrics show cumulative count of Article Views (full-text article views including HTML views, PDF and ePub downloads, according to the available data) and Abstracts Views on Vision4Press platform.
Data correspond to usage on the plateform after 2015. The current usage metrics is available 48-96 hours after online publication and is updated daily on week days.
Initial download of the metrics may take a while.