


Fig. 8
Download original image
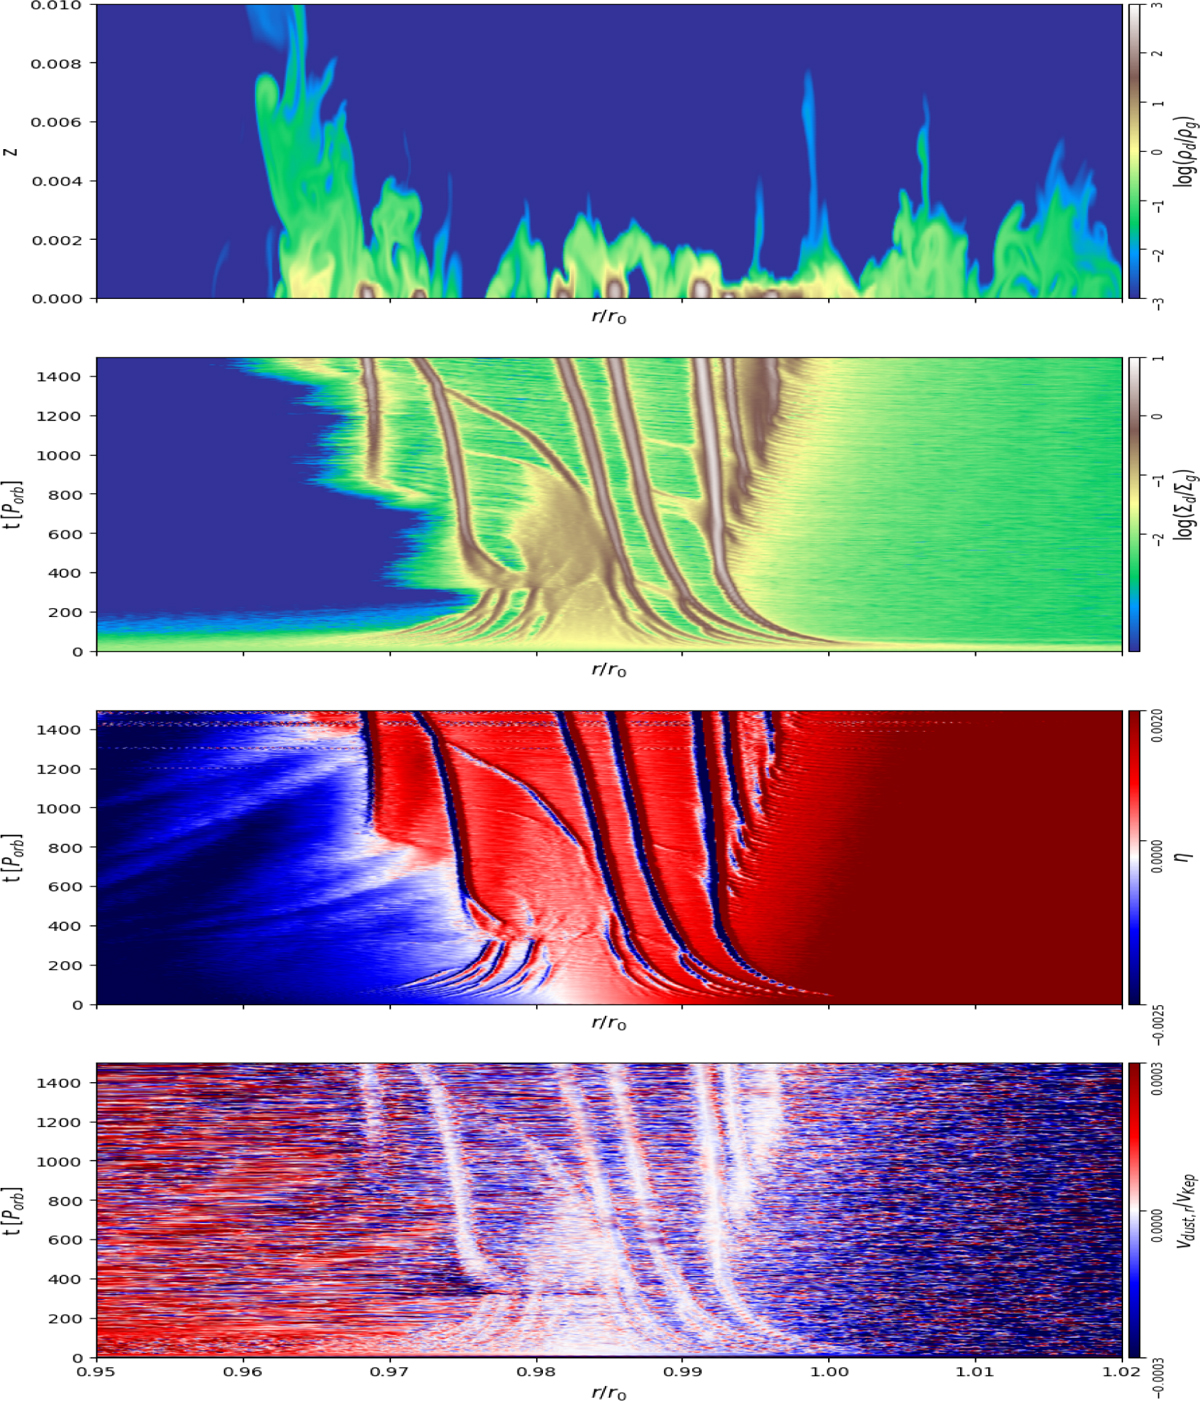
Evolution of the high resolution 2D r – z inviscid disk with ϵ0 = 0.01 and dust inflow. In the top panel, we plot the r – z view of the dust to gas volume density at the final integration time t = 1500 Porb. The lower panels show the evolution with time versus r/r0 of, respectively: the vertically integrated density ratio, Σd/Σg (second panel), the η values computed from midplane pressure gradient (third panel) and the midplane dust’s radial velocity υr (bottom panel). In the third panel, a transition from blue to red indicates an η sign inversion and thus a dust trapping location.
Current usage metrics show cumulative count of Article Views (full-text article views including HTML views, PDF and ePub downloads, according to the available data) and Abstracts Views on Vision4Press platform.
Data correspond to usage on the plateform after 2015. The current usage metrics is available 48-96 hours after online publication and is updated daily on week days.
Initial download of the metrics may take a while.