


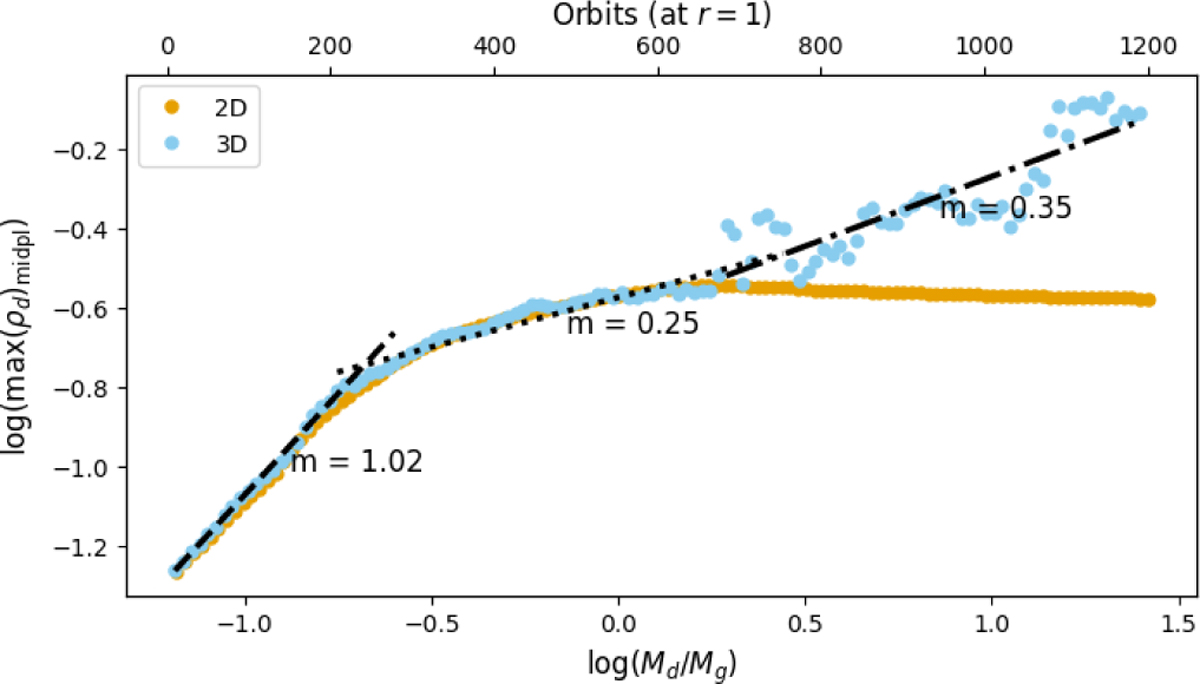
Fig. 10
Download original image
Maximum dust density in the ring as a function of the dust-togas mass ratio during gas removal for both a 2D (orange) and 3D (blue) viscous disk (α = 10−4). The upper x-axis indicates orbital periods at the reference radius of r = 1. Linear best-fit lines are shown for three stages of the gas evaporation process, with their slopes indicated next to each line. The slopes of the first two stages are consistent between the 2D and 3D case and then diverge in the final stage, where there is clumping in 3D.
Current usage metrics show cumulative count of Article Views (full-text article views including HTML views, PDF and ePub downloads, according to the available data) and Abstracts Views on Vision4Press platform.
Data correspond to usage on the plateform after 2015. The current usage metrics is available 48-96 hours after online publication and is updated daily on week days.
Initial download of the metrics may take a while.