


Fig. 7
Download original image
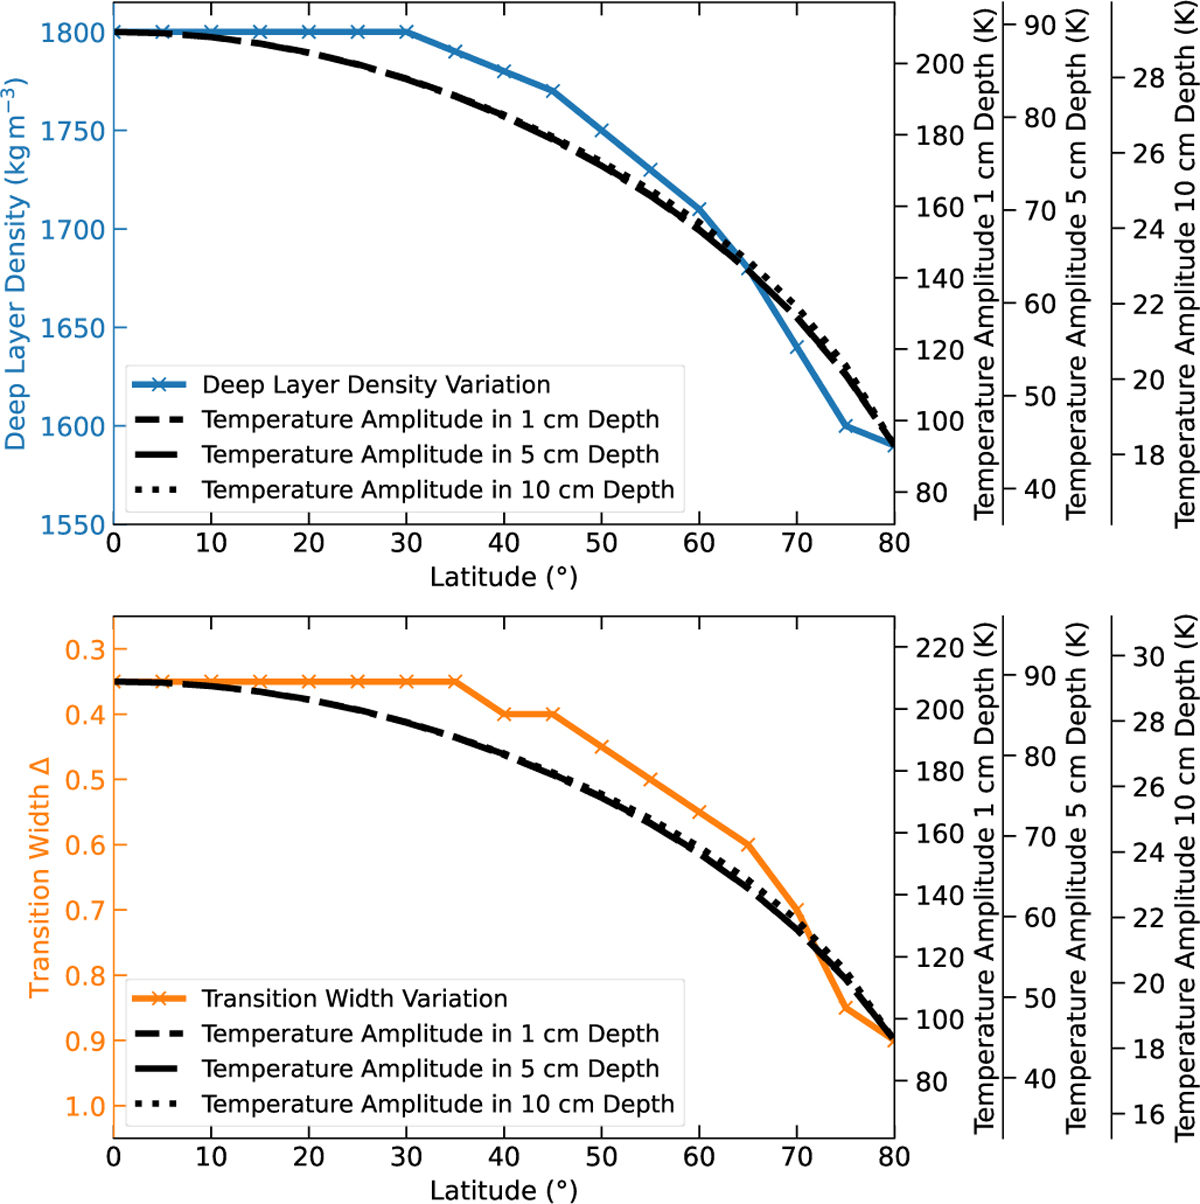
Predicted poleward decrease in deep layer density (top; blue line) and increase in transition width (bottom; orange line) based on the minimization of the latitudinal gradient for the Diviner regolith temperatures. Illustrated together with the poleward decrease in diurnal temperature amplitude in depths of 1 cm (dashed), 5 cm (dash-dotted), and 10 cm (dotted). The y axis of the diurnal temperature amplitudes is set to match the start and end values of the deep layer density or transition width variation.
Current usage metrics show cumulative count of Article Views (full-text article views including HTML views, PDF and ePub downloads, according to the available data) and Abstracts Views on Vision4Press platform.
Data correspond to usage on the plateform after 2015. The current usage metrics is available 48-96 hours after online publication and is updated daily on week days.
Initial download of the metrics may take a while.