


Fig. 6
Download original image
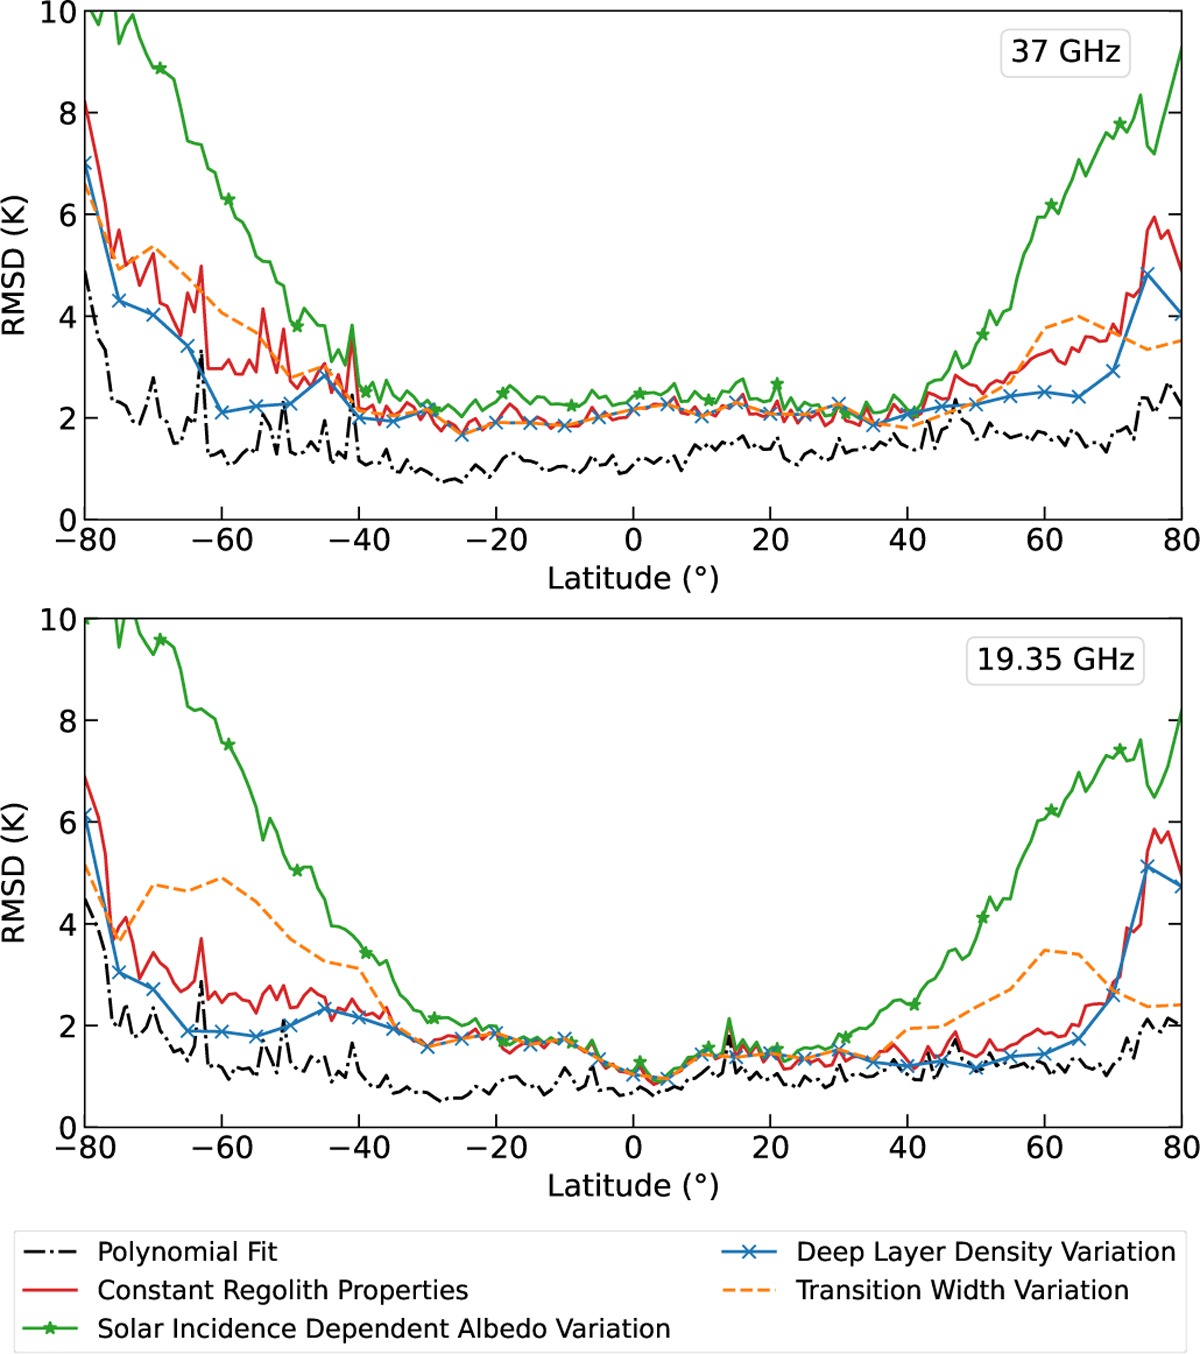
Resulting RMSD as a function of latitude when comparing the simulated microwave brightness temperatures with the MRM 37 GHz (top) and 19.35 GHz (bottom) data. Illustrated are the simulations assuming constant regolith properties (red line), applying a variation in the solar-incidence-dependent albedo (green stars), a poleward decrease in the deep layer density (blue crosses, calculated in steps of 5° latitude), or a poleward increase in the transition width (dashed orange, calculated in steps of 5° latitude), and the polynomial fit to the data (dash-dotted black).
Current usage metrics show cumulative count of Article Views (full-text article views including HTML views, PDF and ePub downloads, according to the available data) and Abstracts Views on Vision4Press platform.
Data correspond to usage on the plateform after 2015. The current usage metrics is available 48-96 hours after online publication and is updated daily on week days.
Initial download of the metrics may take a while.