


Fig. 10
Download original image
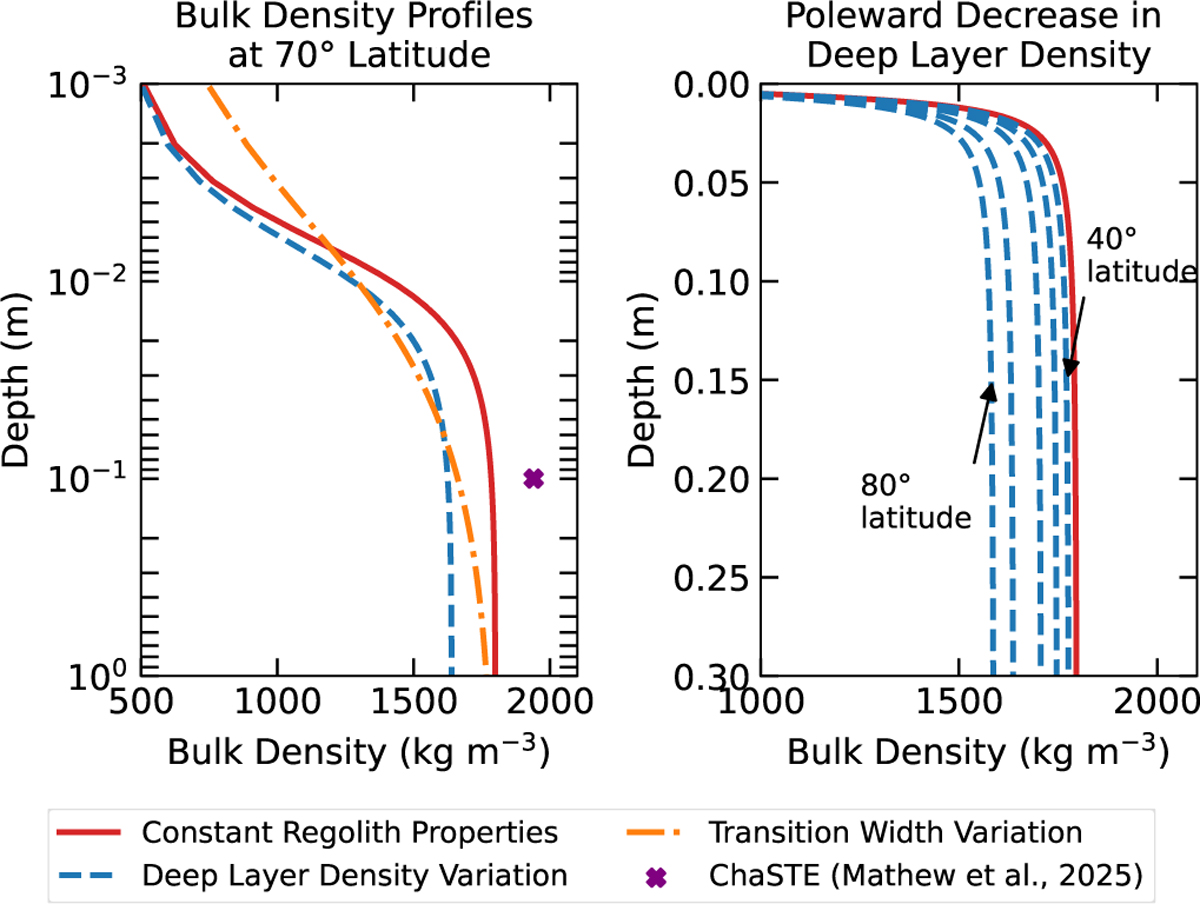
Left: Comparison of the different predicted bulk density profiles at 70° latitude; constant regolith properties (solid line), variation in deep layer density (dashed line), and transition width (dash-dotted line). Illustrated together with the bulk density inferred from ChaSTE (cross) at ∼−69° latitude (Mathew et al. 2025). Right: Bulk density profiles resulting from the predicted poleward decrease in deep layer density in steps of 10° latitude and a start at 40° latitude.
Current usage metrics show cumulative count of Article Views (full-text article views including HTML views, PDF and ePub downloads, according to the available data) and Abstracts Views on Vision4Press platform.
Data correspond to usage on the plateform after 2015. The current usage metrics is available 48-96 hours after online publication and is updated daily on week days.
Initial download of the metrics may take a while.