


Fig. 8.
Download original image
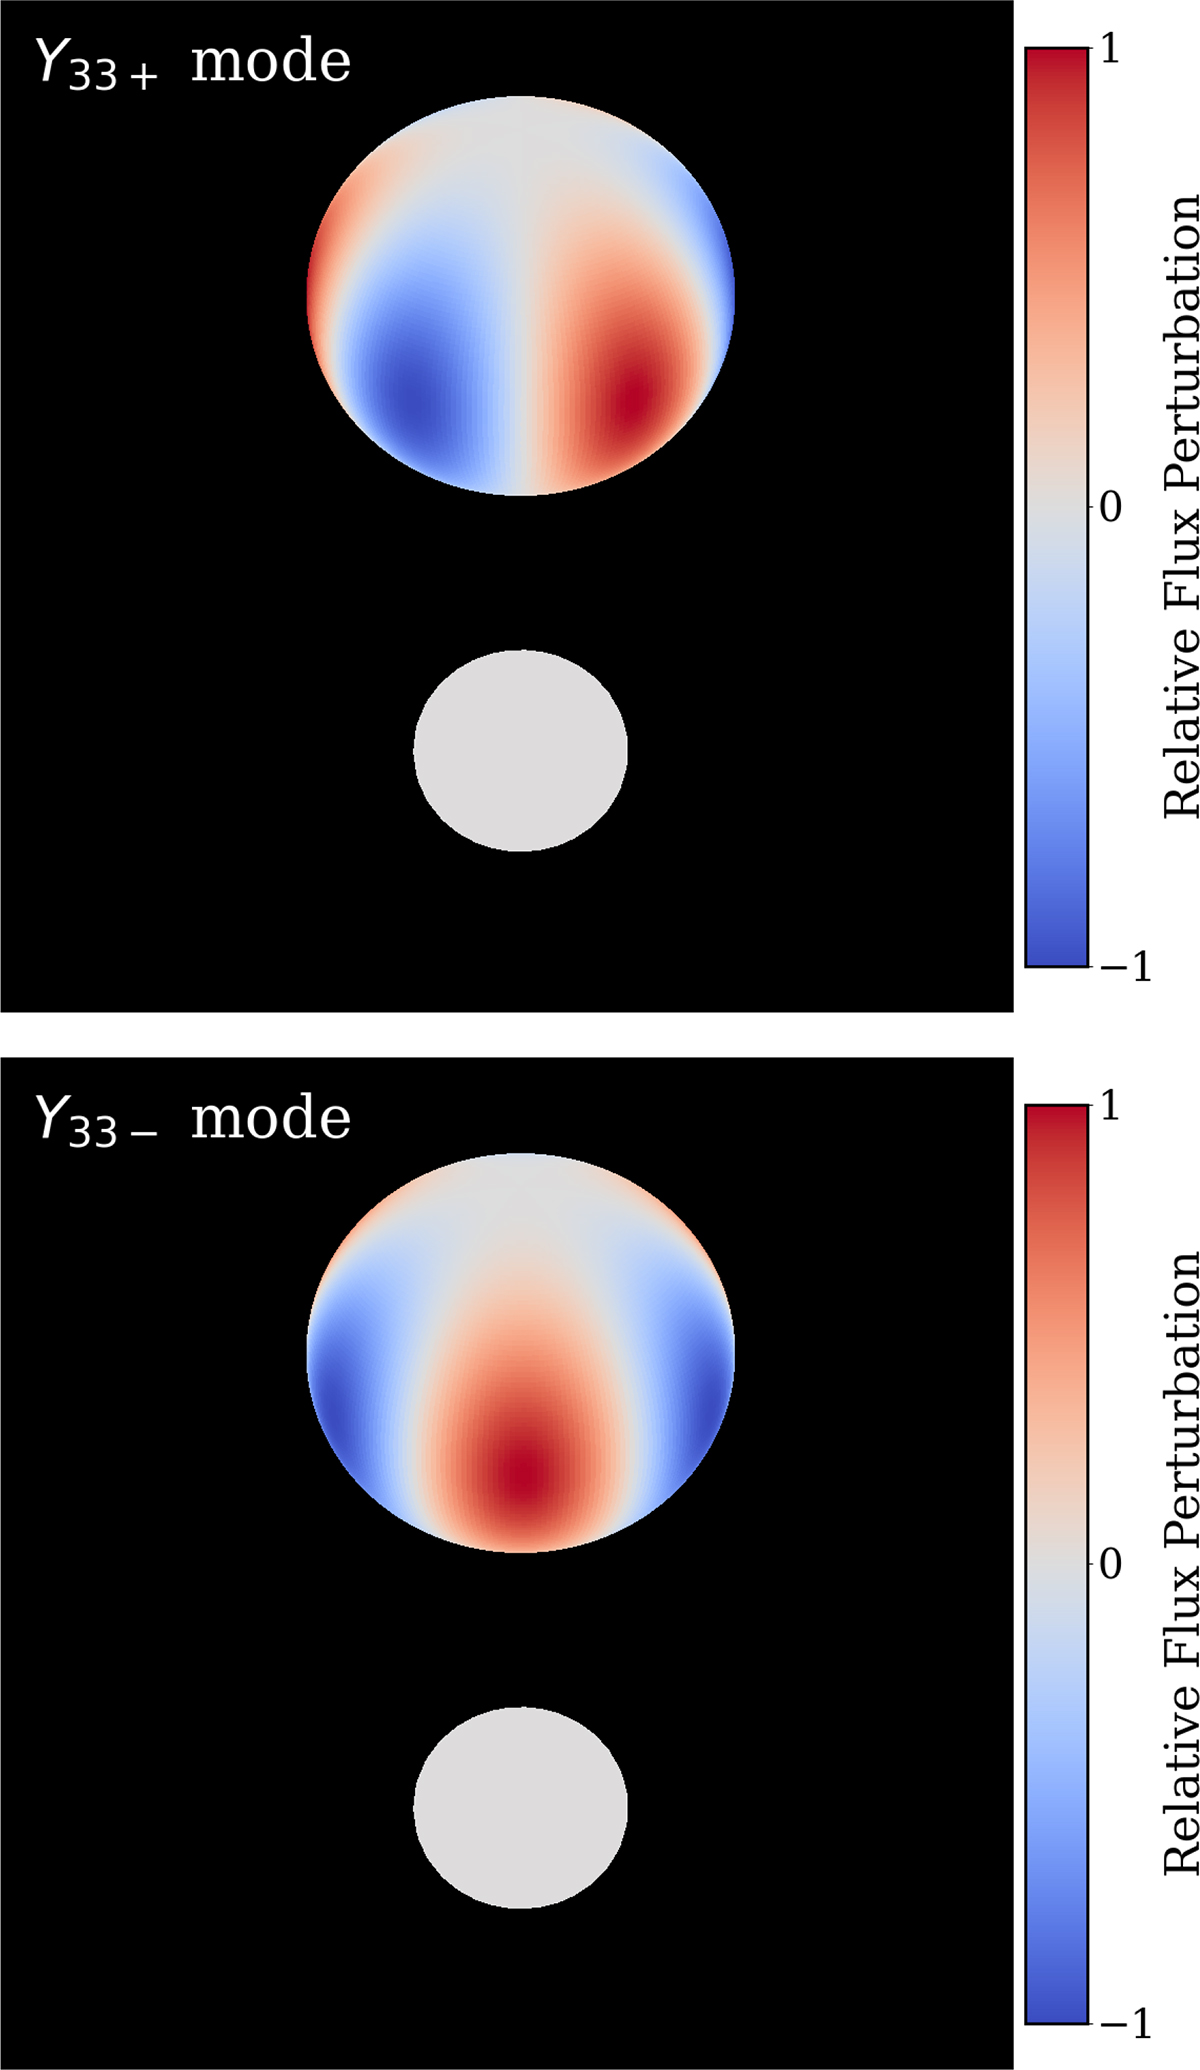
Diagrams showing the flux perturbation across the surface of a star pulsating in the Y33+ mode (top) and Y33− mode (bottom). The diagram corresponds to orbital phase zero for an observer viewing at at inclination i = 55° relative to the orbital axis. The observed phase of the amplitude modulation of the O1 mode is consistent with that of a Y33+ mode.
Current usage metrics show cumulative count of Article Views (full-text article views including HTML views, PDF and ePub downloads, according to the available data) and Abstracts Views on Vision4Press platform.
Data correspond to usage on the plateform after 2015. The current usage metrics is available 48-96 hours after online publication and is updated daily on week days.
Initial download of the metrics may take a while.