


Fig. 5
Download original image
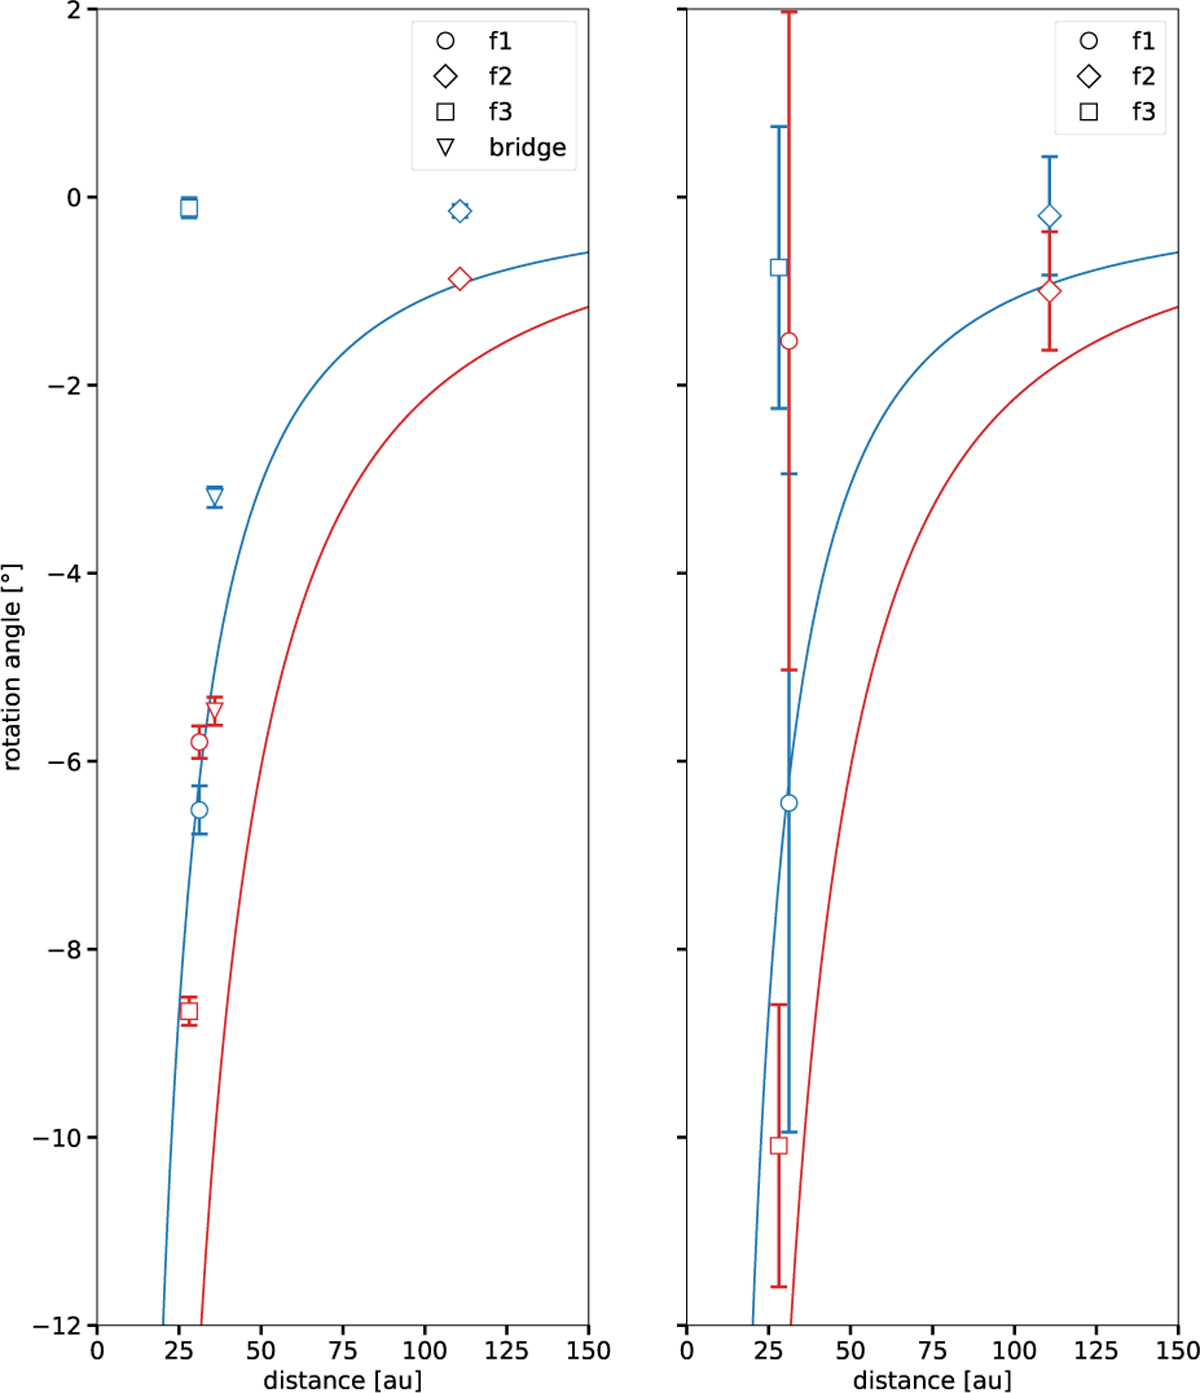
Rotation of the main disk features for two epoch pairs (2021 vs. 2019 in blue and 2023 vs. 2019 in red). The symbols correspond to f1 (circle), f2 (diamond), f3 (square), and the bridge (triangle). Each curve shows the expected Keplerian rotation using the same color coding as the symbols. The left panel shows the results from the optimization method, while the right panel shows results from Gaussian fitting (only for f1, f2, and f3).
Current usage metrics show cumulative count of Article Views (full-text article views including HTML views, PDF and ePub downloads, according to the available data) and Abstracts Views on Vision4Press platform.
Data correspond to usage on the plateform after 2015. The current usage metrics is available 48-96 hours after online publication and is updated daily on week days.
Initial download of the metrics may take a while.