


Fig. 1
Download original image
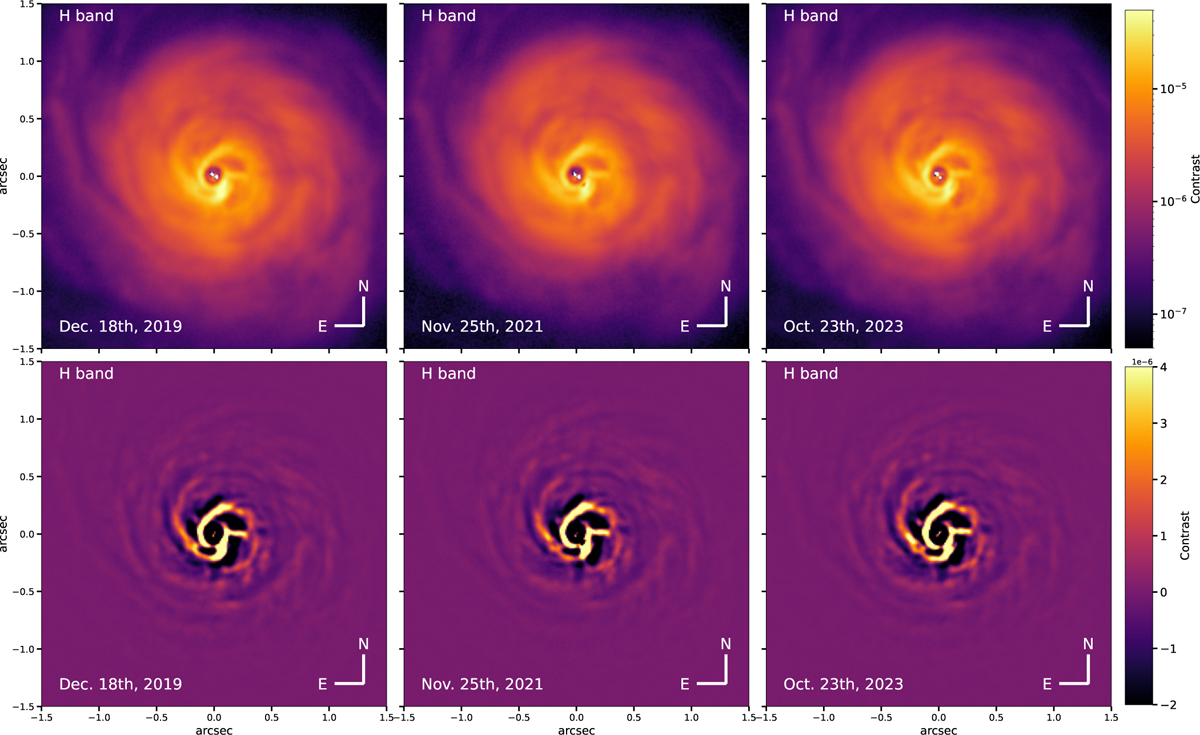
H-band images of AB Aur Qφ in a 3″ × 3″ field of view at three epochs (December 2019, November 2021, and October 2023). The top row is displayed in logarithmic scale, while the bottom row is a high-pass filtered version in linear scale. The color bar shows the contrast obtained by normalizing with the out-of-mask point spread function image. North is up and east is left.
Current usage metrics show cumulative count of Article Views (full-text article views including HTML views, PDF and ePub downloads, according to the available data) and Abstracts Views on Vision4Press platform.
Data correspond to usage on the plateform after 2015. The current usage metrics is available 48-96 hours after online publication and is updated daily on week days.
Initial download of the metrics may take a while.