


Fig. 7
Download original image
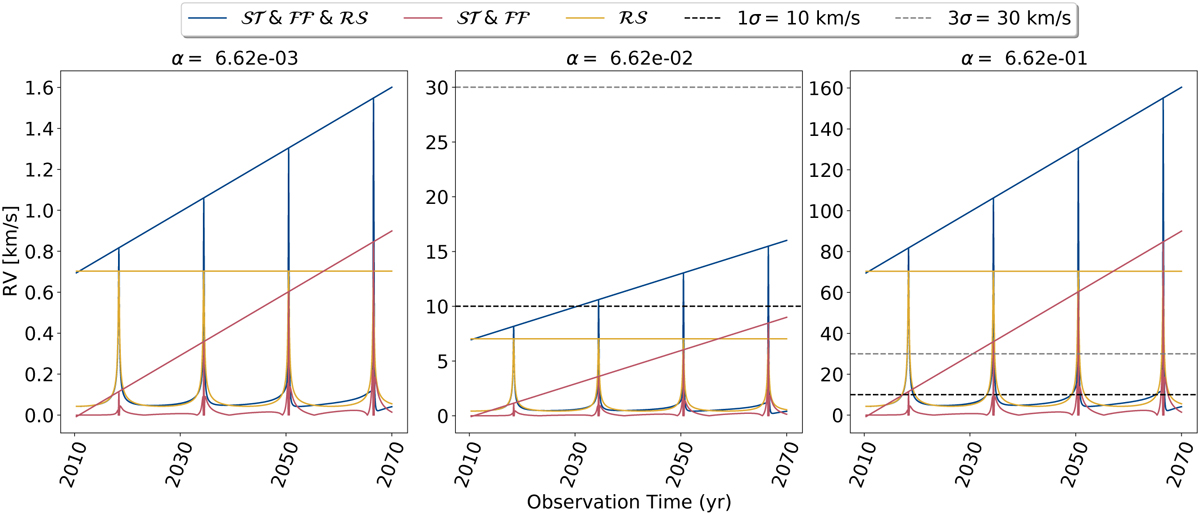
Evolution of RV deviation for three values of α. The opaque lines (blue, red, and yellow, with spikes at the bottom) represent the RV absolute difference between (i) MOG EoM with MOG ℛ𝒮 and GR EoM with GR ℛ𝒮 (blue), (ii) MOG EoM without ℛ𝒮 and GR EoM without ℛ𝒮 (red), and (iii) GR EoM with MOG ℛ𝒮 and GR EoM with GR ℛ𝒮 (yellow). An explanation of the labels can be found in Table 2. Instead, the transparent lines, namely, the progressive red and blue lines and the constant yellow line that connect the peaks of the respective opaque lines, represent the evolution of the corresponding RV absolute difference peaks. The horizontal dashed black and grey lines represent the 1σ and 3σ precision of the instrument, respectively.
Current usage metrics show cumulative count of Article Views (full-text article views including HTML views, PDF and ePub downloads, according to the available data) and Abstracts Views on Vision4Press platform.
Data correspond to usage on the plateform after 2015. The current usage metrics is available 48-96 hours after online publication and is updated daily on week days.
Initial download of the metrics may take a while.