


| Issue |
A&A
Volume 710, June 2026
|
|
|---|---|---|
| Article Number | A358 | |
| Number of page(s) | 8 | |
| Section | Planets, planetary systems, and small bodies | |
| DOI | https://doi.org/10.1051/0004-6361/202659015 | |
| Published online | 29 June 2026 | |
Polarimetry and albedo of the near-Earth asteroid 2025 FA22
1
Université Côte d’Azur, CNRS, OCA, LAGRANGE,
France
2
Armagh Observatory & Planetarium, College Hill,
Armagh
BT61 9DG,
UK
3
Institute of Astronomy and National Astronomical Observatory, Bulgarian Academy of Sciences,
72 Tsarigradsko Chaussée Blvd.,
BG-1784
Sofia,
Bulgaria
4
INAF – Osservatorio Astrofisico di Torino,
via Osservatorio 20,
10025
Pino Torinese,
Italy
5
ESA NEO Coordination Centre, European Space Agency,
Largo Galileo Galilei, 1,
Frascati,
00044,
RM,
Italy
6
Department of Physics, University of Helsinki,
PO Box 64,
00014,
Finland
7
INAF – Osservatorio astronomico di Roma,
Via Frascati 33,
00078
Monteporzio Catone,
Italy
8
Department of Astronomy, University of Maryland,
College Park,
MD
20742-2421,
USA
9
Caltech/IPAC,
1200 E California Blvd, MC 100-22,
Pasadena,
CA
91125,
USA
10
Department of Physics and Astronomy,
20014
University of Turku, Turku,
Finland
11
Istituto Ricerche Solari Aldo e Cele Daccò (IRSOL), Faculty of Informatics, Università della Svizzera italiana,
Via Patocchi 57,
Locarno,
Switzerland
12
Euler Institute, Faculty of Informatics, Università della Svizzera italiana,
Via Buffi 13,
6900
Lugano,
Switzerland
13
Astronomical Institute of the Academy of Sciences of the Czech Republic,
Fričova 298,
Ondřejov,
25165
Czech Republic
14
INAF Padova,
Padova,
Italy
★ Corresponding author: This email address is being protected from spambots. You need JavaScript enabled to view it.
Received:
17
January
2026
Accepted:
18
May
2026
Abstract
We report spectropolarimetric and broadband polarimetric observations of the near-Earth asteroid (NEA) 2025 FA22 during its close approach on 18 September 2025 (about two Moon distances). With a diameter estimated between 130 and 290 m, 2025 FA22 is among the largest NEAs observable at such proximity, prompting an International Asteroid Warning Network (IAWN) rapid-response campaign. Although early orbital solutions indicated a possible impact in 2089, further follow-up astrometric observations ruled out a collision hazard. The favourable geometry of this close encounter enabled dense coverage of the positive part of the phase-polarisation curve, from the high polarisation domain (high phase angles), to near the inversion angle where the linear polarisation fraction vanishes. The spectropolarimetric observations provided the wavelength dependence of the polarisation fraction. Using empirical relationships, an estimate of the geometric albedo could be drawn from the slope of the phase-polarisation curve at an inversion angle pv = 0.17 ± 0.04 in the V band. This value, together with the spectropolarimetric trend, provides constraints on the taxonomic class, with the results being most consistent with an M (or Xc)-type classification. These results demonstrate the value of polarimetry and spectropolarimetry for the rapid characterisation of newly discovered NEAs in planetary defence campaigns.
Key words: techniques: polarimetric / minor planets, asteroids: individual: 2025 FA22
© The Authors 2026
 Open Access article, published by EDP Sciences, under the terms of the Creative Commons Attribution License (https://creativecommons.org/licenses/by/4.0), which permits unrestricted use, distribution, and reproduction in any medium, provided the original work is properly cited.
This article is published in open access under the Subscribe to Open model. This email address is being protected from spambots. You need JavaScript enabled to view it. to support open access publication.
1 Introduction
On 18 September 2025, the near-Earth asteroid (NEA) 2025 FA22 (hereafter FA22) had a close approach to Earth, reaching a minimum distance of about two lunar distances. With an estimated diameter between 130 and 290 m, FA22 is among the largest NEAs observed at such a close range. Initially flagged as a possible impactor in 2089 and briefly topping ESA’s Risk List1, a subsequent astrometric follow-up quickly refined its orbit and excluded any imminent impact scenario. Although FA22 poses no imminent hazard, its encounter presented a rare opportunity to carry out coordinated, multi-technique observations in the framework of the International Asteroid Warning Network (IAWN), a United-Nations-endorsed consortium that coordinates global observations, data sharing, and communication on potential impact threats. In particular, the FA22 campaign was aimed at testing the planetary defence community’s readiness to rapidly characterise a newly discovered NEA.
In this framework, polarimetry is particularly powerful. By measuring the linear polarisation of scattered sunlight as a function of phase angle (the angle between the target – Sun and target – observer directions), it is possible to derive key surface properties including albedo, regolith structure, and, when spectropolarimetric data are collected, taxonomic classification (see Bagnulo et al. 2024 for a review).
Main-belt asteroids have been extensively studied with polarimetry, but geometrical constraints limit their ground-based observations to phase angles below 30–40°, where polarisation is small (≲3%). Near-Earth asteroids, by contrast, can be observed at much larger phase angles where the fraction of linear polarisation becomes much higher, providing a golden opportunity to probe a mostly unexplored regime of asteroid polarimetric behaviour, including a better understanding of the polarisation–albedo relationship. Such measurements are directly relevant for planetary defence: coupled with brightness measurements, albedo is a key parameter for obtaining reliable estimates of an object’s size. Moreover, surface properties inferred from polarimetric data influence the design and execution of any possible deflection attempt whenever this is needed.
Here, we report spectropolarimetric and multi-band filter-polarimetric measurements of FA22 obtained during its close approach. Our observing strategy exploited the brightness evolution of the object: spectropolarimetry was carried out when FA22 was near its maximum brightness, enabling reliable measurements of polarisation wavelength dependence. Broadband filter polarimetry was used when the object was fainter to efficiently sample the phase-polarisation curve with minimal telescope time.
Figure 1 shows the observing geometry of FA22 relative to the Earth and Moon in the projected ecliptic x–y (left) and x–z (right) planes during the campaign. The first date of each observing epoch is marked along the asteroid’s path. During the campaign, the NEA passed close to the Earth–Moon system, reaching a minimum geocentric distance of about 842 060 km.
For atmosphereless bodies in the solar system, the polarisation state of the scattered solar light was estimated through the ‘linear polarisation fraction’ defined as
![Mathematical equation: $\[P_{\mathrm{r}}(\alpha, \lambda)=\frac{F_{\perp}-F_{\|}}{F_{\perp}+F_{\|}},\]$](/articles/aa/full_html/2026/06/aa59015-26/aa59015-26-eq1.png) (1)
(1)
where F∥ and F⊥ are the fluxes of the light polarised in the direction parallel or perpendicular to the scattering plane, respectively. A positive sign for Pr means that the light flux polarized perpendicularly to the scattering plane exceeds the flux polarized parallel to it, whereas a negative sign means that the parallel polarization dominates. The linear polarisation fraction (hereafter ‘polarisation’) depends on the wavelength and on the phase angle. The phase–polarisation curve shows two distinct branches. At small phase angles, typically 520°, the flux polarized parallel to the scattering plane dominates the flux polarized perpendicularly; this is called the ‘negative branch’. At larger phase angles, however, the flux perpendicularly polarized dominates, forming the ‘positive branch’. In our dataset, we achieved dense coverage of the positive branch, starting just above the inversion angle α0 (that separates the two branches) and extending up to the phase angles where the polarisation reaches its maximum. Here, we present our data, used to estimate the albedo of the object via semi-empirical formulas that link it to the characteristics of the phase-polarisation curve (e.g. Cellino et al. 2012, 2016b). Additional constraints from spectropolarimetry also allowed us to set some constraints on the spectral class of the asteroid.
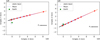 |
Fig. 1 Observing geometry of FA22 relative to the Moon and Earth in the projected ecliptic x–y (left) and x–z (right) planes. The stars mark the first observation on each date listed in Table A.1. The vertical bar indicates the projected point at the closest Earth approach (2025-09-18 at 07:39:48.108 UTC; distance ≈842 060 km). The solid black arrow indicates the anti-solar vector at the median epoch of the observing campaign. |
2 Observations
We measured the linear polarisation fraction as a function of wavelength λ and phase angle α. In the case of filter polarimetry, λ refers to the effective wavelength of the filter employed in the observations.
Observations were obtained between 2025-09-18 and 2025-09-28 using both spectropolarimetry and filter polarimetry, covering phase angles from 109° to 24.2° (see the full observing log in Table A.1). Data were collected at multiple observatories with different instruments, all employing the beam-swapping technique (e.g. Bagnulo et al. 2009). Throughout this article, the dates are specified in the UTC time scale (Coordinated Universal Time).
Filter polarimetry was performed with nominally similar B, V, and R filters whose transmission curves differed slightly between instruments. Table 1 summarizes the characteristics of the filters involved in the filter polarimetry measurements. In this table, λ0 is the central wavelength, and Δλ is the FWHM (Full Width at Half Maximum). For DIPol-UF, the given values combine the effect of the filters and of the dichroic beam splitters, as discussed in Berdyugin et al. (2022).
While such differences can be critical in cases where polarisation varies rapidly with wavelength, asteroid polarisation varies smoothly across the optical range. As a result, small differences in filter transmission have a negligible effect compared to the photon-noise uncertainties for this target. This assumption was confirmed a posteriori through numerical simulations based on FORS spectropolarimetry combined with different filter transmission functions and in agreement, within uncertainties, with observations obtained at nearly identical phase angles with different instruments. Although detailed information on the exact filters is provided in the relevant instrument documentation (see below), we hereafter refer to the data simply as B, V, and R band observations.
Filters definition for filter polarimetry measurements.
2.1 Filter polarimetry with DIPoI-UF
Multicolour filter polarimetry of FA22 was obtained with the Double Image Polarimeter Ultra Fast (DIPol-UF) described by Piirola et al. (2021). This three-channel (B′, V′, and R′) polarimeter is attached to the f/12.5 Cassegrain focus of the Omicron/C2PU telescope (diameter 1.03 m), located at the Calern observing station at the Observatoire de la Côte d’Azur, France. The setup involves a super-achromatic half-wave plate (HWP) as the modulator and a plane-parallel calcite plate as the polarising beam splitter. The polarimeter simultaneously records two orthogonally polarised beams from each source in the field of view. Dichroic beam splitters enable simultaneous recording on three dedicated CCD cameras in the B′, V′, and R′ filters (see Table 1 and a more complete description in Berdyugin et al. (2022)). Each cycle involved 16 positions of the retarder plate, and for each position, three images with a 90 s exposure time were taken simultaneously by the B′, V′, and R′ cameras. The telescope was in differential tracking mode (following the proper motion of the asteroid). The target’s high proper motion combined with long exposure times yielded long trailed images for the surrounding stars. Thus, some images were rejected because of stellar contamination. Data were reduced following the pipeline described by Piirola et al. (2021) and references therein. DIPol-UF observations spanned from 2025-09-18 03:42 UTC (phase angle of 107.47°) to 2025-09-23 22:02 UTC (phase angle 28.58°). See Table A.1 for more details.
2.2 Spectropolarimetry with FORS2
We obtained spectropolarimetric observations of FA22 using the FORS2 instrument (Appenzeller et al. 1998) on the ESO Very Large Telescope (VLT). FORS2 is a slit-fed spectrograph equipped with a retarder wave plate and a Wollaston prism acting as a beam-splitter polariser. Observations were performed with the 300 V grism without using any order-sorting filter, providing spectral coverage between 370 and 930 nm. (Bagnulo et al. 2017b have demonstrated that FORS2 spectropolarimetry with the 300 V grism is not affected by order contamination). Slit width was set to 2″, for a spectral resolving power R ≃ 200. These spectropolarimetric observations spanned from 2025-09-18 08:16 UTC (phase angle 96.98°) to 2025-09-20 05:28 UTC (phase angle 41.85°). See Table A.1 for more details. Data were reduced using the ESO FORS pipeline (Izzo et al. 2010), supplemented by dedicated Fortran routines. Two frames obtained on 2025-10-18 were discarded in our analysis, due to background star contamination; the polarisation spectra were inconsistent with those obtained in other epochs.
Spectropolarimetric observations of main-belt asteroids were also obtained with the same configuration. The spectrum of asteroid (433) Eros was obtained on 2014-02-15 at α = 42.0° and published by Bagnulo et al. (2015). The spectra of (45) Eugenia and (21) Lutetia were obtained on 2015-06-18 at α = 21.8° and on 2015-06-02 at α = 27.5°, respectively. Figure 3 shows these spectra normalised to their values at 550 nm.
2.3 Filter polarimetry with FORS2
In addition to spectropolarimetry, the FORS2 instrument on the ESO VLT was also used to obtain broadband polarimetric measurements, using the R_special and ν_high filters (see Table 1). These filter polarimetric observations spanned from 2025-09-22 03:40 UTC (phase angle 32.20°) to 2025-09-28 04:05 UTC (phase angle 24.17°). See Table A.1 for more details. The instrument position angle was aligned to the direction perpendicular to the scattering plane. We measured only the reduced Q/I parameter, setting the retarder wave plate to position angles of 0,45, 90, and 135°; observations at the intermediate angles of 22.5, 67.5, 112.5, and 157.5° were skipped, as in a reference system aligned with the scattering plane, the U/I parameter is zero for symmetry reasons. The data were reduced as described by Bagnulo et al. (2016) and Bagnulo et al. (2023).
2.4 Filter polarimetry with FoReRo2
We also obtained imaging polarimetry in the R filter (see Table 1) with the two-channel Focal Reducer Rozhen (FoReRo2) (Jockers et al. 2000; Nikolov et al. 2026) attached to the 2-m Ritchey–Chrétien-Coudé (2 mRCC) telescope at the Bulgarian National Astronomical Observatory (BNAO) Rozhen over four nights from 2025-09-18 02:49 UTC (phase angle 109.43°) to 2025-09-20 21:33 UTC (phase angle 36.92°). See Table A.1 for more details. The observations were carried out for eight retarder wave-plate angles. The field of view was generally very crowded, and sometimes the target overlapped the background star trails. For each retarder position angle, we retained three frames in which the asteroid image was not contaminated by star trails.
2.5 Filter polarimetry with ALFOSC
We obtained imaging polarimetric observations in the R_Bes and B_Bes filters (see Table 1) with the Alhambra Faint Object Spectrograph and Camera (ALFOSC) attached to the F/11 focus of the 2.56 m Nordic Optical Telescope (NOT) over three nights from 2025-09-18 05:09 UTC (phase angle 104.24°) to 2025-09-24 04:14 UTC (phase angle 28.19°). See Table A.1 for more details. The polarimetric setup consists of a rotatable retarder wave plate followed by a calcite plate as a beam-splitting device. Observations in each filter consisted of exposures at 16 different retarder wave-plate angles. As in the case of FoReRo2, a number of frames were removed due to background star contamination. The data were reduced using dedicated Python scripts. Further descriptions of the instrument and data reduction techniques are outlined in Gray et al. (2024).
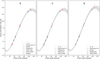 |
Fig. 2 Phase-polarisation curves in the R band (left), V band (centre), and B band (right). The solid lines correspond to the best fits obtained with Eq. (3) and the grey zones to the ±1σ boundaries. |
3 Results
The observing log and the polarisation measurements are given in Table A.1. Polarimetric data were collected in the B, V, and R bands. The FORS2 spectropolarimetric values of Table A.1 were convolved with the transmission curves of the DIPol-UF filters (see e.g. Eqs. (19) of Bagnulo et al. 2017a).
We also determined the polarimetric wavelength gradient, or polarimetric colour, defined as
![Mathematical equation: $\[P C\left(\lambda_1, \lambda_2\right)=\frac{P_{\mathrm{r}}\left(\lambda_2\right)-P_{\mathrm{r}}\left(\lambda_1\right)}{\left(\lambda_2-\lambda_1\right)},\]$](/articles/aa/full_html/2026/06/aa59015-26/aa59015-26-eq2.png) (2)
(2)
where λ2 > λ1 are the central wavelengths of two consecutive bands (R and V, or V and B). Table 1 summarizes the central wavelengths of the spectral bands of this work. The polarimetric colours PC(B,V) and PC(V,R) reported in Table A.1 refer to the effective wavelengths of the R, V, and B filters, expressed in percent per nanometre. In the following, we analyse the behaviour as a function of wavelength λ and phase angle α of the quantity Pr(α, λ).
3.1 The phase-angle polarisation curve and albedo determination
Figure 2 shows the Pr values as a function of phase angle. The morphology of these phase-polarisation curves can be characterised by parameters that are linked with important physical characteristics of the object, including the geometric albedo. As mentioned above, because NEAs can be observed at small distances from the Earth, observations can cover much wider phase-angle intervals than those of main-belt asteroids.
The behaviour is characterised by a moderately steep polarimetric slope. At phase angles of around 50°, Pr reaches values slightly larger than 5% in all filters, suggesting an albedo already significantly higher than that of some low-albedo NEAs, such as (3200) Phaethon (Devogèle et al. 2018).
We computed a best fit to the data shown in Fig. 2 by using the function
![Mathematical equation: $\[P_{\mathrm{r}}(\alpha)=A ~\sin ^B(\alpha) ~\cos ^C\left(\frac{\alpha}{2}\right) ~\sin \left(\alpha-\alpha_0\right),\]$](/articles/aa/full_html/2026/06/aa59015-26/aa59015-26-eq3.png) (3)
(3)
where A, B, C, and the inversion phase angle α0 are parameters determined via best-fit techniques. Equation (3) is the so-called trigonometric representation of the phase-polarisation relationship of asteroids originally proposed by Lumme & Muinonen (1993) and later adopted by other authors, including, for instance, Penttila et al. (2005) and Devogèle et al. (2018). This representation of the phase-polarisation curve is normally used to fit NEA polarimetric data, because it provides a satisfactory representation of observations obtained up to high phase angles, well beyond the limits reached by main-belt asteroids.
A Levenberg-Marquardt algorithm allowed us to recover the best-fit values for the A, B, C, and α0 parameters, as well as the corresponding covariant matrix. This matrix leads to the 1σ uncertainty on the fit parameters. For a given set of fit parameters, the so-called polarimetric slope h, defined as the derivative of the modelled phase-polarisation curve Pr(α) at the inversion angle α0 can be computed analytically by
![Mathematical equation: $\[h=A ~\sin ^B\left(\alpha_0\right) ~\cos ^C\left(\frac{\alpha_0}{2}\right).\]$](/articles/aa/full_html/2026/06/aa59015-26/aa59015-26-eq4.png) (4)
(4)
The positions (αmin, αmax) and values (Pmin, Pmax) of the minimum and maximum of the modelled phase-polarisation curve can be computed by calculating the zeroes of the derivative of Pr(α). To estimate the 1σ uncertainty of these quantities, a Monte Carlo approach was used. A number N = 10 000 of quadruplets (A, B, C, α0) were randomly drawn, according to Gaussian distributions with mean and standard deviations given by the values and uncertainty derived from the Levenberg-Marquardt fit. For each of theses random realizations, the quantities h, αmin, αmax, Pmin, and Pmax were calculated. Their mean and standard deviations provide estimates of the values and uncertainties of these quantities. The resulting values are listed in Table 2. The inversion angle and the slope at the inversion angle have very similar values in the R, V, and B bands: α0 ~ 19.5° and h ~ 0.12%/deg (see Table 2). Note the lack of polarimetric data in the negative branch of the phase-polarisation curve. The values of α0 and h reported here were thus derived through model-fitting. They are model-dependent.
The polarimetric slope h is an important parameter characterising a phase-polarisation curve, as it yields an estimate of the geometric albedo p through semi-empirical relationships such as
![Mathematical equation: $\[\log _{10}~(p)=C_1 ~\log _{10}~(h)+C_2,\]$](/articles/aa/full_html/2026/06/aa59015-26/aa59015-26-eq5.png) (5)
(5)
where C1 and C2 are band-dependent empiric calibration constants. Several sets of (C1, C2) calibration constants can be found in the literature. See, for example, Cellino et al. (2015) and the thorough synthesis by Lupishko (2018). In the V filter, the empiric constants C1 = −1.111 ± 0.031 and C2 = −1.781 ± 0.025 in Cellino et al. (2015) yield the albedo estimate pV = 0.175 ± 0.040. The constants C1 = −1.016 ± 0.010 and C2 = −1.719 ± 0.012 in Lupishko (2018) (weighted mean number 2) yield pV = 0.165 ± 0.033. Both estimates are compatible. It is worth emphasizing that this estimate of the geometric albedo is both calibration-dependent through the C1 and C2 values, and model-dependent through the h value, which is derived from extrapolation using the trigonometric model (Eq. (3)), since no measurements on FA22 are available for the negative branch.
Best-fit coefficients and characteristic parameters of the polarimetric curve with their 1σ uncertainties.
3.2 Maximum positive polarisation
Our polarimetric measurements of FA22 allow us to estimate the maximum positive fraction of linear polarisation Pmax, a determination that is possible only in rare cases where the object is observed at phase angles up to at least 100–110°. This parameter potentially provides an important constraint for modelling the asteroid’s surface properties, such as its surface regolith grain size (Ito et al. 2018). Figure 3 of Geake & Dollfus (1986) shows an empirical relationship between Pmax and the albedo for different sizes of particles. According to this plot, our Pmax ≃ 14% and albedo ≃0.17 tells us that the particles are large, at least larger than 200 μm.
3.3 Polarisation versus wavelength
Table A.1 shows that the broadband values are generally quite close to each other, with the polarisation in the B filter slightly higher than in the other filters. This situation is called ‘blue polarisation’. Figure 3 shows the polarisation spectrum obtained at phase angles ≃97°, normalised by its values in the V filter (such a normalisation makes the spectrum fairly independent on the phase angle at which it was obtained, see Bagnulo et al. 2015). The spectrum of FA22 is nearly flat, exhibiting a very mild overall concave shape, with a negative wavelength gradient in the spectral regions covered by the B, V, and R filters (λ ~ 400–700 nm), and a positive wavelength gradient at longer wavelengths (λ ~ 750–900 nm). At its red end, our polarimetric spectrum nearly reaches the same high values as those at its blue end. We note that the full spectrum out to about 0.9 nm reveals a more complex pattern than what the B, V, and R filters alone suggest. This indicates that reliable classification and characterisation of small bodies in the Solar System would benefit from spectropolarimetry over a wide wavelength range, ideally extending into the IR.
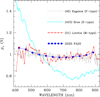 |
Fig. 3 Normalised polarisation spectrum of FA22 obtained on 2025-09-18 at α ≃ 97° (solid blue circles) compared with the spectra of other asteroids (obtained in the positive branch). |
3.4 Searching for rotational modulation
Rotational modulation of asteroid polarisation is rarely observed, which suggests that surface structure usually does not vary enough to produce detectable changes at small phase angles. A clear exception is Vesta, where ultra-precise measurements revealed such variability (Wiktorowicz & Nofi 2015; Cellino et al. 2016a). Near-Earth asteroids offer better chances because they can be observed at large phase angles, where the intrinsic polarisation is higher and potential variations stand out more clearly (Borisov et al. 2018; Devogèle et al. 2024). For FA22, however, we found no evidence of rotational modulation. Figure 4 shows the residuals between the observed polarisation and the best fit, normalised to the fitted values, plotted against rotational phase. We adopted a rotation period of 13.075 h (Nath 2026) and set phase zero at 2025-09-18 00:00 UTC.
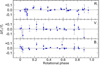 |
Fig. 4 Normalized residual polarisation fraction (residuals between the observed polarisation and the best fit, normalised to the fitted values), plotted as a function of the rotational phase of FA22. |
4 Comparison with other asteroids
The polarisation spectrum of FA22 resembles the nearly wavelength-independent behaviour shown by some C-class asteroids reported by Kwon et al. (2023). This similarity, however, does not imply a compositional link. The Umov law (Umov 1905) tells us that polarimetric spectra often track the inverse of reflectance spectra. Within any taxonomic class, the range of spectral slopes can be wide. C-type asteroids, for example, exhibit steep, moderate, and nearly flat reflectance slopes (DeMeo et al. 2009). Their inverse trends differ accordingly. Because of this variability, matching FA22 to any specific C-type asteroid would be unreliable. FA22 lacks the low albedo typical of the C class, typically well below 0.08, and its polarisation phase curve does not show the steep behaviour expected for that group.
Figure 3 shows a striking resemblance between the polarisation spectrum of FA22 and that of the main-belt F-class asteroid (45) Eugenia. However, the inversion angle of the polarisation curve of FA22, α0 ~ 20° is typical of the large majority of the main-belt asteroids. This rules out a link to other classes of low-albedo asteroids, including the B class and, more markedly, the F class, which exhibit α0 values below 20° (Belskaya et al. 2017). Moreover, a few of these asteroids either reach values of Pmax ≳ 40% (B-type asteroid 3200 Phaeton; Devogèle et al. 2018) or exceed 20% already at a phase angle of ~50° (F-type asteroid 101955 Bennu; Cellino et al. 2018), well above what we measured for FA22. We can also exclude asteroids with unusually large inversion angles, such as the Barbarians, which show α0 > 30° (e.g. Cellino et al. 2006, 2018).
The albedo of FA22 is only marginally consistent with that of several S-class asteroids. These objects, though, show a slope reversal in their polarisation spectra, which occurs at longer wavelengths than in FA22. (Their reversal appears near 760 nm, while FA22 shows a minimum near 700 nm). The polarimetric slopes of S-class asteroids are also much steeper than those measured here, both where the gradient is positive and where it is negative (see, as an example, the polarimetric spectrum of the S class NEA (433) Eros shown in Fig. 3). Furthermore, S types reach at most Pmax ≃ 7–8% (Ishiguro et al. 2017; Kiselev et al. 2024; Shcherbina et al. 2025), which is much lower than the value for FA22.
An interesting fact is the resemblance between some polarimetric properties of FA22 and those of the lunar highlands. For example, they have similar albedos, characteristics of the polarisation minimum, and Pmax value. Also, some young features exhibit similar wavelength-dependent polarisation behaviour (Shkuratov et al. 2015). However, they differ in the inversion angle and location of the maximum.
Although the problem of finding asteroidal analogues of the polarimetric spectrum of FA22 seems difficult, We note a clear similarity with the polarimetric spectrum of the large (about 100 km in diameter) asteroid (21) Lutetia, originally a member of the Tholen M class (Tholen 1984) and later reclassified as Xc in the SMASS system (Bus & Binzel 2002; DeMeo et al. 2009). Xc asteroids typically show almost flat reflectance and polarisation spectra (Bagnulo et al. 2015), and some exhibit α0 ~ 20° (Cañada-Assandri et al. 2012).
The polarimetric spectrum of Lutetia is displayed as a red line in Fig. 3, and it is easy to see that its spectrum fits the polarisation spectrum of FA22 quite well. According to current knowledge, (21) Lutetia and FA22 also share comparable albedos, but their phase polarisation curves exhibit some relevant differences. Lutetia inverts near 25° (Cellino et al. 2016a), while FA22 does so around 20°.
(21) Lutetia’s former taxonomic classification is interesting, because M-class asteroids were long thought to be metal rich (Matter et al. 2013). The spectroscopic survey of M types by Fornasier et al. (2010) shows a wide range of reflectance slopes whose shapes resemble the inverse of FA22’s polarisation spectrum. This makes an M- (or Xc-) class assignment plausible. Belskaya et al. (2022) conducted a general investigation of the polarimetric properties of asteroids that had been originally assigned to the M taxonomic class. They found that, when looking at the relationship between the depth of the negative polarisation branch and the inversion angle, they could subdivide M-class asteroids into two main sub-types, possibly related to different surface compositions. One subgroup seems similar to irons and stony-iron meteorites, while the second subgroup, which includes (21) Lutetia, seems more similar to enstatite and iron-rich carbonaceous chondrites.
5 Conclusions
Following earlier NEA polarimetric observations collected between 2020 and 2023 within the NEOROCKS project2, these new observations of FA22 represent one of the most extensive and systematic polarimetric studies of a NEA at large phase angles. Although they sample only the positive polarisation branch, the data are dense and accurate enough to determine key polarimetric parameters, including the inversion angle α0, the polarimetric slope h, and the maximum positive polarisation Pmax, reached at a phase angle of about 110°. We also obtained the first spectropolarimetric measurements of a small Solar System body near its polarisation maximum. We find no convincing evidence for surface heterogeneity producing measurable polarimetric effects.
These results constrain the surface properties of FA22 and provide a valuable test case for rapid-response polarimetric techniques applied to newly discovered NEAs. We derive an albedo of 0.17 ± 0.04 in the V band, intermediate between typical C-class and S-complex asteroids. This value, together with the polarisation spectrum, is consistent with some M- (or Xc)-type asteroids. Combined with forthcoming photometric measurements of the absolute magnitude of FA22, this albedo will enable estimates of the object’s size.
Acknowledgements
Based on observations obtained with data collected at the Paranal Observatory under programs ID 115.29F0.002 and 115.29F0.003 (filter polarimetry and spectropolarimetry of FA22, PI: Ieva), 095.C-0925(A) (spectropolarimetry of Lutetia and Eugenia, PI: Bagnulo) and 092.C-0639(A) (spectropolarimetry of Eros, PI: Cellino). G.B. acknowledges partial support from grant KΠ-06-H88/5 by the Bulgarian National Science Fund. G.B. gratefully acknowledges observing grant support from the Institute of Astronomy and the National Astronomical Observatory, Bulgarian Academy of Sciences. BNAO Rozhen is a facility of the National Roadmap for Research Infrastructure 2020-2027 (RACIO project), financially coordinated by the Ministry of Education and Science of the Republic of Bulgaria. S.V.B. acknowledges the support of the ERC Advanced Grant HotMol ERC-2011-AdG-291659 for the construction of the DIPol-UF polarimeter, in collaboration with the University of Turku, Finland. This project is funded by the Horizon Europe Programme of the European Union and implemented by ESA. Views and opinion expressed are however those of the authors only and the European Commission cannot be held responsible for any use which may be made of the information contained therein.
References
- Appenzeller, I., Fricke, K., Fürtig, W., et al. 1998, The Messenger, 94, 1 [NASA ADS] [Google Scholar]
- Bagnulo, S., Landolfi, M., Landstreet, J. D., et al. 2009, PASP, 121, 993 [Google Scholar]
- Bagnulo, S., Fossati, L., Landstreet, J. D., & Izzo, C. 2015, A&A, 583, A115 [NASA ADS] [CrossRef] [EDP Sciences] [Google Scholar]
- Bagnulo, S., Belskaya, I., Stinson, A., Christou, A., & Borisov, G. B. 2016, A&A, 585, A122 [NASA ADS] [CrossRef] [EDP Sciences] [Google Scholar]
- Bagnulo, S., Cox, N. L. J., Cikota, A., et al. 2017a, A&A, 608, A146 [NASA ADS] [CrossRef] [EDP Sciences] [Google Scholar]
- Bagnulo, S., Nazé, Y., Howarth, I. D., et al. 2017b, A&A, 601, A136 [NASA ADS] [CrossRef] [EDP Sciences] [Google Scholar]
- Bagnulo, S., Gray, Z., Granvik, M., et al. 2023, ApJ, 945, L38 [NASA ADS] [CrossRef] [Google Scholar]
- Bagnulo, S., Belskaya, I., Cellino, A., et al. 2024, Astron. Astrophys. Rev., 32, 7 [Google Scholar]
- Belskaya, I., Fornasier, S., Tozzi, G., et al. 2017, Icarus, 284, 30 [NASA ADS] [CrossRef] [Google Scholar]
- Belskaya, I. N., Berdyugin, A., Krugly, Y., et al. 2022, A&A, 663, A146 [NASA ADS] [CrossRef] [EDP Sciences] [Google Scholar]
- Berdyugin, A. V., Piirola, V., Bagnulo, S., Landstreet, J. D., & Berdyugina, S. V. 2022, A&A, 657, A105 [NASA ADS] [CrossRef] [EDP Sciences] [Google Scholar]
- Borisov, G., Devogèle, M., Cellino, A., et al. 2018, MNRAS, 480, L131 [Google Scholar]
- Bus, S. J., & Binzel, R. P. 2002, Icarus, 158, 146 [Google Scholar]
- Cañada-Assandri, M., Gil-Hutton, R., & Benavidez, P. 2012, A&A, 542, A11 [NASA ADS] [CrossRef] [EDP Sciences] [Google Scholar]
- Cellino, A., Belskaya, I. N., Bendjoya, P., et al. 2006, Icarus, 180, 565 [Google Scholar]
- Cellino, A., Gil-Hutton, R., Dell’Oro, A., et al. 2012, J. Quant. Spectr. Rad. Trans., 113, 2552 [Google Scholar]
- Cellino, A., Bagnulo, S., Gil-Hutton, R., et al. 2015, MNRAS, 451, 3473 [NASA ADS] [CrossRef] [Google Scholar]
- Cellino, A., Ammannito, E., Magni, G., et al. 2016a, MNRAS, 456, 248 [Google Scholar]
- Cellino, A., Bagnulo, S., Gil-Hutton, R., et al. 2016b, MNRAS, 455, 2091 [Google Scholar]
- Cellino, A., Bagnulo, S., Belskaya, I. N., & Christou, A. A. 2018, MNRAS, 481, L49 [NASA ADS] [CrossRef] [Google Scholar]
- DeMeo, F. E., Binzel, R. P., Slivan, S. M., & Bus, S. J. 2009, Icarus, 202, 160 [Google Scholar]
- Devogèle, M., Cellino, A., Borisov, G., et al. 2018, MNRAS, 479, 3498 [Google Scholar]
- Devogèle, M., McGilvray, A., MacLennan, E., et al. 2024, Planet. Sci. J., 5, 44 [Google Scholar]
- Fornasier, S., Clark, B. E., Dotto, E., et al. 2010, Icarus, 210, 655 [NASA ADS] [CrossRef] [Google Scholar]
- Geake, J. E., & Dollfus. 1986, MNRAS, 218, 75 [NASA ADS] [CrossRef] [Google Scholar]
- Gray, Z., Bagnulo, S., Granvik, M., et al. 2024, PSJ, 5, 18 [Google Scholar]
- Ishiguro, M., Kuroda, D., Watanabe, M., et al. 2017, AJ, 154, 180 [Google Scholar]
- Ito, T., Ishiguro, M., Arai, T., et al. 2018, Nat. Commun., 9, 2486 [Google Scholar]
- Izzo, C., de Bilbao, L., Larsen, J., et al. 2010, SPIE Conf. Ser., 7737, 773729 [NASA ADS] [Google Scholar]
- Jockers, K., Credner, T., Bonev, T., et al. 2000, Kinematika i Fizika Nebesnykh Tel Supplement, 3, 13 [NASA ADS] [Google Scholar]
- Kiselev, N. N., Savushkin, A. A., Petrov, D. V., et al. 2024, MNRAS, 527, 3174 [Google Scholar]
- Kwon, Y., Bagnulo, S., & Cellino, A. 2023, A&A, 677, A146 [NASA ADS] [CrossRef] [EDP Sciences] [Google Scholar]
- Lumme, K., & Muinonen, K. 1993, IAU Symp., 160, 194 [Google Scholar]
- Lupishko, D. F. 2018, Sol. Syst. Res., 52, 98 [Google Scholar]
- Matter, A., Delbo, M., Carry, B., & Ligori, S. 2013, Icarus, 226, 419 [NASA ADS] [CrossRef] [Google Scholar]
- Nath, A. 2026, Minor Planet Bull., 53, 129 [Google Scholar]
- Nikolov, Y., Borisov, G., Bagnulo, S., et al. 2026, A&A, 708, A30 [NASA ADS] [CrossRef] [EDP Sciences] [Google Scholar]
- Penttila, A., Lumme, K., Hadamcic, E., & Levasseur-Regourd, A.-C. 2005, A&A, 432, 1081 [NASA ADS] [CrossRef] [EDP Sciences] [Google Scholar]
- Piirola, V., Kosenkov, I. A., Berdyugin, A. V., Berdyugina, S. V., & Poutanen, J. 2021, AJ, 161, 20 [Google Scholar]
- Shcherbina, M. P., Kiselev, N. N., Karpov, N. V., & Zhuzhulina, E. A. 2025, Sol. Syst. Res., 59, 61 [Google Scholar]
- Shkuratov, Y., Opanasenko, N., Korokhin, V., & Videen, G. 2015, in Polarimetry of Stars and Planetary Systems, eds. L. Kolokolova, J. Hough, & A.-C. Levasseur-Regourd (Cambridge: Cambridge University Press), 303 [Google Scholar]
- Tholen, D. J. 1984, PhD thesis, University of Arizona, USA [Google Scholar]
- Umov, N. A. 1905, Phis. Zeits., 6, 674 [Google Scholar]
- Wiktorowicz, S. J., & Nofi, L. A. 2015, ApJ, 800, L1 [NASA ADS] [CrossRef] [Google Scholar]
Appendix A Observing log of the polarimetric measurements
Observing log for the 2025 FA22 polarimetric campaign.
All Tables
Best-fit coefficients and characteristic parameters of the polarimetric curve with their 1σ uncertainties.
All Figures
|
Fig. 1 Observing geometry of FA22 relative to the Moon and Earth in the projected ecliptic x–y (left) and x–z (right) planes. The stars mark the first observation on each date listed in Table A.1. The vertical bar indicates the projected point at the closest Earth approach (2025-09-18 at 07:39:48.108 UTC; distance ≈842 060 km). The solid black arrow indicates the anti-solar vector at the median epoch of the observing campaign. |
| In the text | |
|
Fig. 2 Phase-polarisation curves in the R band (left), V band (centre), and B band (right). The solid lines correspond to the best fits obtained with Eq. (3) and the grey zones to the ±1σ boundaries. |
| In the text | |
|
Fig. 3 Normalised polarisation spectrum of FA22 obtained on 2025-09-18 at α ≃ 97° (solid blue circles) compared with the spectra of other asteroids (obtained in the positive branch). |
| In the text | |
|
Fig. 4 Normalized residual polarisation fraction (residuals between the observed polarisation and the best fit, normalised to the fitted values), plotted as a function of the rotational phase of FA22. |
| In the text | |
Current usage metrics show cumulative count of Article Views (full-text article views including HTML views, PDF and ePub downloads, according to the available data) and Abstracts Views on Vision4Press platform.
Data correspond to usage on the plateform after 2015. The current usage metrics is available 48-96 hours after online publication and is updated daily on week days.
Initial download of the metrics may take a while.