


Fig. 8
Download original image
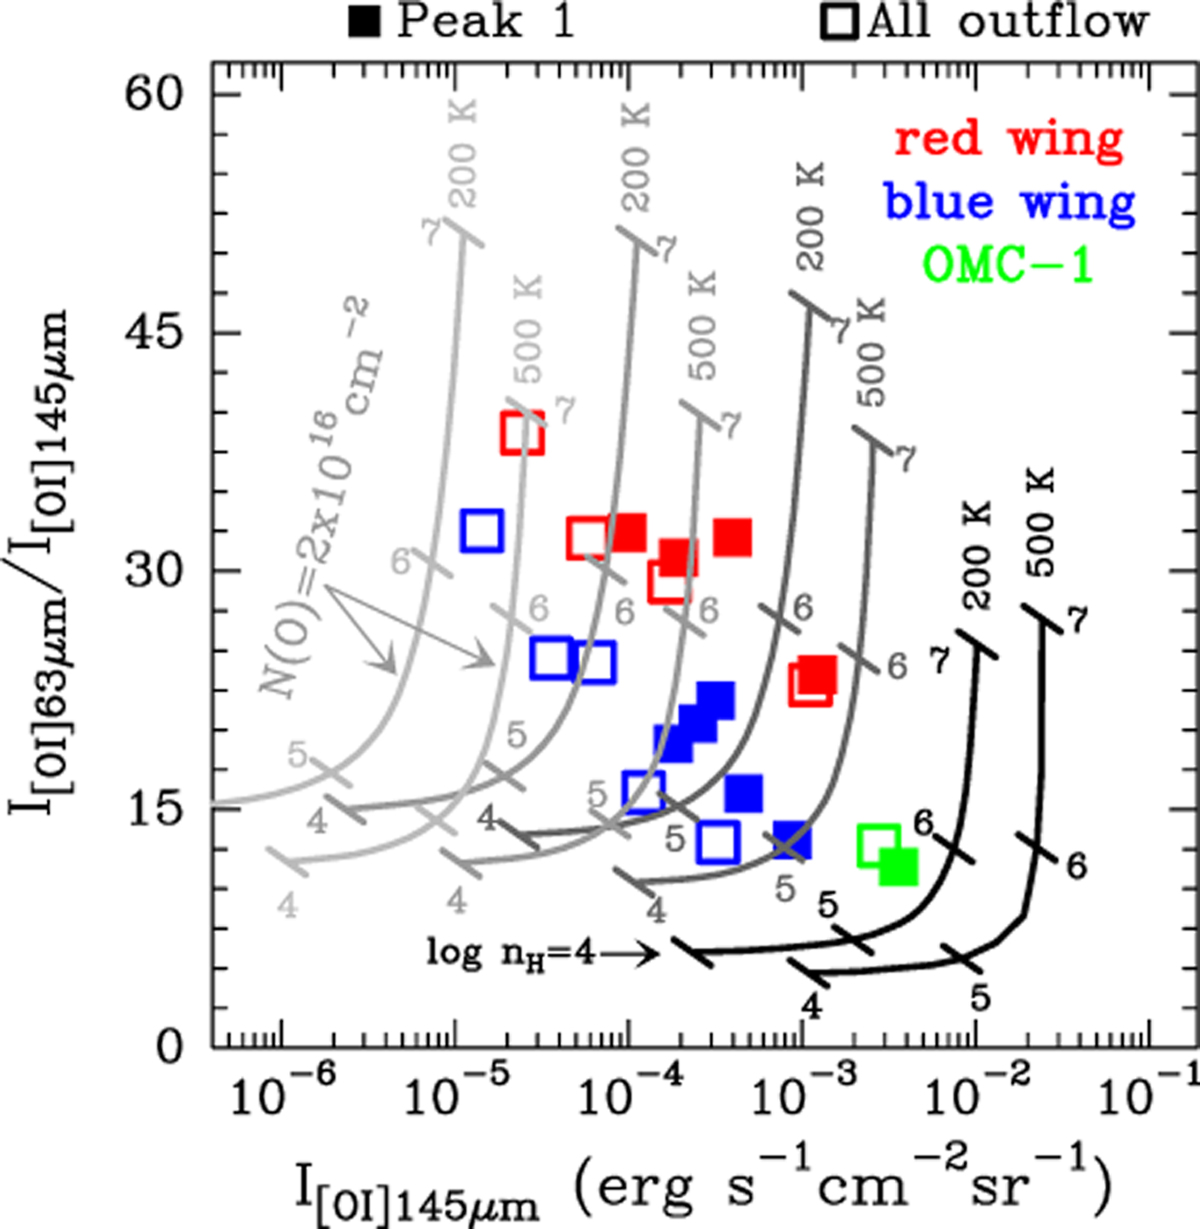
[O I] 63/145 µm intensity ratio versus [O I] 145 µm intensity. The light grey to black curves show a grid of radiative transfer models for four values of N(O): 2×10¹⁶, 2×10¹⁷, 2×10¹⁸, and 2×1019 cm−2, from left to right, at 200 and 500 K. Tick marks denote log nH (in cm−3) and are separated by one decade along curves of constant N(O). The colored squares show the observed values in LSR velocity bins of 5 km s−1 toward Peak 1 (filled squares) and averaged over the BN/KL outflow (open squares). Red squares correspond to the redshifted line wing, while blue squares correspond to the blueshifted line wing. Green squares correspond to OMC-1 velocities (see Tables D.2 and D.3).
Current usage metrics show cumulative count of Article Views (full-text article views including HTML views, PDF and ePub downloads, according to the available data) and Abstracts Views on Vision4Press platform.
Data correspond to usage on the plateform after 2015. The current usage metrics is available 48-96 hours after online publication and is updated daily on week days.
Initial download of the metrics may take a while.