


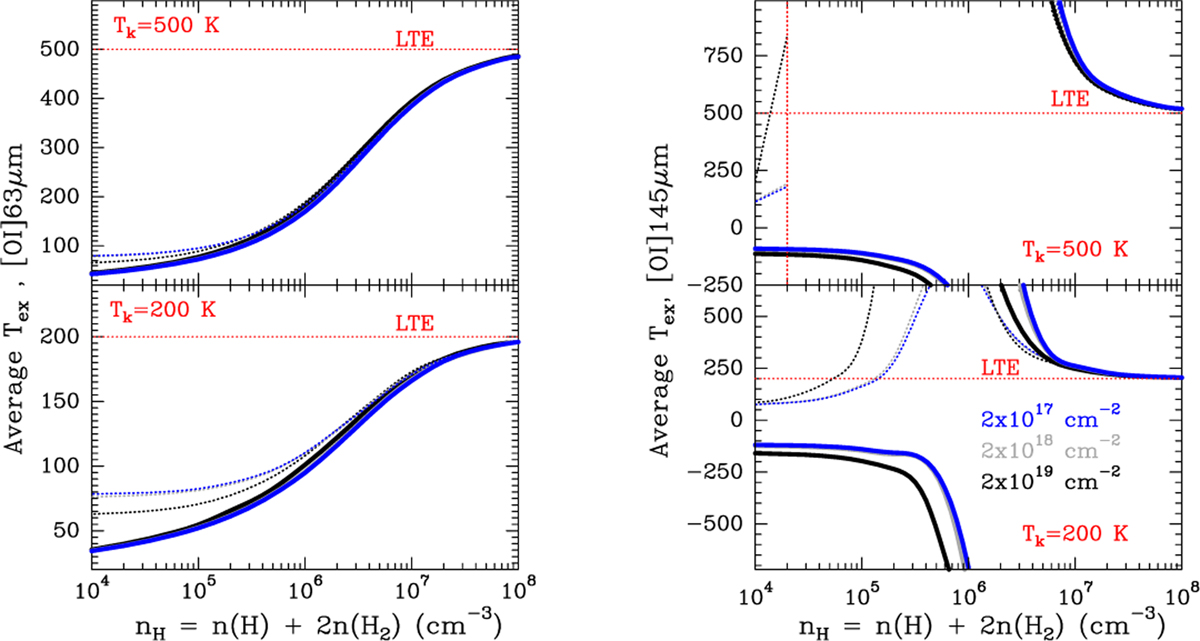
Fig. C.2
Download original image
Average excitation temperature of the [O I] 63 µm and [O I] 145 µm lines as a function of gas density for two gas temperatures, 200 and 500 K. The black, grey, and blue curves represent different column densities of atomic oxygen, indicated in the right panel. Dotted curves represent models with external FIR illumination (see text). The increase in the [O I] 63 µm excitation temperature at low densities reflects the role of FIR pumping by a modified black body at Td = 100 K. This effect reduces the population inversion of the transition at 145µm at low densities.
Current usage metrics show cumulative count of Article Views (full-text article views including HTML views, PDF and ePub downloads, according to the available data) and Abstracts Views on Vision4Press platform.
Data correspond to usage on the plateform after 2015. The current usage metrics is available 48-96 hours after online publication and is updated daily on week days.
Initial download of the metrics may take a while.