


Fig. B.1.
Download original image
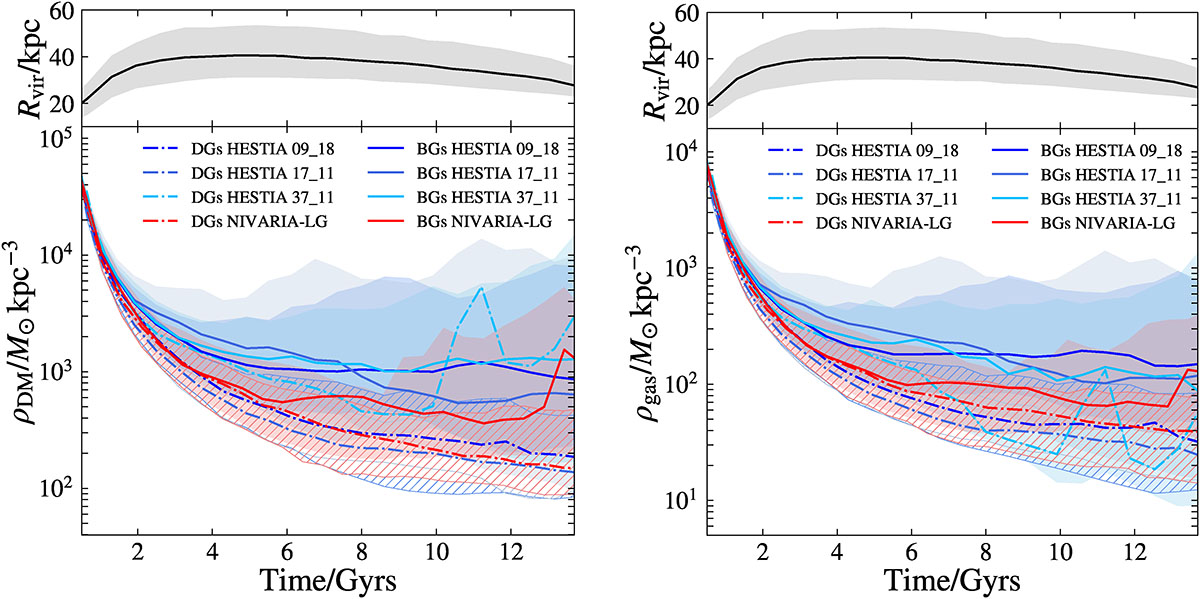
Evolution of median DM (left bottom panel) and gas (right bottom panel) density of the environment around dark and bright galaxies. Dark galaxies are shown as dotted-dashed lines, and bright galaxies as solid lines. Each colour represents a different simulation, blue shades for HESTIA and red for NIVARIA-LG. The shaded and striped backgrounds are the regions limited by the 16th and 84th percentiles of the distributions. The environment is defined as a spherical shell between 1 Rvir and 7 Rvir of each halo at each time. The evolution of the median Rvir of all dark and bright galaxies is shown in the top panels as a solid black line, along with the 16th and 84th percentiles as a shaded region.
Current usage metrics show cumulative count of Article Views (full-text article views including HTML views, PDF and ePub downloads, according to the available data) and Abstracts Views on Vision4Press platform.
Data correspond to usage on the plateform after 2015. The current usage metrics is available 48-96 hours after online publication and is updated daily on week days.
Initial download of the metrics may take a while.