


| Issue |
A&A
Volume 710, June 2026
|
|
|---|---|---|
| Article Number | A11 | |
| Number of page(s) | 19 | |
| Section | Extragalactic astronomy | |
| DOI | https://doi.org/10.1051/0004-6361/202558597 | |
| Published online | 28 May 2026 | |
NGC 3521 as the Milky Way near-twin: UV–radio-decameter spectral energy distribution
1
Main Astronomical Observatory of the NAS of Ukraine, 27, Akademik Zabolotnyi St., Kyiv 03143, Ukraine
2
Institute of Radio Astronomy of the National Academy of Sciences of Ukraine, 4, Mystetstv St., Kharkiv 61002, Ukraine
3
International Center for Astronomical, Medical, and Ecological Research, National Academy of Sciences of Ukraine, 27, Akademik Zabolotnyi St., Kyiv 03123, Ukraine
4
Institute of Astronomy, V.N. Karazin Kharkiv National University, 35, Sumska St., Kharkiv 61022, Ukraine
5
Instituto de Astrofísica de Canarias (IAC), Tenerife, Spain
★ Corresponding authors: This email address is being protected from spambots. You need JavaScript enabled to view it.
; This email address is being protected from spambots. You need JavaScript enabled to view it.
; This email address is being protected from spambots. You need JavaScript enabled to view it.
Received:
16
December
2025
Accepted:
1
April
2026
Abstract
Context. Milky Way analogs (MWAs) are defined on the basis of structural, kinematic, and global physical parameters. Our advanced approach to searching for MWAs also includes principal features of the Milky Way (MW) such as its isolated position in the local cosmic web, absent or weak nuclear activity, and the low mass of the supermassive black hole. We highlight the suggestion that the spectral energy distribution (SED) shape and properties such as star-formation rate and stellar and dust masses should be similar within the expected parametric scatter for MW and MWAs, which are on the same co-evolutionary cosmological scale. However, constructing a reliable SED reference of MWAs remains challenging due to heterogeneous photometry and the lack of constraints across the overall spectral range. NGC 3521 is one of the closest known MWAs and an excellent candidate for extending SED-based similarity criteria.
Aims. We aim to construct a homogeneous, aperture-photometry-based SED of NGC 3521 from the UV to the radio decameter range and to assess whether the integrated SED can serve as an additional indicator for the search for and validation of MWAs.
Methods. We report the SED model for NGC 3521 based on the measurements across the UV to radio wavelength ranges, exploiting, for the first time, both the data in the decameter range and aperture photometry for GALEX, SDSS, WISE, Spitzer/MIPS, Herschel/PACS, SPIRE, and VLA images. To constrain the decameter emission and derive an upper limit in the 24–32 MHz band, we present observational data obtained in January and February, 2022 using the Ukrainian T-shaped radio telescope (UTR-2). The observed SED was modeled with CIGALE, in which we developed a radio prescription (radio_extra) module that accounts for emission and absorption effects in the radio meter and decameter domains. The nuclear activity of NGC 3521 was analyzed with ZTF and NEOWISE archival data for the 2014–2025 period.
Results. The SED measurements contain 27 photometric points. The preferred SED model from UV-to-decameter ranges yields M★ ≃ 6.0 × 10¹⁰ M⊙, SFR ≃ 1.65 M⊙ yr−1, Mdust ≃ 1.3 × 10⁸ M⊙, and an effective dust temperature of ∼23 K. We found genuine variability of the NGC 3521 central region. The optical trends, measured with ZTF point-spread-function-fit photometry on a seeing-limited scale of ≲3″ (full width at half maximum), primarily trace the compact nuclear region and are consistent with a variable nuclear continuum superimposed on a relatively stable stellar component. The same behavior is observed in the mid-IR, but due to the larger effective scale of the NEOWISE point-spread-function-fit photometry (∼7.5″) it reflects a combination of nuclear variations and the contribution of warm dust in the central region.
Conclusions. Considering NGC 3521 as the MW near-twin galaxy, we present, for the first time, its SED model from UV-to-radio decameter ranges. We show that the integrated SED, especially when extended below 100 MHz, provides a complementary, physically motivated diagnostic. We demonstrate that the SED’s model of our Galaxy and NGC 3521 are similar, with the most noticeable residual offsets occurring in the far-UV and near the far-IR dust peak. The decameter constraint provides an upper limit log Lν(28 MHz)≈30.19 of the spectral luminosity at 28 MHz, which is consistent with the extrapolated luminosity of a MW of log Lν(28 MHz ≈ 30.17 placed at 10.7 Mpc. An exceptional consistency of SED shapes of our Galaxy and NGC 3521 allows us to conclude that SED shape may serve as an additional indicator in the search for MWAs. In turn, it helps to extrapolate how MW properties appear to an extragalactic observer.
Key words: techniques: photometric / galaxies: fundamental parameters / galaxies: general / galaxies: photometry / galaxies: individual: NGC 3521
© The Authors 2026
 Open Access article, published by EDP Sciences, under the terms of the Creative Commons Attribution License (https://creativecommons.org/licenses/by/4.0), which permits unrestricted use, distribution, and reproduction in any medium, provided the original work is properly cited.
This article is published in open access under the Subscribe to Open model. This email address is being protected from spambots. You need JavaScript enabled to view it. to support open access publication.
1. Introduction
NGC 3521 is a nearby spiral flocculent galaxy in the constellation Leo (RAJ = 11h05m48.8s, DecJ = −00° 02′13″, a visible diameter of ≈26 kpc, an angular size of ≈10′, and z = 0.002672). The morphological type SAB(rs) of this galaxy, according to the de Vaucouleurs classification, implies the existence of an intermediate bar, a faint inner ring, and spiral arms that are moderately to weakly loose. Its nuclear emission is consistent with a composite star forming (H II) and low ionization nuclear emission regions (LINER) (Das et al. 2003; Pastoven et al. 2024). Due to its high inclination angle (i = 72.7°), subtracting the diffuse, non-star-forming background emission is more complicated, which can affect the inferred relations, especially on spatial scales larger than 8 arcseconds (Liu et al. 2011).
One of the first dynamical analyses of NGC 3521 by Burbidge et al. (1964) reveals rotation curve parameters and a mass from the Hα and [N II] emission lines of ≈8 × 10¹⁰ M⊙ within ∼170″ of the center. Later, Casertano & van Gorkom (1991) verified that the rotation curve declines toward the galaxy’s outskirts. Photometric observations by Dettmar & Skiff (1993) indicated that this behavior at low surface brightness levels may suggest a past interaction or minor merger. Further spectroscopic studies confirmed kinematic asymmetries and the presence of counter-rotating stellar and gaseous components along both major and minor axes (Zeilinger et al. 2001), which can be interpreted within the framework of an axisymmetric dynamo scenario, where density waves generate spiral magnetic fields with a radial component contributing up to 40–60% of the azimuthal field (Knapik et al. 2000). Over the last few decades, NGC 3521 has been included in many multiwavelength sky surveys and has also been observed individually to obtain more precise parameters. This allows for the construction of its spectral energy distribution in a wide spectral range (see Sect. 2).
Since the seminal work by de Vaucouleurs & Pence (1978), the basic structural and photometric parameters for the search for the Milky Way analogs (MWAs) were adopted (morphology, size, bar and bulge sizes, isophotal and effective radii, luminosity in the B-filter, optical color, inner ring, etc.). Later on, parameters of our Galaxy including stellar mass, star formation rate, bulge-to-disk ratio, bulge-to-total ratio, disk scale length, and rotation velocity were considered in various combinations altogether with structural and photometric parameters (e.g., Mutch et al. 2011; Licquia et al. 2015; Fraser-McKelvie et al. 2019; Boardman et al. 2020b,a; Tuntipong et al. 2024) to compile a list of MWAs. Pilyugin et al. (2019, 2023) found that the low metallicity at the periphery of the Milky Way (MW) can also serve as an indicator in the search for MWAs. In fact, these authors exploited a minimal set of parameters when selecting MWAs by key indicators such as stellar mass, rotation curve, metallicity, and so on.
We considered as many parameter-indicators of galaxies belonging to the MWA class as possible. The more the parameters of the selected MWA galaxy coincide within a certain spread of the same parameters of our Galaxy, the more confidently we can speak of a multi-parametric offset and consider such an MWA galaxy to be an MW near-twin. In this context, we propose (Vavilova et al. 2024) that an advanced approach to searching for MWAs should also include the following principal features of the MW: its isolated position in the local cosmic web, the absent or weak nuclear activity, and the low mass of the supermassive black hole (SMBH). We adopted the isolation criteria proposed for catalogs of isolated galaxies by Karachentseva (1973) and Karachentseva et al. (2010) with some modifications for the 3D cosmic web (Dobrycheva et al. 2025; Kompaniiets et al. 2025a). We verified the type of spectral activity of NGC 3521 as a LINER (Kompaniiets et al. 2025a) using the Baldwin–Phillips–Terlevich (BPT) diagnostic diagram (Baldwin et al. 1981; Kewley et al. 2001; Kauffmann et al. 2003; Schawinski et al. 2007). The SMBH mass is 2.6 × 10⁶ M⊙ (Zhang et al. 2009), estimated by the Sérsic index relation (Graham & Driver 2007).
The galaxy NGC 3521 (=KIG 461) is classified as an isolated system according to the Catalog of Isolated Galaxies criteria (Karachentseva 1973). NGC 3521 belongs to the diffuse, elongated Leo Spur structure of the Local Volume, together with the systems surrounding NGC 3115 and NGC 2784 (Kourkchi & Tully 2017). In analyzing the Subaru Hyper Suprime Camera data, Müller et al. (2025) discovered new candidates to the dwarf satellites around NGC 3521, pointing out their similar luminosity function to that of the MW. Karachentsev et al. (2022) identified four new low-surface-brightness satellites around NGC 3521 using The Dark Energy Camera Legacy Survey (DECaLS) imaging, covering a projected area of 750 × 750 kpc. Their estimates of the total mass, MT = (0.90 ± 0.42)×1012 M⊙, and the mass-to-light ratio, MT/LK = (7 ± 3) M⊙/L⊙, together with the declining rotation curve (Dettmar & Skiff 1993), indicate a relatively shallow potential well and a low-mass dark halo.
The MW can be considered to have been an isolated galaxy for at least 7–10 Gyr during its evolution. The last major merger of our Galaxy with Gaia–Sausage–Enceladus was at z ≈ 2 (see the results of the high-resolution N-body simulations by Naidu et al. 2021). As for the possible collision of the MW–M31 system, Sawala et al. (2025) demonstrated that the neighboring small galaxies M33 and the Large Magellanic Cloud (LMC) can make this merger less likely because the LMC orbit runs perpendicular to the orbit of the MW–M31 system. No less critical here is the fact of more precise distance moduli (Di Valentino et al. 2025; H0DN Collaboration 2026) and dynamic (masses) data for Local Group galaxies and the MW–M31 orbital geometry (Elyiv et al. 2020; Banik et al. 2022), the position of the Local Void lying adjacent to the Local Group, and the MW moving away from this void (Tully & Fisher 1987; Lindner et al. 1995; Mazurenko et al. 2024). The TNG50 simulations of the Magellanic Clouds’ analogs show that such systems may form through distinct processes (Haslbauer et al. 2024). Recent Gaia DR3-based studies provide new constraints on the MW kinematics; the spatial orientation of the local velocity ellipsoids indicates departures from a simple axisymmetric disk (Dmytrenko et al. 2025), while an independent analysis of Gaia DR3 red giant branch stars delivers an updated Galactic rotation curve and suggests azimuth-dependent variations at large radii (Fedorov et al. 2025).
The physical parameters of NGC 3521 and NGC 3115 are often compared with those of the MW–M31 system. We studied the location of NGC 3521 within the local 3D cosmic web (Kompaniiets et al. 2025a) and concluded that the environmental densities of NGC 3521 and the MW are comparable. The projected surface density derived with the Voronoi tessellation method is ≈0.7 gal Mpc−2, while the fifth-nearest-neighbor estimator yields ≈0.4 gal Mpc−2. In comparison, the MW has an environmental density of Σ5 ≈ 0.13 gal Mpc−3, when estimated with the fifth-nearest-neighbor method after excluding dwarf companions such as the Magellanic Clouds.
The comparable baryonic mass, disk scale length, and rotation curve allowed Mast & Díaz (2006) and McGaugh (2016) to suggest the similarity between NGC 3521 and the MW. Pilyugin et al. (2023) confirmed this similarity by considering oxygen abundance gradients and kinematic profiles. Earlier, the asymmetries in the outer stellar and gaseous distributions along the major axis were revealed by Vila-Vilaro et al. (2015) based on the data of CO and H I observations. The IFU observations with VIRUS-W by Fabricius et al. (2015) and subsequent modeling by Coccato et al. (2018) explained the counter-rotating stellar components, for example elevated velocity dispersion in the bulge and slower central rotation relative to the disk. They identified three main stellar populations: an old (≳7 Gyr), an intermediate-age (∼3 Gyr ago, formed during a secondary star formation burst or merger event), and a young (≲1 Gyr, associated with recent disk activity) population.
In the context of our advanced approach (Vavilova et al. 2024), we support the suggestion that SED shape and global physical properties, such as the star-formation rate, M★, and Mdust should be similar within the expected parametric scatter for the MW and MWAs, which are at the same co-evolutionary cosmological scale. To verify this, we first selected NGC 3521 as the nearby isolated galaxy with SB morphology, which has similar structural and physical parameters and a similar HII/LINER nuclear activity, rotation curve, and metallicity. Importantly, this galaxy has a satisfactory series of multiwavelength observations from X-ray-to-radio meter ranges. All this makes NGC 3521 an ideal candidate for SED modeling and verifying our suggestion. Second, we decided to supplement this series with our own observations in the radio decameter range. Finally, we exploited homogeneous aperture photometry for broad-band SED measurements. We applied the CIGALE software to construct an SED model. This allowed us to derive global properties of its star-dust evolutionary history for comparison with the SED shape and global properties of the MW. By analyzing the SEDs of MWA twins, we obtained an additional astro-information channel for the SED of our Galaxy.
Zibetti & Groves (2011) analyzed the SED of NGC 3521 in pixels of seven nearby galaxies, including NGC 3521, in the optical and infrared (IR) ranges. NGC 3521 proved to be the most anomalous; its SED shows high variability on small scales, suggesting a complex relationship among star formation, stellar age, and dust distribution parameters. The SED of NGC 3521 galaxy was modeled by Dale et al. (2012) in the IR bands, Brown et al. (2014) from the UV to mid-IR, Hunt et al. (2019) from the FUV to sub-millimeter range, Chang et al. (2020) from the IR to sub-millimeter range, and Pastoven et al. (2024) from the UV to radio centimeter range; it was also included in the DESI Siena Galaxy Atlas by Moustakas et al. (2023). Pastoven et al. (2024) performed a preliminary analysis of flux radiation from the central region of NGC 3521 and constructed a baseline model describing its emission from the UV to radio centimeter ranges.
Our research aims to construct an SED model for NGC 3521 across the UV-to-radio wavelength ranges, exploiting, for the first time, both decameter-range data and aperture photometry across all wavelength ranges. Throughout this article, we distinguish between (i) the observed UV-to-radio SED, constructed from homogeneous photometric measurements; and (ii) the physical parameters inferred from it via SED modeling. While the measured SED is model-independent, the derived quantities (e.g., M★, SFR, Mdust) depend on assumptions about the star formation history, dust attenuation and emission, and energy balance (as implemented in CIGALE). We therefore used SED fitting primarily as an interpretative layer, to place the MW–NGC 3521 SED comparison into a physical context.
The broader goal of this work was to connect the integrated UV-to-radio SED of MW analogs with their evolutionary state. By constructing a homogeneous UV-radio decameter SED for NGC 3521, we provide a first benchmark for testing SED-level similarity; and in this case study we illustrate which parts of the UV-to-radio decameter SED exhibit the most prominent offsets between the MW and an MW near-twin.
We describe the multiwavelength data sources for SED models in the UV-to-radio decameter ranges as well as the X-ray data in Sect. 2. The aperture photometry in the decameter range, including the specificity of observations and sensitivity measurements, is justified in Sect. 3 and Appendix B. Aperture photometry–including measurement technique, flux conversion, and extinction correction, performed for CIGALE across UV-to-radio ranges–is presented in Sect. 5 and Appendix C. The results on SED model covering UV-to-radio decameter ranges are given in Sect. 5.2. Nuclear emission behavior and luminosity curves based on the ZTF data are analyzed in Sect. 6. The photometric extraction, angular resolution, and PSF-related considerations for ZTF and NEOWISE data are described in Appendices D.1 and D.2, respectively. The multiwavelength properties of NGC 3521, as follows from the SED modeling, are discussed in Sect. 7, and conclusions are in Sect. 8.
2. Multiwavelength data sources for SED models
Our study of isolated galaxies at z < 0.1 confirms that they typically exhibit lower continuum luminosities in multiple bands compared to galaxies of similar stellar mass in denser environments–most notably in the radio continuum (Pulatova et al. 2023; Vasylenko et al. 2020; Vavilova et al. 2021, 2022; Kompaniiets 2023)–and, on average, show weaker nuclear activity than galaxies in denser environments (Volvach et al. 2011; Melnyk et al. 2015; Pulatova et al. 2015; Dobrycheva et al. 2018). However, our new results indicate that the X-ray luminosities of isolated galaxies hosting AGNs are not suppressed and are instead typical of Seyfert galaxies (Kompaniiets et al. 2023, 2025b). These trends complicate the assembly of homogeneous, truly panchromatic datasets for isolated systems (including MWAs) over the full spectral range. In this respect, NGC 3521 is an exceptionally well-covered case; extensive archival observations exist from the X-ray down to the meter-wave radio domain, while the decameter measurements are provided by our observations (see Sect. 2.2).
NGC 3521 has the LINER type of nuclear activity (Das et al. 2003; Pastoven et al. 2024) and the X-ray Eddington ratio as L0.3 − 8/LEdd = 2.2 × 10⁻⁷ (Zhang et al. 2009). For this reason, we did not use X-ray data to measure SED models; we analyzed nuclear activity separately (see Sect. 6).
2.1. UV to IR range
NGC 3521 has been included in several major sky surveys such as the THINGS (Walter et al. 2008), theJames Clerk Maxwell Telescope Nearby Galaxies Legacy Survey (Warren et al. 2010), SDSS (Ahn et al. 2012), the Spitzer Infrared Nearby Galaxies Survey (Kennicutt et al. 2003), and others. To obtain integrated fluxes from an aperture encompassing the entire galaxy, and to enable subsequent multiwavelength SED model analysis, we used the following calibrated FITS images retrieved from available public archives and surveys (Vavilova et al. 2020):
-
Ultraviolet (NUV and FUV) data from the GALEX All Sky Imaging Surveys (AIS; GR2/GR3, Morrissey et al. 2007)
-
Optical data from the Sloan Digital Sky Survey (SDSS DR17 Ahn et al. 2012)
-
Infrared data from the AllWISE Image Atlas (Wright et al. 2010), the Spitzer Infrared Nearby Galaxies Survey (SINGS; Kennicutt et al. 2003), and the Herschel Far-infrared and Submillimeter Photometry for the KINGFISH Sample of nearby Galaxies (Kennicutt et al. 2011).
2.2. Radio range
The estimates of flux density in the radio cm range were performed based on the data from the NRAO VLA Sky Survey (NVSS) at frequency f = 1.4 GHz (Condon et al. 1998). Fluxes at lower frequencies were taken from several works: NVSS at f = 750 MHz (Heeschen & Wade 1964), Molonglo Radio Telescope at f = 408 MHz (Large et al. 1981), Culgoora circular array at f = 60 and f = 80 MHz (upper limits; Slee 1995), and Clark Lake Radio Telescope TPT array at f = 57.5 MHz (Israel & Mahoney 1990).
To determine the multiwavelength spectral characteristics of NGC 3521 over as wide a range as possible, this galaxy was observed with the Ukrainian T-shaped Radio Telescope (UTR-2) in the decameter range at f = 28 and f = 20 MHz from January to February, 2022. UTR-2 is the world’s largest decameter radio telescope (Kharkiv region, Ukraine) with a maximum effective area of ≈140 000 m2, which is capable of operating in the frequency band from 8–32 MHz (Konovalenko et al. 2016). It was in active operation until February, 2022 (Albergaria et al. 2025).
3. Aperture photometry for NGC 3521 from the UV to radio centimeter range
3.1. Photometric system and measurements
Aperture photometry, which ensures consistent flux measurements across a wide range of wavelengths, particularly from the UV to the IR, poses challenges for nearby galaxies. We optimized our approach to encompass the full extent of NGC 3521 and derive flux densities across the UV–radio range within a standard aperture. The zero points were specified manually for each band: 22.5 mag for SDSS (u, g, r, i, z); 18.82 and 20.08 mag for GALEX (FUV, NUV); and 20.752, 19.569, 17.800, and 12.945 mag for WISE (W1–W4), respectively. The WISE magnitudes were additionally corrected from Vega to AB using the additive offsets of 2.699, 3.339, 5.174, and 6.620. For the FIR filters (Spitzer/MIPS and Herschel/PACS, SPIRE) and VLA data, the maps are provided in radiometric units (MJy sr−1, Jy pix−1, or Jy beam−1) and were converted to flux densities in millijanskys (mJy) through integration over the aperture.
We then performed homogeneous multiwavelength aperture photometry for SDSS (u, g, r, i, z), GALEX (FUV, NUV), WISE (W1–W4), Spitzer/MIPS (24, 70, 160 μm), Herschel/PACS (70, 100, 160 μm), Herschel/SPIRE (250, 350, 500 μm), and VLA L-band data. A common elliptical aperture with semiaxes of a = 250″ and b = 120″ was adopted to enclose the entire galaxy (see examples in Fig. 1). All photometric measurements were converted to flux densities on a common mJy scale.
 |
Fig. 1. Examples of multiwavelength images of NGC 3521 used for aperture photometry and SED construction: (a) GALEX NUV; (b) SDSS g band; (c) Herschel/PACS 160 μm; and (d) VLA L-band radio continuum. All panels show the same field of view (570″ × 570″) centered on the galaxy; the axes are angular offsets from the center in arcseconds. The color-scales are shown in commonly used map units, as labeled on each color-bar. For GALEX NUV, we converted the count-rate map to a band-integrated flux per pixel in erg cm−2 s−1 pix−1 using the standard GALEX photometric calibration and the effective band pass width; for the SDSS g-band, we display flux density per pixel (nanomaggies/pix); for PACS 160 μm, the map is shown in Jy/pix, and for the VLA L-band in Jy/beam. The pixel scale (and, for the VLA map, the beam size BMAJ × BMIN) is indicated in each image. To preserve faint emission while avoiding saturation in bright regions, all images are displayed with an inverse-hyperbolic-sine (asinh) stretch. The red ellipse marks the adopted isophotal aperture used for integrated flux measurements. |
3.2. Photometric pipeline
The photometric pipeline was built on top of publicly available Python astronomy libraries. In particular, we used AstroPy for FITS I/O, WCS handling, unit conversions, and pixel-to-sky transformations (Astropy Collaboration 2013, 2018); and Photutils for elliptical aperture photometry and mask generation (Bradley et al. 2016). Source detection and segmentation in the background-masked images were performed with SEP (the Python implementation of SExtractor; Barbary 2016), while foreground/source morphology refinements relied on functions from scipy.ndimage and scikit-image. Galactic extinction values were retrieved through astroquery.irsa (IRSA Dust service; Ginsburg et al. 2019), and for multi-instrument image alignment we exploited “reproject”.
Our own contribution was to integrate these components into a single end-to-end pipeline, to define uniform zero points and Vega→AB corrections for all filters, and to implement band-dependent aperture masks and FIR/radio unit conversions to mJy (for more details, see Appendix B, where flux density values conversion, background subtraction, extinction correction, and uncertainty estimation are described). Examples of multiwavelength images of NGC 3521 used for aperture photometry and SED models are presented in Fig. 11, and resulting flux density values are in Table 1.
Multiwavelength photometry data for NGC 3521 from UV to radio decameter ranges.
4. Aperture photometry of NGC 3521 in the radio decameter range
A detailed description of the technical specifications and sensitivity measurement and peculiarities of observations with UTR-2 telescope is provided in Appendix A.
4.1. Data processing
Figure 2 (in the middle and bottom panels) shows the averaged two-day RA scans for DecJ = 0°, obtained from two sessions from Jan. 20–22 and February 3–5, 2022, at the West–East antenna of UTR-2 radio telescope in the 24–32 MHz band with integration time 30 s. The spatial resolution is ≈40′×10°. The map in the upper part of Fig. 2 is given in RA–Dec terms. However, with some reservations, it can also be said that the resolution is about 10deg in galactic latitude in cases where the fixed antenna beam passes parallel to the galactic plane due to the daily rotation of the Earth. The significant difference between scans is due to markedly different levels of radio-frequency interference (Appendix A) during observations in January, 2022 (middle panel) and February, 2022 (bottom panel). Furthermore, the RFI peaks are observed at different times due to a daily time shift (4 minutes earlier each day) in the scan time for each RA position, which is particularly noticeable when the scans are separated by half a month.
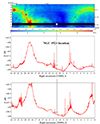 |
Fig. 2. Upper: Map of nonthermal Galactic-radio-emission distribution (in terms of brightness temperatures TB), obtained at UTR-2 for 20 MHz (Sidorchuk et al. 2021). The horizontal black strip schematically represents the Galaxy’s intersection in the UTR-2 sky scans at DecJ = 0°. A white square indicates the position of NGC 3521. Middle: Averaged scan for Jan. 20–22, 2022 (daily sequence of total signal power changes at antenna output); 24–32 MHz band; integration time 30 s. Bottom: Averaged scan for Feb. 3–5, 2022; 24–32 MHz band; integration time 30 s. |
From the upper part of Fig. 2, it is evident that the direction toward the NGC 3521 galaxy corresponds to areas of intermediate brightness temperatures of the Galactic background of about 20 000–40 000 K (Sidorchuk et al. 2021). In the middle and bottom panels of Fig. 2, one can see numerous discrete sources that fell into the West–East antenna beam during the scanning of the celestial sphere at DecJ = 0°. We note the distant powerful sources: radio galaxies 3C 348 (Hercules A, D ≃700 Mpc) and 3C 353 (D ≃ 470 Mpc). Peaks are clearly recorded at RAJ = 16h 51m 08.1s and RAJ = 17h 20m 28.2s. The relative power of these peaks, after conversion into flux densities, corresponds to more than 100 Jy. These two radio sources were previously confidently observed at decameter wavelengths and included in the UTR-2 catalog (Braude et al. 1979).
Figure 3 shows a part of the averaged RA scan corresponding to NGC 3521 coordinates. From the obtained raw data, RA scans were implemented for the West–East antenna of UTR-2 (“knife” beam; resolution by RA × Dec is about of 40′×10°) relative to the central frequency of 28 MHz (averaging band 8 MHz). The peak with a relative power of 0.022 dB corresponds to NGC 3521. Unfortunately, such a weak signal-to-noise ratio does not meet the 3σ criterion. The observational data were analyzed, particularly in the 16–24 MHz band, but the level of fluctuations is much higher. The reason is that the scan distortion caused by narrow-band, low-intensity RFI was included in the averaging. We also determined that the negative contribution to the obtained time sequences is made by the back diffraction side lobe of powerful radio emission from the Cassiopeia A supernova remnant at the coordinate RAJ = 11h 19m 00s. It is received with a relative power of 0.36 dB at 28 MHz, which corresponds to the flux density of 190.83 Jy (Fig. 4). This significantly affects the data quality in the scan. These points may explain why the NGC 3521 galaxy was not detected during the Decameter Sky Survey of the Northern Sky with the UTR-2 telescope in the late 1970s (Braude et al. 1979).
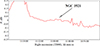 |
Fig. 3. Part of the time sequence relative to the coordinates of NGC 3521 on the scan averaged over Jan. 20–22 and Feb. 3–5, 2022, obtained at the West-East antenna of the UTR-2 radio telescope for 24–32 MHz band; integration time 30 s. |
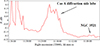 |
Fig. 4. Part of the time sequence for the back diffraction side lobe of Cassiopeia A on the scan averaged over Jan. 20–22 and Feb. 3–5, 2022, obtained at the West-East antenna of the UTR-2 radio telescope for 24–32 MHz band; integration time 30 s. |
To reach the 3σ criterion for detection of such a weak signal from NGC 3521, it was planned to follow observations 1) relative to the declination DecJ = 0° during March, 2022; 2) with use of the high-quality data with the North–South antenna; 3) with the implementation of the hardware multiplication of both antennas’ signals, which would allow us to obtain the data with high spatial resolution in the synthesized “pencil” beam mode. Unfortunately, these observations were interrupted (Albergaria et al. 2025). Additionally, despite the sufficiently high sensitivity achieved, the strong, nonthermal Galactic background and the strong nonthermal radio emission of Cassiopeia A in the diffraction lobes require much greater sensitivity, which could be achieved by averaging a much higher number of daily scans. It would be advisable to use the data obtained at other decameter radio telescopes equipped with aperture synthesis and digital-phasing systems (e.g., LOFAR LBA, NenuFAR, and others) for these purposes.
4.2. Flux density values of NGC 3521 in radio decameter range
Due to the insufficient sensitivity for unambiguous detection of the signal from NGC 3521 in the decameter range for the reasons stated above, it is possible to estimate the upper limit on the flux density of NGC 3521 based on the relative power of peak 0.022 dB. The flux density is determined as
![Mathematical equation: $$ \begin{aligned} S_{\nu } =\int _{\Omega } B_{\nu }(T) d\Omega&= \frac{2 k T \nu ^2}{c^2} \cdot \Omega \; [\mathrm{W} \cdot \mathrm{m} ^{-2} \cdot \mathrm{Hz} ^{-1}]. \end{aligned} $$](/articles/aa/full_html/2026/06/aa58597-25/aa58597-25-eq1.gif) (1)
(1)
At decameter wavelengths, the antenna temperature, ΔTA, recorded by the receiver is dominated by the brightness temperature of the Galactic background. The detected power therefore represents the excess of the Galactic background brightness temperature over the contribution from the discrete source. Converting 0.022 dB into linear units (1.00508) gives ΔTA = (1.00508 − 1)⋅TB = 101.6 K, which corresponds to a flux density of  Jy (in Flux density units). Thereafter, the upper limit on the flux density of NGC 3521, obtained with UTR-2, for a frequency 28 MHz at Δf = 8 MHz and Δτ = 30 s, will be 11.22 Jy. Substituting the obtained value of the upper limit on the flux density and the solid angle of NGC 3521 into formula (1), we can estimate the brightness temperature of NGC 3521 through Bν(T). The solid angle subtended by NGC 3521 was estimated from its projected linear diameter of 25.9 kpc, adopting a distance of 10.7 Mpc (Warren et al. 2010) and an inclination angle of 72.7°. This gives Ω = 1.37 × 10⁻⁶ sr. So, we obtain Bν(T) = 8.19 × 10⁻²⁰ W ⋅ m−2 ⋅ Hz−1 ⋅ sr−1 and T = 31.800 K at 28 MHz.
The noise level for Δf = 8 MHz and Δτ = 30 s is equal to σ = 6.4 ⋅ 10−5. We considered this value as 1σ for 1 Jy. This 1σ value for the obtained upper limit on the flux density at 28 MHz of 11.22 Jy would correspond to 0.00072 Jy (11.22 Jy ± 0.00072 Jy). However, these are purely statistical uncertainties that can be neglected. Much more significant are the systematic errors, including calibration uncertainties (up to 5%) and baseline fluctuations in the scans (typically up to 5%). Nevertheless, these values should not be taken as being exact; these errors apply only to the upper limit of the flux density, which was determined by our measurements in the decameter range.
5. Spectral energy distribution model of NGC 3521 from UV to radio decameter ranges
In this section we discuss how we derived physical properties of NGC 3521 from SED measurements using CIGALE. We emphasize that, unlike the observed photometric SED points, these inferred parameters are model dependent and reflect the adopted set of templates and priors (e.g., star formation history, attenuation law, dust emission model, and energy-balance assumption). They help to translate overall SED shape and normalization into a compact set of physical descriptors (SFR, M★, Mdust, etc.) that can be compared to the SED measurements performed by other authors and to the MW data.
5.1. Numerical simulations of the SED with CIGALE
To model and analyze the observed SED of NGC 3521, we used the CIGALE code (Boquien et al. 2019). We provide a detailed description of the selection of the baseline model and the choice of input parameters across the UV–radio centimeter range in C. The simulations were based on a combination of physically motivated modules, which are summarized in Table 2, along with the input parameters used to generate the model grid.
Parameter grid adopted for the CIGALE SED modeling from UV to decameter ranges.
We chose a delayed star formation history with an optional burst or quenching episode (sfhdelayedbq), which is expressed as SFR(t)∝texp(−t/τ), where τ is the e-folding timescale. The stellar emission was computed using the stellar population synthesis models of Bruzual & Charlot (2003), assuming a Chabrier initial mass function (Chabrier 2003) and approximately solar metallicity. Nebular emission, including both line and continuum components, was incorporated following Inoue (2011) and assuming a zero-escape fraction of Lyman-continuum photons. Dust attenuation was described using the modified Calzetti starburst law (dustatt_modified_starburst; Calzetti et al. (2000); allowing for variations in the UV bump amplitude and in the power-law slope of the attenuation curve. The absorbed energy was reemitted in the infrared following the dust emission models (dl2014; Draine & Li 2014), which accounts for the emission of polycyclic aromatic hydrocarbons (PAHs) and large grains heated by a distribution of radiation field intensities.
The standard CIGALE radio module implements a single non-thermal power law anchored to the FIR–radio correlation via the qIR parameter, assuming that the 1.4 GHz continuum is dominated by synchrotron emission with a fixed slope (Helou et al. 1985; Boquien et al. 2019). However, below ν ≲ 100 MHz, the integrated radio spectra of galaxies typically deviate from a pure power law. Namely, curvature and/or turnovers appear due to propagation and radiative-transfer effects in the ionized interstellar media (e.g., free–free absorption and possible synchrotron self-absorption). Observationally, global spectra show systematic low-frequency flattening and occasional turnovers, implying frequency-dependent opacity and multicomponent synchrotron populations (Condon 1992; Lacki 2013; Marvil et al. 2015; Chyży et al. 2018). To consistently model these effects within the SED energy-balance framework, we developed and implemented an extended radio module, “radio_extra”2, which retains the radio stock module but adds physically motivated low-frequency behavior.
Our radio_extra module retains the star-forming (SF) synchrotron and optional AGN power-law terms of the stock CIGALE radio module. We added the following elements to this baseline:
-
(i)
A low-frequency (LF) component represented by a broken power law in Lν with slopes of αlf (below the break) and αsf (above the break). They are joined at a user-set break frequency of νbreak. Its amplitude at the break is specified as a fraction, Alf, of the SF Lν at νbreak. This term mimics extended/aged ISM populations that preferentially shape the spectrum at ν ≲ νbreak and reproduces the observed low-frequency curvature of integrated spectra (Lacki 2013; Marvil et al. 2015; Chyży et al. 2018).
-
(ii)
A frequency-dependent free–free-like absorption screen applied multiplicatively to all radio components (SF+LF and, if present, AGN), parameterized as
 with a canonical βff ≃ 2.1 for homogeneous ionized gas. The emergent spectrum is attenuated by exp[−τff(ν)] (Draine 2011; Rybicki & Lightman 1979). Internally, all components are computed in Lν(ν) on a wide grid (10 nm–100 m), which was converted to Lλ(λ) for CIGALE. The SF terms are scaled by Ldust.
5.2. Main parameters of NGC 3521 from SED
The main parameters of the galaxy were estimated from the observational SED through comparison with a theoretical model. The total stellar luminosity is L★ = (7.59 ± 0.38)×1010 L⊙. In our two-component stellar population model, this luminosity is represented as the sum of the old and young stellar components listed in Table 1. The old stellar component contributes L★, old = (5.47 ± 0.27)×1010 L⊙, while the young stellar component contributes L★, young = (2.12 ± 0.11)×1010 L⊙. The integrated dust luminosity reaches Ldust = (2.66 ± 0.13)×1010 L⊙, and the associated dust mass is Mdust = (1.26 ± 0.14)×108 M⊙, revealing a massive dust reservoir that can reprocess a large fraction of a stellar emission. The total stellar mass inferred from the Bayesian analysis is M★ = (5.99 ± 0.30)×1010 M⊙. This mass is dominated by the old stellar population, which contributes M★, old = (5.89 ± 0.29)×1010 M⊙. The resulting star formation rate from the delayed-τ star formation history is SFR = 1.65 ± 0.08 M⊙ yr−1, in agreement with the main-sequence activity of massive late-type spirals. Given the derived dust luminosity and mass, The effective dust temperature is estimated using the standard scaling of the infrared luminosity-to-mass ratio for optically thin modified blackbody emission (Hildebrand 1983; Draine 2003; Casey 2012),  , where β = 2 is adopted for the emissivity index of interstellar dust.
The measured ratio of Ldust/Mdust ≃ 2.1 × 10² L⊙/M⊙ corresponds to an effective dust temperature of Tdust ≃ 23 K. This value is typical for the diffuse dust in normal star-forming spiral galaxies. In summary, these findings suggest that NGC 3521 harbors a massive stellar disk in which star formation rates remain moderate and dust content is well measured, and which is in energy equilibrium with stellar radiation.
In CIGALE (Boquien et al. 2019), physical properties are inferred from the marginal posterior PDFs obtained over the explored model grid with likelihood weights of w ∝ exp(−χ2/2). We report the expectation values of these marginal PDFs and their associated dispersions.
The posterior PDFs provide the primary diagnostic of parameter constraints. For the main quantities discussed in this work – SFR, Mdust, Ldust, M★, L★ and the corresponding old/young components – the PDFs are single-peaked and maximize well within the explored parameter space, indicating that these parameters are meaningfully constrained by the UV-decameter SED coverage. The moderate widths of the SFR and Mdust PDFs are consistent with the expected coupling between recent star formation, attenuation, and dust heating/emission in star-forming spirals. In contrast, the mass-weighted stellar age (tM, ★) shows posterior probability accumulating toward the edge of the explored grid, implying that it is better interpreted as a one-sided constraint (a limit within the adopted model space) rather than as a tightly measured value. As an additional check, we inspected the χ2 projections across the grid to identify potential alternative low-χ2 regions; the interpretation of constraints is based on the marginal posterior PDFs.
6. Photometry of the central region of NGC 3521
6.1. X-ray data with Chandra
NGC 3521 was observed by Chandra in the 0.3–8 keV range. Grier et al. (2011) exploited these data to search for a hidden nuclear X-ray activity in spiral galaxies, which are optically normal ones. They found no clearly defined X-ray peculiarities in this galaxy. One of the noteworthy features of NGC 3521–the presence of the ultraluminous X-ray (ULX) source [SST2011] J110545.62+000016.2–was discovered by Heida et al. (2014) and further analyzed with the VLT X-shooter and Chandra data by López et al. (2015). This ULX is associated with an H II region located ∼138 pc northeast of the nucleus, with an X-ray luminosity of (1.9 ± 0.8)×1040 erg s−1.
The X-ray Eddington ratio for NGC 3521 was defined by Zhang et al. (2009) as L0.3 − 8/LEdd = 2.2 × 10⁻⁷. Given this value, log(MSMBH/M⊙) = 6.86 ± 0.58 (Davis et al. 2014), and the LINER activity type (Das et al. 2003; Pastoven et al. 2024), we did not use Chandra data when constructing SED model.
6.2. Color–magnitude relations and spectral indices
We analyzed active processes in the central region of NGC 3521, considering the photometric data obtained from the open archives of the Zwicky Transient Facility (ZTF; Masci et al. 2019) in three optical filters (g, r, i) and the NEOWISE data (Mainzer et al. 2014) in two infrared channels (W1, W2). These data cover the periods from 2018–2025 for ZTF and 2014–2024 for WISE.
After correcting for Galactic extinction, the multi-epoch photometry from ZTF (see D.1) and NEOWISE (see D.2) was consolidated to mitigate inter-filter timing offsets. However, the binning schemes differ due to the distinct observing cadences. For ZTF, we computed nightly averages using a sliding window of Δt ≤ 0.35 d to obtain quasi-simultaneous g/r/i measurements. For NEOWISE, we derived nightly means from single-exposure photometry by grouping exposures into integer “nights” via night_id = ⌊MJD + 0.82⌋, where the offset was chosen to minimize splitting of dense exposure clusters across adjacent days.
Variability amplitudes were quantified with a robust percentile range (95th–5th percentiles), Δm ≡ P95 − P05, which is less sensitive to outliers and occasional residual systematics than the full peak-to-peak spread. After the final quality screening and clipping, the optical bands showed amplitudes of Δg = 0.153 mag, Δr = 0.144 mag, and Δi = 0.120 mag, while the infrared bands yielded ΔW1 = 0.1608 mag and ΔW2 = 0.1568 mag.
Paired nightly measurements were then used to construct three color–magnitude relations: g − r versus g (Fig. 6a), r − i versus r (Fig. 6b), and W1 − W2 versus W1 (Fig. 6c). The uncertainty of each color index was computed via standard error propagation for independent measurement errors (Bevington & Robinson 2003). Because both axes of the color–magnitude diagrams contain measurement uncertainties, we applied York regression (York et al. 2004), which accounts for errors in both coordinates (including the covariance between magnitude and color). Overall, all three color–magnitude relations show a bluer-when-brighter (BWB) trend. The g − r versus g and W1 − W2 versus W1 relations exhibit high Pearson correlation coefficients (0.69 and 0.67), while the r − i versus r relation shows a moderate correlation coefficient (0.58) based on fewer paired nights (Fig. 6).
7. Discussion
7.1. Multiwavelength properties of NGC 3521
As noted in the introduction, the SED models of NGC 3521 were constructed in various spectral ranges by Hunt et al. (2019), Erroz-Ferrer et al. (2019), Chang et al. (2020), and Pastoven et al. (2024). As well, the flux densities were obtained by Dale et al. (2012) in 3.6–500 μm (Spitzer+Herschel data) using the dust model by Li & Draine (2001) and KINGFISH FIR/submillimeter photometry; by Brown et al. (2014), who prepared the atlas of SEDs from UV to mid-IR (GALEX+SDSS+2MASS+Spitzer+WISE) using MAGPHYS software and distance to NGC 3521 as D = 10.1 Mpc; and by Pattle et al. (2023) from the IR to the submillimeter range (Herschel+JCMT/SCUBA-2) for the construction of dust SED maps for nearby galaxies using D = 12.42 Mpc for NGC 3521. Compared with these studies, we modeled the SED of NGC 3521 not only in a wider spectral range–from UV to radio decameter wavelengths–but also through aperture photometry across all ranges. The latter is essential because most of the aforementioned works did not consider aperture photometry and used different distance estimates for NGC 3521 (Table 4). The most meaningful discrepancies between the assumed distances are as follows (Column 1): almost 40% larger in the MUSE Atlas of Disks by Erroz-Ferrer et al. (2019), where the authors took the distance from NED; and almost 30% smaller in the work by Chang et al. (2020), whose authors took it from the JCMT Nearby Galaxies Legacy Survey by Wilson et al. (2012). The stellar mass and SFR in Zibetti & Groves (2011) were taken from Skibba et al. (2011) for a distance of 9.2 Mpc; they are based only on the optical g and i bands and the NIR H bands according to the Zibetti et al. (2009) recipes.
To provide a uniform and self-consistent approach to data processing, we used photometrically calibrated FITS images spanning the UV–radio centimeter ranges (see Sect. 3 and Appendix 2) and radio meter and decameter band flux densities on a uniform scale. As well, to compare our results with those mentioned in Column 1, we recalculated the SFR and the stellar and dust masses after correcting to the same distance scale (D0 = 10.7 Mpc) using Q(D0) = Q(D)(D0/D),2 as suggested by Kennicutt et al. (2011). Such an approach was also applied by Hunt et al. (2019).
After rescaling to the common distance, the estimates of the global parameters show a better overall agreement. In particular, if the single most discrepant values are treated as method-dependent outliers, the remaining estimates are grouped within a relatively narrow range for all three quantities. For the SFR (Column 4), most values group around logSFR ≃ 0.22–0.29, while only the rescaled value of Skibba et al. (2011) is higher (logSFR = 0.46). We note that the authors derived the SFR independently of the Hα+24 μm combination. Therefore, this offset is more plausibly related to differences in the adopted SFR tracer and calibration, including different sensitivity to obscured star formation and to the timescale over which star formation is probed, rather than to a global inconsistency among the studies. The rescaled stellar mass estimates also agree reasonably well within ∼0.3 dex: log M★ spans 10.33–10.90 (Column 2), where our Models 1–2 yielded log M★ ≃ 10.76–10.78. For the dust mass, the rescaled values are remarkably consistent across independent analyses–with log Mdust ≈ 7.89–8.12 (Column 3)–and the estimate by Chang et al. (2020) becomes fully compatible.
A plausible explanation for the remaining outliers is that the published estimates are not based on identical observational constraints or on identical modeling assumptions. In particular, the stellar mass estimates depend on whether one uses a color–mass-to-light calibration or full SED fitting. The dust-mass estimates are especially sensitive to the availability and weighting of FIR/submillimeter constraints, as well as to the adopted dust emission prescription. The SFR estimates depend on the tracer itself and UV and far-IR energy-balance SED fitting.
We now compare the flux values adopted in our study (Table 1) with those from the works of Brown et al. (2014) and Pastoven et al. (2024). It reveals a systematic underestimation across the UV (GALEX) to near-IR (WISE) wavelength range. The deviation from the fluxes obtained in our work ranges from 34–66%. This difference is to be expected because Pastoven et al. (2024) performed photometry using a rectangular aperture of 235 × 56 arcsec, whereas our measurements employed an elliptical aperture with semiaxes of 250 × 120 arcsec that encompass the full extent of the galaxy (Fig. 1). We also obtained lower fluxes for Herschel/SPIRE 500 μm and Spitzer/MIPS 160 μm. This is consistent if we take into account that earlier photometry measurements were provided for a substantially larger aperture of 926 × 455 arcsec (Dale et al. 2012). All other flux values used by Brown et al. (2014) and Pastoven et al. (2024) agree with our measurements and lie within the confidence intervals derived in the present work.
We reconstructed the baseline SED model in the UV–radio 21 cm range by Pastoven et al. (2024) with minor adjustments to the grid parameters (Model 1 in Table 4; see Appendix 3, with Table C.1 and Fig. C.1) for comparison. It allowed us to reproduce the SED of NGC 3521 with high fidelity in this spectral domain. Extending it to the radio meter and decameter ranges resulted in more reliable estimates of the galaxy’s physical properties (Model 2 in Table 4), most notably its star formation rate and smaller uncertainties than Model 1. The total stellar luminosities in both models are similar, whereas Model 2 gives a more consistent result between luminosities of old and young stellar populations: L★, old = (5.51 ± 0.28)×1010 L⊙ and L★, young = (2.14 ± 0.11)×1010 L⊙, respectively. The derived estimates of dust mass constitute approximately 1% of the stellar mass, which is consistent with results from cosmological simulations of dust evolution in MWAs (McKinnon et al. 2016).
To place our results in the broader context of previous studies, we turn to the comparison of global parameters M★, Mdust, and SFR from SEDs given in Table 4. The range of stellar mass estimates is approximately 0.8 dex, ranging from log M★ ∼ 10.33 to 11.15. All studies agree on a massive, moderately star-forming spiral system. However, there are notable differences in the work of Erroz-Ferrer et al. (2019), the authors of which utilized UV–IR photometry from the MAD survey in conjunction with MUSE. We suggest that both the assumed distance (14.2 Mpc) and the specifics of stellar population synthesis in this range led to this result. For example, Mosenkov et al. (2019) worked with the data in the Herschel band and noted that surface density profiles for the dust mass have an obvious depletion in the inner galaxy region. They concluded that if this feature, together with the truncation in the galaxy outskirts, is not taken into account, the dust emission and dust mass density profiles look more or less exponential. Weak azimuthal variations in metallicity can play a definitive role (Grasha et al. 2022): the distribution of H II regions exhibits enhanced or depleted oxygen abundance. We also note that the majority of authors report log Mdust ∼ 7.9–8.1, and dust mass estimates are more consistent across studies. The inclusion of radio data through the radio_extra module, which more successfully limits synchrotron contamination and cold dust emission, is the main reason why our Model 2 produced the highest dust mass (log Mdust = 8.12). Pastoven et al. (2024) and Hunt et al. (2019) analyzed similar spectral ranges with different CIGALE implementations, and both found log Mdust = 7.93. Chang et al. (2020) found a slightly lower dust mass value of 7.65, but the authors considered missed warmer dust components, focusing only on the FIR to submillimeter range.
The SFR values, which range from log(SFR/M⊙ yr−1) = 0.22 to 0.47 (∼1.6–3.0 M⊙ yr−1), are also generally consistent, except for the slightly higher value reported by Erroz-Ferrer et al. (2019). An independent estimate was provided by Leroy et al. (2008), who combined UV data from GALEX, infrared data from Spitzer, and H I kinematic data from the THINGS survey to derive the SFR, stellar mass, and neutral-gas mass.. They derived SFR ≈ 2.1 M⊙ yr−1, a stellar mass of ∼5 × 10¹⁰ M⊙, and a neutral hydrogen mass of ∼1.4 × 10¹⁰ M⊙. Coccato et al. (2018), who used archival ESO and Spitzer data for a spectroscopic decomposition of NGC 3521, performed a separate analysis of the bulge and disk in terms of their kinematics, stellar ages, and metallicities. They concluded that NGC 3521 has a complex star formation history with three major episodes: an old stellar population (> 7 Gyr), an intermediate-age component (≈3 Gyr), and a young population (< 1 Gyr). The intermediate stellar population dominates both the galaxy’s stellar mass and luminosity.
Based on the results of our SED Model 2, the luminosity-weighted age of the stellar population is 5.00 ± 0.5 Gyr. Thus, while the “sfhdelayed” module does not reproduce the full complexity of the galaxy’s star formation history, it successfully captures the formation of the dominant intermediate-age population together with the young stellar component. As for the gas component, Elson (2014) discovered the presence of an anomalous HI region with a mass of MH I = 1.5 × 10⁹ M⊙ (20% of total HI mass) when analyzing the VLA “HI Nearby Galaxy Survey”. This diffuse, slowly rotating halo gas component (25–125 km/s), with a scale height of about 3.5 kpc, is located in a thick disk that coincides with the inner regions, where the star formation rate is highest. The authors concluded that it serves as a “galactic fountain” depositing gas from the galaxy’s disk into the halo. So, the estimates of SFR and stellar and dust masses obtained from our SED modeling across the UV–radio decameter range (Table 2) provide a reliable characterization of the key parameters and star formation history of NGC 3521.
7.2. Emission from the central region
As noted in Sect. 6, we did not include Chandra data in the SED model for the X-ray range, and we analyzed the nuclear emission of NGC 3521 separately. In addition to the archival survey data, the NGC 3521 was previously monitored with the Ukrainian Zeiss-600 telescope at the Terskol Observatory from 2021–2022, including a three-hour r-band sequence obtained on February 11, 2022 (Pastoven et al. 2024). Using ZTF (g, r, i) and NEOWISE (W1, W2) multi-epoch photometry, we detected statistically significant color–magnitude correlations (Fig. 6; Table 3), demonstrating genuine variability of the central emission component from 2014–2025.
Color–magnitude correlations and spectral parameters for NGC 3521.
Estimates of M★, Mdust and SFR for NGC 3521 for the distance D0 = 10.7 Mpc.
In a highly inclined, dusty host with a composite H II/LINER nucleus (see Sect. 1), PSF-integrated photometry is expected to be strongly diluted by host starlight and affected by internal reddening, naturally producing a red mean continuum while enhancing bluer-when-brighter (BWB) trends when a compact blue variable component is presented. The median optical spectral indices, αgr = 2.28 ± 0.02 and αri = 1.82 ± 0.06, confirm a red optical continuum within the ∼3″ ZTF PSF, whereas the mid-IR spectral index αMIR = −1.97 ± 0.01 is close to the Rayleigh–Jeans limit (α = −2 for Fν ∝ ν−α), implying that the integrated 3–5 μm emission within the 7.5″ WISE PSF is dominated by stellar continuum rather than hot-dust (torus) emission (Table 3). The negative spectral-index responses to brightening, dα/d(−g) = − 2.78 ± 0.34 and dα/d(−W1) = − 2.13 ± 0.37, quantify the BWB behavior and support a scenario in which a weak, intrinsically bluer nuclear continuum varies atop a comparatively stable, reddened host background.
Similar behavior has been observed in the center of our Galaxy, around the SgrA SMBH. The highest near-IR brightness of Sgr A* over 20 years, with up to 75-fold rapid flux variations over two hours, was recorded during observations with the Keck telescope (Do et al. 2019). According to JWST observational data from 2023–2024, correlated fluctuations were detected at wavelengths of 2.1 and 4.8 μm, with a phase shift between them, indicating several emission mechanisms near the event horizon (Yusef-Zadeh et al. 2025).
7.3. Twin SEDs of the MW and NGC 3521
The nearby NGC 3521 galaxy was first considered the MWA by McGaugh (2016) based on the compositions of the MW and NGC 3521 rotation curves, and later by Pilyugin et al. (2019, 2023), whose authors analyzed the metallicities of these galaxies. As mentioned in the introduction, NGC 3521 also shows other indicators suggesting an analogy with the MW. We suggest that NGC 3521 and the MW must also exhibit a similar UV–radio decameter SED, and we explicitly tested this using homogeneous aperture photometry.
The obtained SED parameters of NGC 3521 are comparable to those inferred for the MW:  (Fielder et al. 2021), SFR = 1.65 ± 0.19 M⊙ yr−1 (Licquia & Newman 2015). The derived stellar mass and SFR are comparable to modern estimates for the MW (Licquia & Newman 2015; Fielder et al. 2021). Additionally, when comparing the positions of NGC 3521 and the MW in the local cosmic web (Kompaniiets et al. 2025a). The parameters of their local density environments are similar. The spectral type of the nuclear activity is sufficiently low to indicate that it is a LINER (Das et al. 2003; Pastoven et al. 2024). This is consistent with the expected type of nucleus activity of our Galaxy in the past (Eckart et al. 2018; Ciurlo & Morris 2025). Thus, the close similarity of NGC 3521 to the MW across numerous parameters–including those highlighted in our paper (Vavilova et al. 2024)–makes it the most suitable candidate for constructing a reference SED of an MW like galaxy. A strict selection of MWAs according to these criteria, followed by detailed SED modeling, is essential for accurately reconstructing the Galaxy’s own SED. Such a study was performed by Fielder et al. (2021) with machine-learning techniques and a training sample of MWAs. However, their selection was based only on two global parameters–stellar mass and star-formation rate–which can bias the recovered SED of the MW. Many galaxies share comparable stellar masses and SFRs, but differ significantly in other key properties, for example their location in the cosmic web (denser environments, filaments, or voids), the presence or absence of a bar, and the level of nuclear activity. In turn, by applying isolation criteria, weak nuclear activity, and a small SMBH mass to achieve a more rigorous multiparameter selection of MWAs (Vavilova et al. 2024), we minimized these biases.
We constructed an SED of NGC 3521 over a wider spectral range, incorporating observational data from radio meter to decameter wavelengths (Table 1, Fig. 5). The weak flux densities of NGC 3521 in the radio-meter range were explained by Israel & Mahoney (1990) as the pervasive presence of a clumpy medium of well-mixed non-thermally emitting and thermally absorbing gas. For example, the ionization of an interstellar medium with an electron temperature of 500–1000 K and a clump density of 1 cm−3 can be maintained by OB stars. Such a gas in the MW would be located in the thick disk, mostly absent in the Galactic plane, and almost completely absent in the solar neighborhood”.
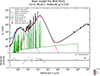 |
Fig. 5. NGC 3521 SED from UV to decameter ranges. |
To assess whether NGC 3521 can be considered an MWA or even a twin by various multiwavelength properties, including in the decameter range, we need to estimate the flux density that our own Galaxy would have if placed at a distance of 10.7 Mpc. For the frequency 28 MHz and background brightness temperature of 20 000 K, Bν(T) = 5.15 × 10⁻²⁰ W ⋅ m−2 ⋅ Hz−1 ⋅ sr−1. The solid angle that our Galaxy would subtend at a distance of 10.7 Mpc, assuming a linear size of 32.4 kpc, is Ω = 7.2 × 10⁻⁶ sr. If we take into account the orientation at inclination angle of 72.7°, the solid angle is Ω = 2.1 × 10⁻⁶ sr. So, we obtain a flux density of 10.8 Jy for the MW.
As can be seen, the upper limit on the flux density for NGC 3521 of 11.22 Jy at 28 MHz, and the expected flux density for our Galaxy of 10.8 Jy at 28 MHz if we place it at the same distance, are comparable and generally consistent. Thus, considering the estimated upper limits on the decameter flux density, the NGC 3521 galaxy can be regarded as similar to the MW in terms of flux density in the radio decameter range. This supports the classification of NGC 3521 as an MWA. Also, a comparison of the brightness temperatures of the Galactic background and NGC 3521 in the decameter range (20 000–30 000 K) further suggests that NGC 3521 lacks activity at its nucleus and is not a radio galaxy. Further studies of weak discrete radio sources at decameter wavelengths, with measured sensitivities up to several Jy, open a new window into the multiwavelength properties of MWAs and other galaxies.
Natale et al. (2022) derived an intrinsic, dust-corrected global SED of the MW using a self-consistent, 3D radiative-transfer (RT) model constrained by spatially resolved, all-sky surface-brightness data, rather than by a compilation of integrated fluxes. The geometry and amplitudes of the stellar and dust components were optimized by matching longitude and latitude profiles from the NIR to the submillimeter range in a stepwise manner, exploiting the near-orthogonality of parameters that dominate different wavelength ranges (mid-IR for the compact star-forming component, submillimeter for the diffuse dust column, NIR for the old stellar disk and bulge). As they wrote, the resulting intrinsic SED is decomposed into old and young stellar components, as well as diffuse and clumpy dust emission. Within this framework, the UV output is dominated by the thin (young) stellar disk, while the optical is dominated by the old stellar disk plus bulge; the old stellar disk contributes ∼46% of the total stellar luminosity. In the IR, the diffuse dust component dominates long wards of 50 μm and accounts for 81% of the total dust emission; overall, (16 ± 1)% of the stellar luminosity is absorbed by dust and reradiated in the IR or submillimeter range, with young stellar populations (thin + inner thin disks) providing 71% of the dust heating. The corresponding global parameters of the MW are SFR = 1.25 ± 0.2 M⊙ yr−1 (including SFRin-tdisk = 0.25 M⊙ yr−1), M★ = (4.9 ± 0.3)×1010 M⊙, sSFR = (2.6 ± 0.4)×10−11 yr−1, and Mdust = (4.78 ± 0.06)×107 M⊙.
We adopted the intrinsic SED model of the MW from Natale et al. (2022) as a reference for comparison with our SED model of NGC 3521. To place both systems on the same footing, we compared them in intrinsic luminosity space, plotting the SEDs as log10[λLλ(λ)/L⊙] (Fig. 7).
For the MW, the reference model of Natale et al. (2022) is provided as Lν. We converted it to λLλ = νLν and expressed it in solar luminosities, λLλ/L⊙, without applying any distance scaling. For NGC 3521, we converted the best-fit model flux density, Fν, to spectral luminosity using Lν = 4πD2Fν, adopting D = 10.7 Mpc, and then expressed the result as λLλ/L⊙. This representation allows as a direct comparison of the emitted power-per-logarithmic-wavelength (or frequency) interval and facilitates comparisons with other galaxies without any rescaling to the distance of NGC 3521. We also included the MW 28 MHz point in intrinsic luminosity by converting the UTR-2 flux density scaled to D = 10.7 Mpc back to intrinsic luminosity using the same distance.
Figure 7 demonstrates that the MW and NGC 3521 have remarkably similar shapes of their panchromatic SEDs, but systematically different amplitudes in several key wavelength ranges. In the λLλ/L⊙ representation, the two curves closely overlap across the UV to the near-IR (λ ∼ 0.3 − 3 μm), including the position and height of the stellar bump around 1 μm. The overall shape of the dust and radio components is also similar: both SEDs exhibit a broad, far-IR peak around λ ∼ 60 − 200 μm and a smooth decline into the radio–centimeter and decameter ranges. The MW 28 MHz point lies very close to the extrapolated low-frequency tail of the NGC 3521 model. While the similarity of the MW and NGC3521 in terms of SED features and qualitative shape is indeed striking, there are notable differences.
In the mid-IR and far-IR, NGC 3521 is systematically brighter than the scaled MW template, with stronger PAH features and a higher far-IR peak. A factor of ≳2 in the dust peak corresponds to ≃0.3 dex in luminosity normalization. In a broader population context, this is comparable to the intrinsic dispersion expected among local, massive star-forming disks: the width of the local star-forming main sequence is ∼0.3–0.45 dex from M★ ∼ 1010 to 1011 M⊙ (Popesso et al. 2019). The dust-scaling relations for nearby star-forming galaxies show a similar ∼0.3–0.4 dex scatter in dust normalization (e.g., in Mdust/M★; De Looze et al. 2020). Thus, while the offset is physically meaningful (reflecting a higher current dust luminosity and reprocessed output in NGC 3521), it is not exceptional relative to the expected scatter for galaxies with L ∼ 1010–1011. An additional, physically motivated caveat is that the MW dust mass entering template-based comparisons may itself have been underestimated by Natale et al. (2022).
For example, Ginolfi et al. (2018), in their MW-sized halo modeling with the GAMESH pipeline, adopted an observed MW dust mass of Mdust ∼ 1.5 × 10⁸ M⊙. They found that AGB stars alone cannot build up more than ∼3 × 10⁷ M⊙ of dust, while SNe dominate the stellar dust production at all epochs. However, matching Mdust ∼ 1.5 × 10⁸ M⊙ with stellar sources only requires the assumption that the dust, formed in AGB and SN ejecta, is injected into the ISM without destruction by the SN reverse shock, which they regarded as unrealistic. Empirically, reverse-shock processing in well-studied remnants already removes ∼10–40% of the initial dust mass (Bocchio et al. 2016). The scenario, in which reverse shock means survival, was analyzed by Ginolfi et al. (2018). The authors concluded that the net dust mass injected by stellar sources falls short of the MW value by a factor of ∼4. In this context, part of the apparent MW–NGC 3521 far-IR mismatch could reflect systematics in the MW-dust normalization adopted by the template, as well as genuine physical differences between the two galaxies.
The difference in the UV ranges is also due to the differing amounts of dust in the models of NGC 3521 and the MW. More dust attenuates stellar radiation, which in turn lowers the overall continuum of NGC 3521 relative to the MW SED. At longer wavelengths, the radio continuum of NGC 3521 lies modestly above the scaled MW SED over most of the radio centimeter range, again consistent with somewhat enhanced recent star formation and associated nonthermal emission. The agreement at 28 MHz indicates that the two galaxies remain broadly comparable in their low-frequency radio output.
We can confidently count NGC 3521 as a near-twin of the MW, not only in its morphological type, structural parameters isolation and weak or absent nuclear activity (Vavilova et al. 2024; Kompaniiets et al. 2025a), rotation curve (McGaugh 2016), and metallicity (Pilyugin et al. 2023), but also in its UV–radio SED shape and global properties (SFR, M★, Mdust) within the expected scatter for MW parameters. This result also supports our suggestion (Vavilova et al. 2022) that SED shape, together with these global parameters, can serve as an additional indicator in the search for MW twins.
8. Conclusions
We determined the model SED of the spiral galaxy NGC 3521 in the widest range from UV to radio decameter wavelengths. In total, the SED measurements cover 27 photometric points, based on archival aperture imaging data from the UV-to-radio meter ranges and on our own observations in the decameter range. This provides comprehensive coverage of the key physical processes underlying the star formation history of NGC 3521, which is often considered the MW’s twin.
To provide uniform observational data across the full wavelength range, we performed consistent aperture photometry from GALEX to the VLA using a common elliptical isophotal aperture, producing integrated fluxes that are systematically higher in the UV to near-IR than earlier measurements based on smaller apertures (Brown et al. 2014; Pastoven et al. 2024). This homogenization reduces cross-band systematics and improves the robustness of the inferred physical parameters. To construct the SED over a broader range, we conducted observations at 28 MHz with the UTR-2 radio decameter telescope (Jan.–Feb., 2022), adopting a special technique and data processing. It allowed us to register an extremely weak signal and to estimate the upper limit on the flux density of 11.22 Jy. Moreover, we developed and implemented a dedicated radio module in the CIGALE software to ensure homogeneous scaling of data across the radiometer and decameter ranges, which were never used for the SED measurements of this galaxy. It is crucial because integrated galaxy spectra often show curvature and turnover below ∼100 MHz.
We did not include Chandra X-ray data in the SED model of NGC 3521, given its LINER spectral type and weak nuclear activity. Instead, we analyzed central emission using ZTF and NEOWISE data from the 2014–2025 period. As a result, we found a clear BWB behavior of color–magnitude relations; the trend is detected in ZTF PSF-fit photometry, tracing the central ≲3″ region (as controlled by the seeing-quality cut), whereas in the MIR, a similar trend is present in the NEOWISE PSF-fit measurements (effective scale ∼7.5″), where the variability likely reflects a combination of the nuclear component and warm-dust emission from the inner region; see Fig. 6.
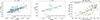 |
Fig. 6. Color–magnitude diagrams for NGC 3521. (a) g − r versus g: York slope m = 0.886 ± 0.108; Pearson r = 0.685, p = 1.8 × 10⁻¹². (b) r − i versus r: m = 0.657 ± 0.238, r = 0.584, p = 3.6 × 10⁻². (c) W1 − W2 versus W1 (native Vega color): m = 0.732 ± 0.127, r = 0.671, p = 4.7 × 10⁻⁷. All color–magnitude relations show a clear bluer-when-brighter (BWB) trend. |
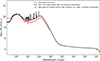 |
Fig. 7. Multiwavelength SEDs of the MW versus NGC 3521 across UV to radio decameter ranges, shown as log10[λLλ(λ)/L⊙]. Black curve: Best theoretical SED for NGC 3521 (Sect. 5.1) converted to intrinsic luminosity assuming D = 10.7 Mpc, and including 28 MHz UTR-2 measurement as a constraint. Red curve: Intrinsic SED of MW obtained by Natale et al. (2022) (originally provided as Lν) and recast to λLλ/L⊙ without any distance scaling. Yellow star: MW 28 MHz UTR-2 flux density scaled to D = 10.7 Mpc and converted to intrinsic luminosity; plotted as λLλ/L⊙. |
NGC 3521 is identified as a Milky Way analog first and foremost through its main structural parameters, rotation curve, and metallicity. Additionally, given its LINER type of activity, low SMBH mass, location as an isolated system in the cosmic web, and well-sampled multiwavelength archival data, NGC 3521 is an excellent target for detailed SED modeling to compare its physical properties with those of the MW (star and dust masses, star formation rate, star formation history). Our best baseline SED model gives M★ ≃ 6 × 10¹⁰ M⊙, SFR ≃ 1.65 M⊙ yr−1, and Mdust ≃ (1.3 ± 0.1)×108 M⊙, with Tdust ∼ 23 K. These values are consistent with independent multiwavelength estimates for NGC 3521 and with the baseline UV-radio centimeter model, while the extended “wavelength coverage to radio meter and decameter” range improves constraints on the star formation rate and dust mass. The derived stellar mass and SFR are also comparable to modern estimates for the MW. At the same time, in the specific MW–NGC 3521 comparison, the most noticeable residual offsets occur in the FUV and near the far-IR dust peak. These differences motivate future sample-based studies to investigate how the relative contributions of unobscured and dust-reprocessed emission relate to the evolutionary state of MW-like galaxies.
We demonstrate that the SED shapes and global parameters (SFR and stellar and dust masses) of our Galaxy and NGC 3521 are highly consistent and conclude that they may serve as an additional indicator in the search for MWAs. In turn, it helps to extrapolate how MW properties appear to an extragalactic observer.
Acknowledgments
This study was supported by the NRF of Ukraine (project 2023.03/0188). We consider our results in the decameter radio range to be a contribution to the “LOFAR 2.0 Ultra-Deep Observation” (LUDO) collaboration. Kompaniiets O.V. is sincerely grateful to Prof. Agnieszka Pollo and Prof. Katarzyna Małek (NCNR, Poland) for the introductory overview of CIGALE, and to NAWA for the PROM grant. We thank Prof. Johan Knapen and Prof. John Beckman (IAC, Spain) for fruitful seminars and discussions in March 2025. Kompaniiets O.V. expresses sincere gratitude to Prof. Michael Blanton (SDSS, USA) for useful remarks on the methodology for working with full-aperture SDSS data, which he provided in private e-mail correspondence (Michael Blanton 2025). The work by Junais at the IAC and visits by Kompaniiets O.V., Izviekova O.I and Dobrycheva D.V. to the IAC in June 2025 are co-funded by the European Union (MSCA Doctoral Network EDUCADO, GA 101119830 and Widening Participation, ExGal-Twin, GA 101158446). The authors thank the reviewer for useful comments that helped us to more fully present the results of our research. This work uses publicly available data from GALEX, SDSS, NEOWISE, ZTF, NRAO, and IRSA archives. The SAO/NASA ADS was very helpful in our research.
References
- Ahn, C. P., Alexandroff, R., Allende Prieto, C., et al. 2012, ApJS, 203, 21 [Google Scholar]
- Albergaria, D., Frantseva, K., Russo, P., et al. 2025, Nat. Astron. [Google Scholar]
- Andrews, J., Sand, D. J., Bostroem, K. A., et al. 2024, TNS Classif. Rep., 2024–4943, 1 [Google Scholar]
- Astropy Collaboration (Robitaille, T. P., et al.) 2013, A&A, 558, A33 [NASA ADS] [CrossRef] [EDP Sciences] [Google Scholar]
- Astropy Collaboration (Price-Whelan, A. M., et al.) 2018, AJ, 156, 123 [Google Scholar]
- Baldwin, J. A., Phillips, M. M., & Terlevich, R. 1981, PASP, 93, 5 [Google Scholar]
- Banik, I., Thies, I., Truelove, R., et al. 2022, MNRAS, 513, 129 [NASA ADS] [CrossRef] [Google Scholar]
- Barbary, K. 2016, JOSS, 1, 58 [Google Scholar]
- Bevington, P. R., & Robinson, D. K. 2003, Data Reduction and Error Analysis for the Physical Sciences, 3rd edn. (New York: McGraw-Hill) [Google Scholar]
- Boardman, N., Zasowski, G., Newman, J. A., et al. 2020a, MNRAS, 498, 4943 [NASA ADS] [CrossRef] [Google Scholar]
- Boardman, N., Zasowski, G., Seth, A., et al. 2020b, MNRAS, 491, 3672 [NASA ADS] [CrossRef] [Google Scholar]
- Bocchio, M., Marassi, S., Schneider, R., et al. 2016, A&A, 587, A157 [NASA ADS] [CrossRef] [EDP Sciences] [Google Scholar]
- Boquien, M., Burgarella, D., Roehlly, Y., et al. 2019, A&A, 622, A103 [NASA ADS] [CrossRef] [EDP Sciences] [Google Scholar]
- Bradley, L., Sipocz, B., Robitaille, T., et al. 2016, Astrophysics Source Code Library [record ascl:1609.011] [Google Scholar]
- Braude, S. I., Megn, A. V., Sokolov, K. P., Tkachenko, A. P., & Sharykin, N. K. 1979, Astrophys. Space Sci., 64, 73 [Google Scholar]
- Brown, M. J. I., Armus, L., Calvin, D. E., et al. 2014, ApJS, 212, 18 [Google Scholar]
- Bruzual, G., & Charlot, S. 2003, MNRAS, 344, 1000 [NASA ADS] [CrossRef] [Google Scholar]
- Burbidge, E. M., Burbidge, G. R., & Prendergast, K. H. 1964, AJ, 139, 1058 [Google Scholar]
- Calzetti, D., Armus, L., Bohlin, R. C., et al. 2000, ApJ, 533, 682 [NASA ADS] [CrossRef] [Google Scholar]
- Cane, H. V. 1979, MNRAS, 189, 465 [NASA ADS] [Google Scholar]
- Cardelli, J. A., Clayton, G. C., & Mathis, J. S. 1989, ApJ, 345, 245 [Google Scholar]
- Casertano, S., & van Gorkom, J. H. 1991, AJ, 101, 1231 [NASA ADS] [CrossRef] [Google Scholar]
- Casey, C. 2012, MNRAS, 425, 3094 [Google Scholar]
- Chabrier, G. 2003, PASP, 115, 763 [Google Scholar]
- Chang, Z., Zhou, J., Wilson, C. D., et al. 2020, ApJ, 900, 53 [CrossRef] [Google Scholar]
- Chyży, K. T., Jurusik, W., Piotrowska, J., et al. 2018, A&A, 619, A36 [NASA ADS] [CrossRef] [EDP Sciences] [Google Scholar]
- Ciurlo, A., & Morris, M. R. 2025, Sagittarius A* – The Milky Way Supermassive Black Hole (submited to Elsevier, chapter for the Encyclopedia of Astrophysics (edited by I. Mandel, section editor S. McGee)) [Google Scholar]
- Coccato, L., Fabricius, M., Saglia, R. P., et al. 2018, MNRAS, 477, 1958 [Google Scholar]
- Condon, J. J. 1992, ARA&A, 30, 575 [Google Scholar]
- Condon, J. J., Cotton, W. D., Greisen, E. W., et al. 1998, AJ, 115, 1693 [Google Scholar]
- Cutri, R. M., Wright, E. L., Conrow, T., et al. 2012, Explanatory Supplement to the WISE All-Sky Data Release Products, Tech. rep., IPAC, California Institute of Technology, Pasadena, CA [Google Scholar]
- Cutri, R. M., Mainzer, A. K., Conrow, T., et al. 2015, Explanatory Supplement to the NEOWISE Data Release Products, Tech. rep., IPAC, California Institute of Technology, Pasadena, CA [Google Scholar]
- Dale, D. A., Aniano, G., Engelbracht, C. W., et al. 2012, ApJ, 745, 95 [NASA ADS] [CrossRef] [Google Scholar]
- Das, M., Teuben, P. J., Vogel, S. N., et al. 2003, ApJ, 582, 190 [NASA ADS] [CrossRef] [Google Scholar]
- Davis, B. L., Berrier, J. C., Johns, L., et al. 2014, ApJ, 789, 124 [NASA ADS] [CrossRef] [Google Scholar]
- De Looze, I., Lamperti, I., Saintonge, A., et al. 2020, MNRAS, 496, 3668 [NASA ADS] [CrossRef] [Google Scholar]
- de Vaucouleurs, G., & Pence, W. D. 1978, AJ, 83, 1163 [CrossRef] [Google Scholar]
- Dettmar, R.-J., & Skiff, B. A. 1993, Evolution of Galaxies and their Environment (NASA Ames Research Center), 251 [Google Scholar]
- Di Valentino, E., Said, J. L., Riess, A., et al. 2025, Phys. Dark Universe, 49, 101965 [Google Scholar]
- Dmytrenko, A. M., Fedorov, P. N., Akhmetov, V. S., et al. 2025, MNRAS, 542, 2542 [Google Scholar]
- Do, T., Witzel, G., Gautam, A. K., et al. 2019, ApJ, 882, L27 [NASA ADS] [CrossRef] [Google Scholar]
- Dobrycheva, D. V., Vavilova, I. B., Melnyk, O. V., & Elyiv, A. A. 2018, Kinemat. Phys. Celesti. Bodies, 34, 290 [Google Scholar]
- Dobrycheva, D. V., Hetmantsev, O. O., Vavilova, I. B., et al. 2025, A&A, 702, A258 [NASA ADS] [CrossRef] [EDP Sciences] [Google Scholar]
- Draine, B. T. 2003, ARA&A, 41, 241 [NASA ADS] [CrossRef] [Google Scholar]
- Draine, B. T. 2011, Physics of the Interstellar and Intergalactic Medium (Princeton: Princeton University Press) [Google Scholar]
- Draine, B. T., & Li, A. 2014, ApJ, 780, 172 [Google Scholar]
- Eckart, A., Zajacek, M., Parsa, M., et al. 2018, Submited to Proceedings of the XII Workshop on ‘Multifrequency Behavior of High Energy Cosmic Sources [Google Scholar]
- Elson, E. C. 2014, MNRAS, 437, 3736 [Google Scholar]
- Elyiv, A. A., Melnyk, O. V., Vavilova, I. B., et al. 2020, A&A, 635, A124 [NASA ADS] [CrossRef] [EDP Sciences] [Google Scholar]
- Erroz-Ferrer, S., Carollo, C. M., den Brok, M., et al. 2019, MNRAS, 484, 5009 [Google Scholar]
- Fabricius, M. H., Coccato, L., Bender, R., et al. 2015, IAU Proc., 309, 81 [Google Scholar]
- Fedorov, P. N., Dmytrenko, A. M., Akhmetov, V. S., et al. 2025, MNRAS, submited [arXiv:2511.22295] [Google Scholar]
- Fielder, C. E., Newman, J. A., Andrews, B. H., et al. 2021, MNRAS, 508, 4459 [Google Scholar]
- Fraser-McKelvie, A., Merrifield, M., & Aragón-Salamanca, A. 2019, MNRAS, 489, 5030 [CrossRef] [Google Scholar]
- Ginolfi, M., Graziani, L., Schneider, R., et al. 2018, MNRAS, 473, 4538 [NASA ADS] [CrossRef] [Google Scholar]
- Ginsburg, A., Sipőcz, B. M., Brasseur, C. E., et al. 2019, AJ, 157, 98 [Google Scholar]
- Graham, A. W., & Driver, S. P. 2007, ApJ, 655, 77 [NASA ADS] [CrossRef] [Google Scholar]
- Grasha, K., Chen, Q. H., Battisti, A. J., et al. 2022, ApJ, 929, 118 [NASA ADS] [CrossRef] [Google Scholar]
- Grier, C. J., Mathur, S., Ghosh, H., & Ferrarese, L. 2011, ApJ, 731, 60 [NASA ADS] [CrossRef] [Google Scholar]
- H0DN Collaboration (Casertano, S., et al.) 2026, A&A, 708, A166 [Google Scholar]
- Haslbauer, M., Banik, I., Kroupa, P., et al. 2024, Universe, 10, 385 [Google Scholar]
- Heeschen, D. S., & Wade, C. M. 1964, AJ, 69, 277 [Google Scholar]
- Heida, M., Jonker, P. G., Torres, M. A. P., et al. 2014, MNRAS, 442, 1054 [NASA ADS] [CrossRef] [Google Scholar]
- Helou, G., Soifer, B. T., & Rowan-Robinson, M. 1985, ApJ, 298, L7 [Google Scholar]
- Hildebrand, R. H. 1983, QJRAS, 24, 267 [NASA ADS] [Google Scholar]
- Hunt, L. K., De Looze, I., Boquien, M., et al. 2019, A&A, 621, A51 [NASA ADS] [CrossRef] [EDP Sciences] [Google Scholar]
- Inoue, A. K. 2011, MNRAS, 415, 2920 [NASA ADS] [CrossRef] [Google Scholar]
- Israel, F. P., & Mahoney, M. J. 1990, ApJ, 352, 30 [Google Scholar]
- Karachentsev, I. D., Makarova, L. N., Anand, G. S., et al. 2022, AJ, 163, 234 [Google Scholar]
- Karachentseva, V. E. 1973, Astrofizicheskie Issledovaniya Byulletin, 8, 3 [Google Scholar]
- Karachentseva, V. E., Mitronova, S. N., Melnyk, O. V., & Karachentsev, I. D. 2010, Astrophys. Bull., 65, 1 [NASA ADS] [CrossRef] [Google Scholar]
- Kauffmann, G., Heckman, T. M., Tremonti, C., et al. 2003, MNRAS, 346, 1055 [Google Scholar]
- Kennicutt, R. C., Jr., Armus, L., Bendo, G., et al. 2003, PASP, 115, 928 [NASA ADS] [CrossRef] [Google Scholar]
- Kennicutt, R. C., Jr., Calzetti, D., Aniano, G., et al. 2011, PASP, 123, 1347 [Google Scholar]
- Kewley, L. J., Dopita, M. A., Sutherland, R. S., Heisler, C. A., & Trevena, J. 2001, ApJ, 556, 121 [Google Scholar]
- Knapik, J., Soida, M., Dettmar, R.-J., et al. 2000, A&A, 362, 910 [Google Scholar]
- Kompaniiets, O. V. 2023, Space Sci. Technol., 29, 88 [Google Scholar]
- Kompaniiets, O. V., Babyk, I. V., Vasylenko, A. A., et al. 2023, IAU Symp., 362, 100 [Google Scholar]
- Kompaniiets, O. V., Kukhar, O. M., Vavilova, I. B., et al. 2025a, Space Sci. Technol., 31, 134 [Google Scholar]
- Kompaniiets, O. V., Vasylenko, A. A., & Vavilova, I. B. 2025b, MNRAS, submitted [arXiv:2506.14348] [Google Scholar]
- Konovalenko, A., Sodin, L., Zakharenko, V., et al. 2016, Exp. Astron., 42, 11 [NASA ADS] [CrossRef] [Google Scholar]
- Konovalenko, O. O., Zakharenko, V. V., Lytvynenko, L. M., et al. 2021, RPRA, 26, 5 [Google Scholar]
- Kourkchi, E., & Tully, R. B. 2017, ApJ, 843, 16 [NASA ADS] [CrossRef] [Google Scholar]
- Lacki, B. C. 2013, MNRAS, 431, 3003 [Google Scholar]
- Large, M. I., Mills, B. Y., Little, A. G., Crawford, D. F., & Sutton, J. M. 1981, MNRAS, 194, 693 [Google Scholar]
- Leroy, A. K., Walter, F., Brinks, E., et al. 2008, AJ, 136, 2782 [Google Scholar]
- Li, A., & Draine, B. T. 2001, ApJ, 554, 778 [Google Scholar]
- Liang, S., & von der Linden, A. 2023, MNRAS, 519, 2281 [Google Scholar]
- Licquia, T. C., & Newman, J. A. 2015, ApJ, 806, 96 [NASA ADS] [CrossRef] [Google Scholar]
- Licquia, T. C., Newman, J. A., & Brinchmann, J. 2015, ApJ, 809, 96 [NASA ADS] [CrossRef] [Google Scholar]
- Lindner, U., Einasto, J., Einasto, M., et al. 1995, A&A, 301, 329 [NASA ADS] [Google Scholar]
- Liu, G., Koda, J., Calzetti, D., Fukuhara, M., & Momose, R. 2011, ApJ, 735, 63 [NASA ADS] [CrossRef] [Google Scholar]
- López, K. M., Jonker, P. G., & Heida, M. 2015, MNRAS, 489, 1249 [Google Scholar]
- Mainzer, A., Bauer, J., Cutri, R., et al. 2014, ApJ, 792, 30 [NASA ADS] [CrossRef] [Google Scholar]
- Marvil, J., Owen, F., & Eilek, J. 2015, AJ, 149, 32 [CrossRef] [Google Scholar]
- Masci, F. J., Laher, R. R., Rusholme, B., et al. 2019, PASP, 131, 018003 [Google Scholar]
- Mast, D., & Díaz, R. J. 2006, Rev. Mex. Astron. Astrofis. Conf. Ser., 26, 193 [Google Scholar]
- Mazurenko, S., Banik, I., Kroupa, P., & Haslbauer, M. 2024, MNRAS, 527, 4388 [Google Scholar]
- McGaugh, S. S. 2016, ApJ, 816, 42 [Google Scholar]
- McKinnon, R., Torrey, P., & Vogelsberger, M. 2016, MNRAS, 457, 3775 [CrossRef] [Google Scholar]
- Melnyk, O., Karachentseva, V., & Karachentsev, I. 2015, MNRAS, 451, 14 [Google Scholar]
- Michael Blanton, S. 2025, Private Communication, email to the authors, outlining suggections on the SDSS aperture photometry and zero points [Google Scholar]
- Morrissey, P., Conrow, T., Barlow, T. A., et al. 2007, ApJS, 173, 682 [Google Scholar]
- Mosenkov, A. V., Baes, M., Bianchi, S., et al. 2019, A&A, 622, A132 [NASA ADS] [CrossRef] [EDP Sciences] [Google Scholar]
- Moustakas, J., Lang, D., Dey, A., et al. 2023, ApJS, 269, 3 [NASA ADS] [CrossRef] [Google Scholar]
- Müller, O., Jerjen, H., Taibi, S., et al. 2025, OJAp, submitted [arXiv:2504.11608] [Google Scholar]
- Mutch, S. J., Croton, D. J., & Poole, G. B. 2011, ApJ, 736, 84 [NASA ADS] [CrossRef] [Google Scholar]
- Naidu, R. P., Conroy, C., Bonaca, A., et al. 2021, ApJ, 923, 92 [NASA ADS] [CrossRef] [Google Scholar]
- Natale, G., Popescu, C. C., Rushton, M., et al. 2022, MNRAS, 509, 2339 [NASA ADS] [Google Scholar]
- Pastoven, O. S., Kompaniiets, O., Vavilova, I., et al. 2024, Space Sci. Technol., 30, 67 [Google Scholar]
- Pattle, K., Gear, W., & Wilson, C. D. 2023, MNRAS, 522, 2339 [Google Scholar]
- Pilyugin, L. S., Grebel, E. K., Zinchenko, I. A., Nefedyev, Y. A., & Vílchez, J. M. 2019, A&A, 623, A122 [NASA ADS] [CrossRef] [EDP Sciences] [Google Scholar]
- Pilyugin, L. S., Tautvaišienė, G., & Lara-López, M. A. 2023, A&A, 676, A57 [NASA ADS] [CrossRef] [EDP Sciences] [Google Scholar]
- Popesso, P., Concas, A., Morselli, L., et al. 2019, MNRAS, 483, 3213 [Google Scholar]
- Pulatova, N. G., Vavilova, I. B., Sawangwit, U., et al. 2015, MNRAS, 447, 2209 [Google Scholar]
- Pulatova, N. G., Vavilova, I. B., Vasylenko, A. A., et al. 2023, Kinemat. Phys. Celest. Bodies, 39, 47 [Google Scholar]
- Rybicki, G. B., & Lightman, A. P. 1979, Radiative Processes in Astrophysics (New York: John Wiley& Sons) [Google Scholar]
- Sawala, T., Delhomelle, J., Deason, A. J., et al. 2025, Nat. Astron., 9, 1206 [Google Scholar]
- Schawinski, K., Thomas, D., Sarzi, M., et al. 2007, MNRAS, 382, 1415 [Google Scholar]
- Schlafly, E. F., & Finkbeiner, D. P. 2011, ApJ, 737, 103 [Google Scholar]
- Schlegel, D. J., Finkbeiner, D. P., & Davis, M. 1998, ApJ, 500, 525 [Google Scholar]
- Sidorchuk, M. A., Konovalenko, A. A., Stepkin, S. V., et al. 2021, RPRA, 26, 287 [Google Scholar]
- Skibba, R. A., Engelbracht, C. W., Dale, D., et al. 2011, ApJ, 738, 89 [NASA ADS] [CrossRef] [Google Scholar]
- Slee, O. B. 1995, Aust. J. Phys., 48, 143 [NASA ADS] [Google Scholar]
- Stevance, H., Smith, K. W., Young, D. R., et al. 2024, TNSAN, 371, 1 [Google Scholar]
- Tully, R. B., & Fisher, J. R. 1987, Atlas of Nearby Galaxies (Cambridge University Press) [Google Scholar]
- Tuntipong, S., van de Sande, J., Croom, S. M., et al. 2024, MNRAS, 533, 4334 [Google Scholar]
- Vasylenko, A. A., Vavilova, I. B., & Pulatova, N. G. 2020, Astron. Nachr., 341, 801 [Google Scholar]
- Vavilova, I., Pakuliak, L., Babyk, I., et al. 2020, in Knowledge Discovery in Big Data from Astronomy and Earth Observation, eds. P. Škoda, & F. Adam, (Elsevier), 57 [Google Scholar]
- Vavilova, I. B., Dobrycheva, D. V., Vasylenko, M. Y., et al. 2021, A&A, 648, A122 [NASA ADS] [CrossRef] [EDP Sciences] [Google Scholar]
- Vavilova, I. B., Khramtsov, V., Dobrycheva, D. V., et al. 2022, Space Sci. Technol., 28, 3 [Google Scholar]
- Vavilova, I. B., Fedorov, P. N., Dobrycheva, D. V., et al. 2024, Space Sci. Technol., 30, 81 [Google Scholar]
- Vila-Vilaro, B., Cepa, J., & Zabludoff, A. 2015, ApJS, 218, 28 [NASA ADS] [CrossRef] [Google Scholar]
- Volvach, A. E., Volvach, L. N., Kutkin, A. M., et al. 2011, Astron. Rep., 55, 608 [Google Scholar]
- Walter, F., Brinks, E., de Blok, W. J. G., et al. 2008, AJ, 136, 2563 [Google Scholar]
- Warren, B. E., Wilson, C. D., Israel, F. P., et al. 2010, ApJ, 714, 571 [Google Scholar]
- Wilson, C. D., Warren, B. E., Israel, F. P., et al. 2012, MNRAS, 424, 3050 [Google Scholar]
- Wright, E. L., Eisenhardt, P. R. M., Mainzer, A. K., et al. 2010, AJ, 140, 1868 [Google Scholar]
- Xi, Q., Sun, N.-C., Aguado, D., et al. 2026, ApJ, 998, 98 [Google Scholar]
- York, D., Evensen, N. M., Martínez, M. L., & Delgado, J. D. 2004, Am. J. Phys., 72, 367 [NASA ADS] [Google Scholar]
- Yusef-Zadeh, F., Bushouse, H., Arendt, R. G., et al. 2025, ApJ, 980, L35 [Google Scholar]
- Zakharenko, V., Konovalenko, A., Sidorchuk, M., et al. 2016, JAI, 5 [Google Scholar]
- Zeilinger, W. W., Vega Beltrán, J. C., Rozas, M., Beckman, J. E., & Knapen, J. H. 2001, Ap&SS, 276, 643 [NASA ADS] [CrossRef] [Google Scholar]
- Zhang, W. M., Soria, R., Zhang, S. N., et al. 2009, ApJ, 699, 281 [NASA ADS] [CrossRef] [Google Scholar]
- Zibetti, S., & Groves, B. 2011, MNRAS, 417, 812 [Google Scholar]
- Zibetti, S., Charlot, S., & Rix, H.-W. 2009, MNRAS, 400, 1181 [NASA ADS] [CrossRef] [Google Scholar]
The mosaic of the SDSS image of NGC 3521 for further photometry analysis is found here: https://reproject.readthedocs.io/en/stable/mosaicking.html
Until the UTR-2 was significantly damaged as a result of the occupation of the Chuhuiv district of the Kharkiv region during the Russian military aggression against Ukraine. After the end of hostilities, it is planned to significantly modernize the UTR-2 with the help of the European astronomical community (Albergaria et al. 2025).
For GALEX see - Morrissey et al. (2007); for SDSS: https://www.sdss4.org/dr17/algorithms/magnitudes/ and Liang & von der Linden (2023); for WISE: https://irsa.ipac.caltech.edu/data/WISE/docs/release/All-Sky/expsup/sec4_4h.html
Appendix A: Technical specifications and low-frequency sensitivity measurements of NGC 3521 with the UTR-2 radio decameter telescope
A.1. Technical specifications
UTR-2 (Ukrainian T-shaped Radio telescope, second model) is located 30 km away from Chuhuiv city, Kharkiv region, Ukraine. Its exploitation started in 1971, and for fifty years (Konovalenko et al. 2021), until the end of February 2022, this instrument worked continuously on many scientific programs3.
UTR-2 consists of two mutually orthogonal multi-element phased antenna arrays, arranged in the shape of the letter "T" (a Mills cross-type configuration without one (fourth) arm). The larger array, North-South, with dimensions of 1800×60 m and consisting of 1440 elements (half-wave dipoles of the Nadenenko system), is located along the meridian and is responsible for declination resolution (∼12° ×20′ at 25 MHz). Its effective area is ≈100,000 m2. The smaller array, West-East, with dimensions of 900×60 m and consisting of 600 elements, is located along the parallel and is responsible for right-ascension resolution (∼40′×12° at 25 MHz), with an effective area of ≈40,000 m2. Observations could be performed separately on each antenna array, as well as in the mode of their signal multiplication. The latter allows the synthesis of a pencil beam with a size of 25′×25′ at 25 MHz (Konovalenko et al. 2016).
A.2. Sensitivity measurements
Decameter data for NGC 3521 were obtained during a highly sensitive sky survey in a wide frequency band pass relative to the declination DecJ = 0° (sessions from January 20 to 22 and from February 3 to 5, 2022). The UTR-2 radio telescope beam was fixedly oriented in relation to this declination (azimuth A = 0°, elevation angle ε ∼ 40°). The daily rotation of Earth provided the complete coverage by scanning the celestial sphere areas within the right ascensions RA from 0h to 24h, crossing the Galactic plane twice a day. Signal registration, pre-processing, and data recording were performed using DSP-Z digital multi-channel spectrum analyzers (Zakharenko et al. 2016) over the frequency range 8.25-33 MHz, with a frequency resolution of 4 kHz and a time resolution of 0.1 s. The corresponding spectra, which illustrate in particular the radio frequency interference (RFI) situation, are shown in Fig. A.1.
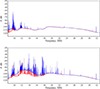 |
Fig. A.1. Spectra obtained during observations at UTR-2 radio telescope in the scanning mode relative to DecJ = 0°. Red line – signal from North – South antenna; Blue line – signal from West – East antenna. Upper - Spectrum obtained on January 22, 2022 at 00:34:05 (UTC; culmination time for NGC 3521); Lower - Spectrum obtained on January 22, 2022 at 11:00:00 (UTC). |
Let us estimate the expected flux density from the NGC 3521 galaxy in the decameter range. NGC 3521 is a spiral galaxy with an intermediate level of star formation. It is not a radio galaxy and reveals at decameter wavelengths due to its own synchrotron radio emission. The flux density from NGC 3521 at high frequencies (1.4 GHz) is about 374.77 mJy (Table 1). Converting this value to decameter-range frequencies (for example, 20 MHz (S ∝ ν−α, where ν is the frequency, α is the spectral index, which for spiral galaxies is 0.6–0.8), we obtain a value of ≈10 Jy. But it should be noted that the non-thermal Galactic background, against which the search for the signal from NGC 3521 may be performed, has brightness temperatures a thousand times higher at decameter wavelengths. In the case of NGC 3521, the detection of such a weak extragalactic signal from NGC 3521 is extremely challenging.
To estimate the sensitivity required for detecting a weak signal from an object such as NGC 3521 with the UTR-2 radio telescope, we consider that the system temperature in the decameter range is dominated by the Galactic background, whose brightness temperature is about 43,000 K at 20 MHz (Cane 1979). The corresponding sensitivity, expressed in terms of the brightness temperature, can be estimated as  , where TB is the brightness temperature of the Galactic background, Δf is the receiver bandwidth, and Δτ is the integration time in seconds. To increase sensitivity, Δf and Δτ should be as large as possible. Based on analysis of the spectra shown in Fig. A.1, it was determined that the cleanest data, free from strong and low-intensity RFI, were obtained for frequencies above 25 MHz. To achieve a maximum Δf, its value can be chosen as 8 MHz for the 24–32 MHz band (with a central frequency of 28 MHz).
To reduce the level of fluctuations, it is advisable to select an integration time Δτ corresponding to the beam size in the narrow cross section along which the scan is performed—in this case, not exceeding 30 s (based on the beam size of about 40′ by right ascension). Substituting TB = 43, 000 K for 20 MHz and TB = 20, 000 K for 28 MHz (Cane 1979; Sidorchuk et al. 2021), Δf = 8 MHz, and Δτ = 30 s into the previous equation, we obtain ΔT = 1.94 K for 20 MHz and ΔT = 1.29 K for the chosen central frequency of 28 MHz. Then, this value can be converted into sensitivity in terms of flux density as ΔS = 2kΔT/Aeff, where k = 1.38 × 10⁻²³JK−1 is the Boltzmann constant and Aeff is the effective area of the antenna in square meters. For the UTR-2 West–East array at an elevation angle of ε ≈ 40°, the effective area is about 35,000 m2 at 20 MHz and 25,000 m2 at 28 MHz. Accordingly, the resulting sensitivity values are ΔS20 = 0.15 Jy and ΔS28 = 0.14 Jy. At a bandwidth of Δf = 8 MHz and an integration time of Δτ = 30 s, these sensitivities are sufficient to detect the expected signal from NGC 3521, while averaging all available scans (N) would improve the signal-to-noise ratio by a factor of  .
.
The calibration time sequences shown in Fig. A.2 illustrate the effect of increasing Δf and Δτ on the noise level. For Δf = 10 kHz and Δτ = 5 s the  . For Δf = 10 kHz and Δτ = 30 s the σ = 1.8 ⋅ 10−3. For Δf = 8 MHz and Δτ = 5 s the σ = 1.6 ⋅ 10−4. For Δf = 8 MHz and Δτ = 30 s the σ = 6.4 ⋅ 10−5. This sensitivity, when expressed in dB, fully corresponds to the relative powers obtained during calibration with a noise generator (Fig. A.2).
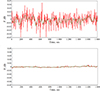 |
Fig. A.2. 30-minute time sequence at 20 MHz built on the data of calibration signal recording from the reference noise generator at a level corresponding to the maximum power level of the Galactic background. Above: Δf = 10 kHz – the red line corresponds to Δτ = 5 s, the green line corresponds to Δτ = 30 s. Below: Δf = 8 MHz – the red line corresponds to Δτ = 5 s, the green line corresponds to Δτ = 30 s. |
A.3. Peculiarities of observations
Observations in the decameter range (∼10–30MHz) are limited by the bright and structured Galactic background that sets the system temperature, by strong and variable radio-frequency interference (RFI) from non-cosmic signals, and by ionospheric distortions. We used UTR-2 in drift-scan mode with the beam fixed at DecJ = 0° and exploited Earth’s rotation to sweep RA, recording wide-band spectra with DSP-Z analyzers (4kHz frequency and 0.1s time resolution). Sensitivity was improved by selecting the cleanest sub-band (≳25MHz), adopting a large effective bandwidth (Δf = 8MHz) and an integration time matched to the narrow beam cross section (Δτ ≈ 30s), which maximizes ΔfΔτ and lowers the radiometer noise to  –2K.
–2K.
Using the effective area of the West–East array for the observed elevation angle, this yields a Flux density sensitivity of ΔS ≈ 2kΔT/Aeff ≈ 0.14–0.15Jy, consistent with calibration sequences using a reference noise source and with SEFD estimates. Additional accuracy is achieved by averaging multiple daily scans ( ), carefully excising RFI, and accounting for side-lobe contamination (e.g., Cassiopeia A) that can bias the baseline. Planned hardware multiplication of the signals from the North–South and West–East arrays (synthesized “pencil-beam” mode) would further suppress confusion and enhance the detectability of faint extragalactic sources such as NGC 3521.
Appendix B: Data processing for flux density values of NGC 3521 from UV to Radio cm ranges
B.1. Aperture and PSF corrections
For all ranges, we assumed a circular Gaussian point-spread function (PSF) with FWHM values corresponding to the nominal angular resolution of each instrument. To correct for the fraction of light falling outside the adopted elliptical aperture, we computed the encircled energy (EE) fraction as
![Mathematical equation: $$ \begin{aligned} \mathrm{EE}(r) = 1 - \exp \!\left[-\tfrac{1}{2}\left(\frac{r}{\sigma }\right)^{2}\right], \qquad \sigma = \frac{\mathrm{FWHM}}{2.355}, \end{aligned} $$](/articles/aa/full_html/2026/06/aa58597-25/aa58597-25-eq13.gif) (B.1)
(B.1)
where r is the equivalent radius of the aperture,  . The aperture–corrected flux is then
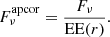 (B.2)
(B.2)
For the radio cm data, we adopted EE = 1, since the aperture fully encloses the source.
B.2. Flux conversion and background subtraction
Background levels were estimated locally using a sigma–clipped median algorithm on PSF-matched images, excluding the entire science aperture from the background mesh to avoid flux losses. The background-subtracted image is then defined as I′=I − B, where I is the original image intensity and B is the local background model. Flux densities were computed from the total background-subtracted signal within the aperture as S = ∑apI′, where the summation extends over all unmasked pixels inside the aperture. The conversion from instrumental counts to physical flux densities done with the adopted zero-points4 and flux calibration factors defined for each filter (Sect. 3.1). For the optical and UV ranges, this relation follows the standard AB magnitude convention, while for the far-infrared and radio cm images, the conversion depends on the maps’ native radiometric units, as described below.
The AB mag and zero-points, in mJy, were taken into account in the calculations of optical and UV photometric parameters, as follows from eq. B.3
![Mathematical equation: $$ \begin{aligned} m = -2.5\log _{10} S + \mathrm{ZP}, \qquad F_{\nu } [\mathrm{mJy}] = 10^{-0.4(m - 8.90)} \times 10^{3}, \end{aligned} $$](/articles/aa/full_html/2026/06/aa58597-25/aa58597-25-eq16.gif) (B.3)
(B.3)
where ZP is the adopted photometric zero-point, and the constant 8.90 encodes the AB zero-point for Jy.
Photometric data for the FIR and Radio cm ranges, in radiometric units, were calculated using eq. B.4,B.5. Let Ωpix is the pixel solid angle (sr), and Ωbeam is the beam solid angle derived from the restoring beam parameters (BMAJ, BMIN):
 (B.4)
(B.4)
Then the flux density in mJy is given by the following equations:
![Mathematical equation: $$ \begin{aligned} \mathrm{MJy sr^{-1}}: \quad&F_{\nu }[\mathrm{mJy}] = \left(\sum _{\rm ap} I^{\prime }_{\rm MJy/sr}\right)\Omega _{\rm pix} 10^{9},\end{aligned} $$](/articles/aa/full_html/2026/06/aa58597-25/aa58597-25-eq18.gif) (B.5)
(B.5)
![Mathematical equation: $$ \begin{aligned} \mathrm{Jy pix^{-1}}: \quad&F_{\nu }[\mathrm{mJy}] = \left(\sum _{\rm ap} I^{\prime }_{\rm Jy/pix}\right)10^{3},\end{aligned} $$](/articles/aa/full_html/2026/06/aa58597-25/aa58597-25-eq19.gif) (B.6)
(B.6)
![Mathematical equation: $$ \begin{aligned} \mathrm{Jy beam^{-1}}: \quad&\mathrm{pix/beam} = \frac{\Omega _{\rm beam}}{\Omega _{\rm pix}}, F_{\nu }[\mathrm{mJy}] = \frac{\sum _{\rm ap} I^{\prime }_{\rm Jy/beam}}{(\mathrm{pix/beam})} 10^{3}. \end{aligned} $$](/articles/aa/full_html/2026/06/aa58597-25/aa58597-25-eq20.gif) (B.7)
(B.7)
B.3. Extinction correction
The MW extinction was corrected using E(B − V) values obtained from the IRSA Dust maps via the astroquery.irsa interface (Ginsburg et al. 2019), scaled by a factor of 0.86 to match the recalibration (Schlafly & Finkbeiner 2011) of the dust map (Schlegel et al. 1998). So, with AV = 3.1E(B − V)eff and the reddening law (Cardelli et al. 1989) applied for λ ≤ 3.3μm, the extinction-corrected flux density is Aλ = CCM89(λ, AV, RV = 3.1) and  .
.
Extinction corrections were neglected for λ > 3.3μm, as well as for all data in FIR and radio cm ranges.
B.4. Uncertainty estimation
The background noise per aperture was calculated as  , where σbkg is the standard deviation of the local background, Npix is the number of unmasked pixels inside the aperture, and fcorr is a correlation factor accounting for PSF broadening and repixelization effects. For PACS, SPIRE, and VLA data, we used empirically calibrated fcorr values ranging from 1.1 to 1.8.
For fluxes derived from magnitudes, we used Eq. B.8:
 (B.8)
(B.8)
The propagated uncertainties after aperture and extinction corrections calculated by eq. B.9
 (B.9)
(B.9)
The results of aperture photometry from UV to radio cm ranges are given in Table 1.
Appendix C: Baseline model construction for UV to radio cm spectral energy distribution
We adopted the baseline SED model developed in our previous preliminary UV–to–radio (cm) fitting Pastoven et al. (2024). Here we apply the same model to the fluxes derived from aperture photometry. The baseline model and the corresponding grid parameters are summarized in Table C.1.
Parameter grid adopted for the SED modeling.
The total stellar luminosity is L★ = (7.53 ± 0.38)×1010 L⊙, and for the evolved population of stars L★, old = (6.28 ± 0.31)×1010 L⊙. The integrated dust luminosity reaches Ldust = (2.78 ± 0.14)×1010 L⊙, and the corresponding dust mass is Mdust = (9.8 ± 2.1)×107 M⊙, which unveils a massive dust reservoir that reradiate much of the stellar emission at infrared wavelengths. The sum of the stellar mass obtained from a Bayesian analysis is 2.1 ± 0.8. M★ = (5.73 ± 0.29)×1010 M⊙, old stellar component dominated (M★, old = 5.73 ± 0.29 × 10¹⁰ M⊙), This indicates that the stellar population of NGC 3521 is dominated by an evolved disk population. The mass-weighted stellar age is t★, mw = 5.00 ± 0.01 Gyr, signifying a more evolved stellar component, as that would be characteristic for metal-rich spirals in the local Universe. The corresponding star-formation rate from the delayed-τ star-formation history is SFR = 1.93 ± 0.10 M⊙yr−1, which is in agreement with a main-sequence activity of massive late-type spiral galaxies. The attenuation parameters of the SED fitting are AB, 90 = 0.845 ± 0.016 mag, AV, 90 = 0.621 ± 0.017 mag, and AFUV = 2.62 ± 0.03 mag, which are typical of galaxies with intermediate inclination. Above all, these results imply that NGC 3521 hosts a huge stellar disk with an enhanced dust component, where the current star formation is distinctly calm. The system appears to be close to energy equilibrium between stellar and dust radiation.
For the determination of whether our physical parameters are robust, we examined the distributions of reduced χ2s saved for each physical parameter. All parameters investigated exhibit a clear minimum at a single solution concentration; therefore, the best-fit model can be considered statistically unique within the covered grid. No secondary minima or extended plateaus are observed, indicating that the degeneracies among parameters (stellar and dust masses, SFR) are small. While the wider distributions in SFR and L★, old can be attributed to the correlation between recent SFR activity and dust attenuation among spiral galaxies. These tests show that the selected CIGALE configuration has adequate grid resolution and that the inferred parameters are well-constrained and physically motivated.
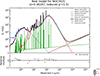 |
Fig. C.1. NGC 3521 SED from UV to radio cm ranges. |
Appendix D: Emission from the central region: ZTF and NEOWISE data preparation
D.1. Optical data with ZTF
ZTF provides pipeline PSF-fit photometry with a typical seeing of 2.0–2.2″ (FWHM) and a plate scale of ∼1.01″/pix (Masci et al. 2019).
To mitigate epoch-to-epoch PSF/seeing systematics, we use the ZTF pipeline PSF-fit magnitudes and attach the per-epoch seeing (FWHM) from the exposure-level metadata. Because NGC 3521 is spatially extended, seeing variations can modulate the host-galaxy contribution even for PSF-fit measurements. We therefore apply a seeing-quality cut (FWHM ≤3.00″), rejecting 123/633 measurements (19.4%) and retaining 510 epochs (median FWHM 2.26″, 95th percentile 2.88″). After this cut, we apply standard QC (maximum magnitude uncertainty and positional offset) and robust MAD-based global clipping in each band (Kglobal = 2.5σMAD), yielding 454 clean measurements. To verify that the inferred color–magnitude relations are not driven by seeing, we (i) repeat the full pipeline using stricter cuts (FWHM ≤2.70″ and ≤2.50″) and (ii) perform a residual-magnitude test in which a linear magnitude–seeing term is removed in each band before repeating the nightly color–magnitude analysis. All slopes remain consistent within uncertainties (Table D.1). Since the results are consistent within uncertainties across the tested thresholds, we adopt FWHM ≤3.00″ as our fiducial cut to maximize the number of paired measurements and minimize the regression uncertainties.
Robustness of ZTF nightly color–magnitude relations to the seeing-quality cut and to the residual-magnitude test.
The effective wavelengths and transmission curves were obtained from the SVO Filter Profile Service5: λeff(g) = 4746.48 Å, λeff(r) = 6366.38 Å, λeff(i) = 7829.03 Å.
We adopted the standard power-law convention Fν ∝ ν−α (Rybicki & Lightman 1979) consistently across the optical and MIR bands. For any two bands X and Y (AB magnitudes mX, mY; effective wavelengths λX, λY), the color (X − Y)≡mX − mY is related to the spectral index by
 (D.1)
(D.1)
where ν = c/λ. Using the ZTF effective wavelengths we obtain color–to–index factors
 (D.2)
(D.2)
D.2. Infrared data from NEOWISE
Infrared photometry in the W1 (3.35 μm) and W2 (4.60 μm) bands was obtained from the single-exposure NEOWISE Source Table (neowiser_p1bs_psd) hosted by the NASA/IPAC Infrared Science Archive (IRSA)6 (Mainzer et al. 2014). These wavelengths correspond to the effective filter response of the WISE detectors as defined in the WISE All-Sky Release Explanatory Supplement (Cutri et al. 2012).
The NEOWISE measurements used here are the pipeline profile-fit magnitudes (w1mpro, w2mpro) from individual exposures (native Vega system). Given the WISE PSF (FWHM ≈6″), each measurement inevitably combines the nuclear emission with a significant fraction of the inner stellar/dust disk (Cutri et al. 2012). The profile-fit photometry is obtained by PSF fitting within a circular region of radius 7.5″ for non-saturated W1/W2 detections (1.25 × FWHM), while the fitting radius is enlarged when the source core is saturated (Cutri et al. 2012, Sec. IV.4.c.iii). For our target, the single-exposure catalog diagnostics confirm the non-saturated regime for all queried measurements (w1fitr=w2fitr = 7.5″ and w1sat=w2sat = 0 throughout; Cutri et al. 2015). We queried IRSA with a cone search of radius 5″ around the galaxy center and applied standard quality filtering (SNR thresholds, cc_flags, qual_frame) followed by robust global clipping in each band and epoch-based averaging.
For the spectral-index analysis, we convert W1 and W2 to AB using the standard offsets from the WISE All-Sky Release Explanatory Supplement (Sect. IV.4.h.i, Table 3; Cutri et al. 2012)7:
 (D.3)
(D.3)
so that (W1 − W2)AB = (W1 − W2)Vega − 0.64. Adopting Fν ∝ ν−α, we define
 (D.4)
(D.4)
with the effective wavelengths from the SVO Filter Profile Service8λeff(W1) = 33526.00 Å, λeff(W2) = 46028.00 Å, and compute αMIR = (W1 − W2)AB/KW1W2 and dα/d(−W1) = −mcolor/KW1W2.
All Tables
Robustness of ZTF nightly color–magnitude relations to the seeing-quality cut and to the residual-magnitude test.
All Figures
|
Fig. 1. Examples of multiwavelength images of NGC 3521 used for aperture photometry and SED construction: (a) GALEX NUV; (b) SDSS g band; (c) Herschel/PACS 160 μm; and (d) VLA L-band radio continuum. All panels show the same field of view (570″ × 570″) centered on the galaxy; the axes are angular offsets from the center in arcseconds. The color-scales are shown in commonly used map units, as labeled on each color-bar. For GALEX NUV, we converted the count-rate map to a band-integrated flux per pixel in erg cm−2 s−1 pix−1 using the standard GALEX photometric calibration and the effective band pass width; for the SDSS g-band, we display flux density per pixel (nanomaggies/pix); for PACS 160 μm, the map is shown in Jy/pix, and for the VLA L-band in Jy/beam. The pixel scale (and, for the VLA map, the beam size BMAJ × BMIN) is indicated in each image. To preserve faint emission while avoiding saturation in bright regions, all images are displayed with an inverse-hyperbolic-sine (asinh) stretch. The red ellipse marks the adopted isophotal aperture used for integrated flux measurements. |
| In the text | |
|
Fig. 2. Upper: Map of nonthermal Galactic-radio-emission distribution (in terms of brightness temperatures TB), obtained at UTR-2 for 20 MHz (Sidorchuk et al. 2021). The horizontal black strip schematically represents the Galaxy’s intersection in the UTR-2 sky scans at DecJ = 0°. A white square indicates the position of NGC 3521. Middle: Averaged scan for Jan. 20–22, 2022 (daily sequence of total signal power changes at antenna output); 24–32 MHz band; integration time 30 s. Bottom: Averaged scan for Feb. 3–5, 2022; 24–32 MHz band; integration time 30 s. |
| In the text | |
|
Fig. 3. Part of the time sequence relative to the coordinates of NGC 3521 on the scan averaged over Jan. 20–22 and Feb. 3–5, 2022, obtained at the West-East antenna of the UTR-2 radio telescope for 24–32 MHz band; integration time 30 s. |
| In the text | |
|
Fig. 4. Part of the time sequence for the back diffraction side lobe of Cassiopeia A on the scan averaged over Jan. 20–22 and Feb. 3–5, 2022, obtained at the West-East antenna of the UTR-2 radio telescope for 24–32 MHz band; integration time 30 s. |
| In the text | |
|
Fig. 5. NGC 3521 SED from UV to decameter ranges. |
| In the text | |
|
Fig. 6. Color–magnitude diagrams for NGC 3521. (a) g − r versus g: York slope m = 0.886 ± 0.108; Pearson r = 0.685, p = 1.8 × 10⁻¹². (b) r − i versus r: m = 0.657 ± 0.238, r = 0.584, p = 3.6 × 10⁻². (c) W1 − W2 versus W1 (native Vega color): m = 0.732 ± 0.127, r = 0.671, p = 4.7 × 10⁻⁷. All color–magnitude relations show a clear bluer-when-brighter (BWB) trend. |
| In the text | |
|
Fig. 7. Multiwavelength SEDs of the MW versus NGC 3521 across UV to radio decameter ranges, shown as log10[λLλ(λ)/L⊙]. Black curve: Best theoretical SED for NGC 3521 (Sect. 5.1) converted to intrinsic luminosity assuming D = 10.7 Mpc, and including 28 MHz UTR-2 measurement as a constraint. Red curve: Intrinsic SED of MW obtained by Natale et al. (2022) (originally provided as Lν) and recast to λLλ/L⊙ without any distance scaling. Yellow star: MW 28 MHz UTR-2 flux density scaled to D = 10.7 Mpc and converted to intrinsic luminosity; plotted as λLλ/L⊙. |
| In the text | |
|
Fig. A.1. Spectra obtained during observations at UTR-2 radio telescope in the scanning mode relative to DecJ = 0°. Red line – signal from North – South antenna; Blue line – signal from West – East antenna. Upper - Spectrum obtained on January 22, 2022 at 00:34:05 (UTC; culmination time for NGC 3521); Lower - Spectrum obtained on January 22, 2022 at 11:00:00 (UTC). |
| In the text | |
|
Fig. A.2. 30-minute time sequence at 20 MHz built on the data of calibration signal recording from the reference noise generator at a level corresponding to the maximum power level of the Galactic background. Above: Δf = 10 kHz – the red line corresponds to Δτ = 5 s, the green line corresponds to Δτ = 30 s. Below: Δf = 8 MHz – the red line corresponds to Δτ = 5 s, the green line corresponds to Δτ = 30 s. |
| In the text | |
|
Fig. C.1. NGC 3521 SED from UV to radio cm ranges. |
| In the text | |
Current usage metrics show cumulative count of Article Views (full-text article views including HTML views, PDF and ePub downloads, according to the available data) and Abstracts Views on Vision4Press platform.
Data correspond to usage on the plateform after 2015. The current usage metrics is available 48-96 hours after online publication and is updated daily on week days.
Initial download of the metrics may take a while.