


Fig. 1.

Download original image
Rest-frame optical spectrum of SDSS J1532 (top left panel) and best-fitting results of SDSS J1532 with rest-frame spectrum from 3850 Å to 4450 Å (top right panel), from 4750 Å to 5050 Å (bottom left panel) and from 6400 Å to 6800 Å (bottom right panel). In the top subpanels the solid dark green lines show the line spectra; the dashed blue and red lines represent the blueshifted and redshifted components of the narrow Hα, Hβ, Hγ, Hδ, He I, [Ne III], [O III], [N II], and [S II] doublets; the solid blue lines represent the extended components of the [O III] emission lines; the solid green lines represent the broad Hα, Hβ, and Hγ emission lines with the corresponding parameters of the central wavelength (Å), line width σ (Å), and line flux (10−17 erg/s/cm2) listed in the first two lines of the panels; the dashed cyan lines show the continuum emissions 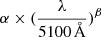 with parameters listed in the third line. In the bottom subpanels, the solid blue lines represent the residuals computed by subtracting the best-fitting results from the line spectra and then dividing by the uncertainties of the SDSS spectra; the solid and dashed green lines show 0 and ±1, respectively.
Current usage metrics show cumulative count of Article Views (full-text article views including HTML views, PDF and ePub downloads, according to the available data) and Abstracts Views on Vision4Press platform.
Data correspond to usage on the plateform after 2015. The current usage metrics is available 48-96 hours after online publication and is updated daily on week days.
Initial download of the metrics may take a while.