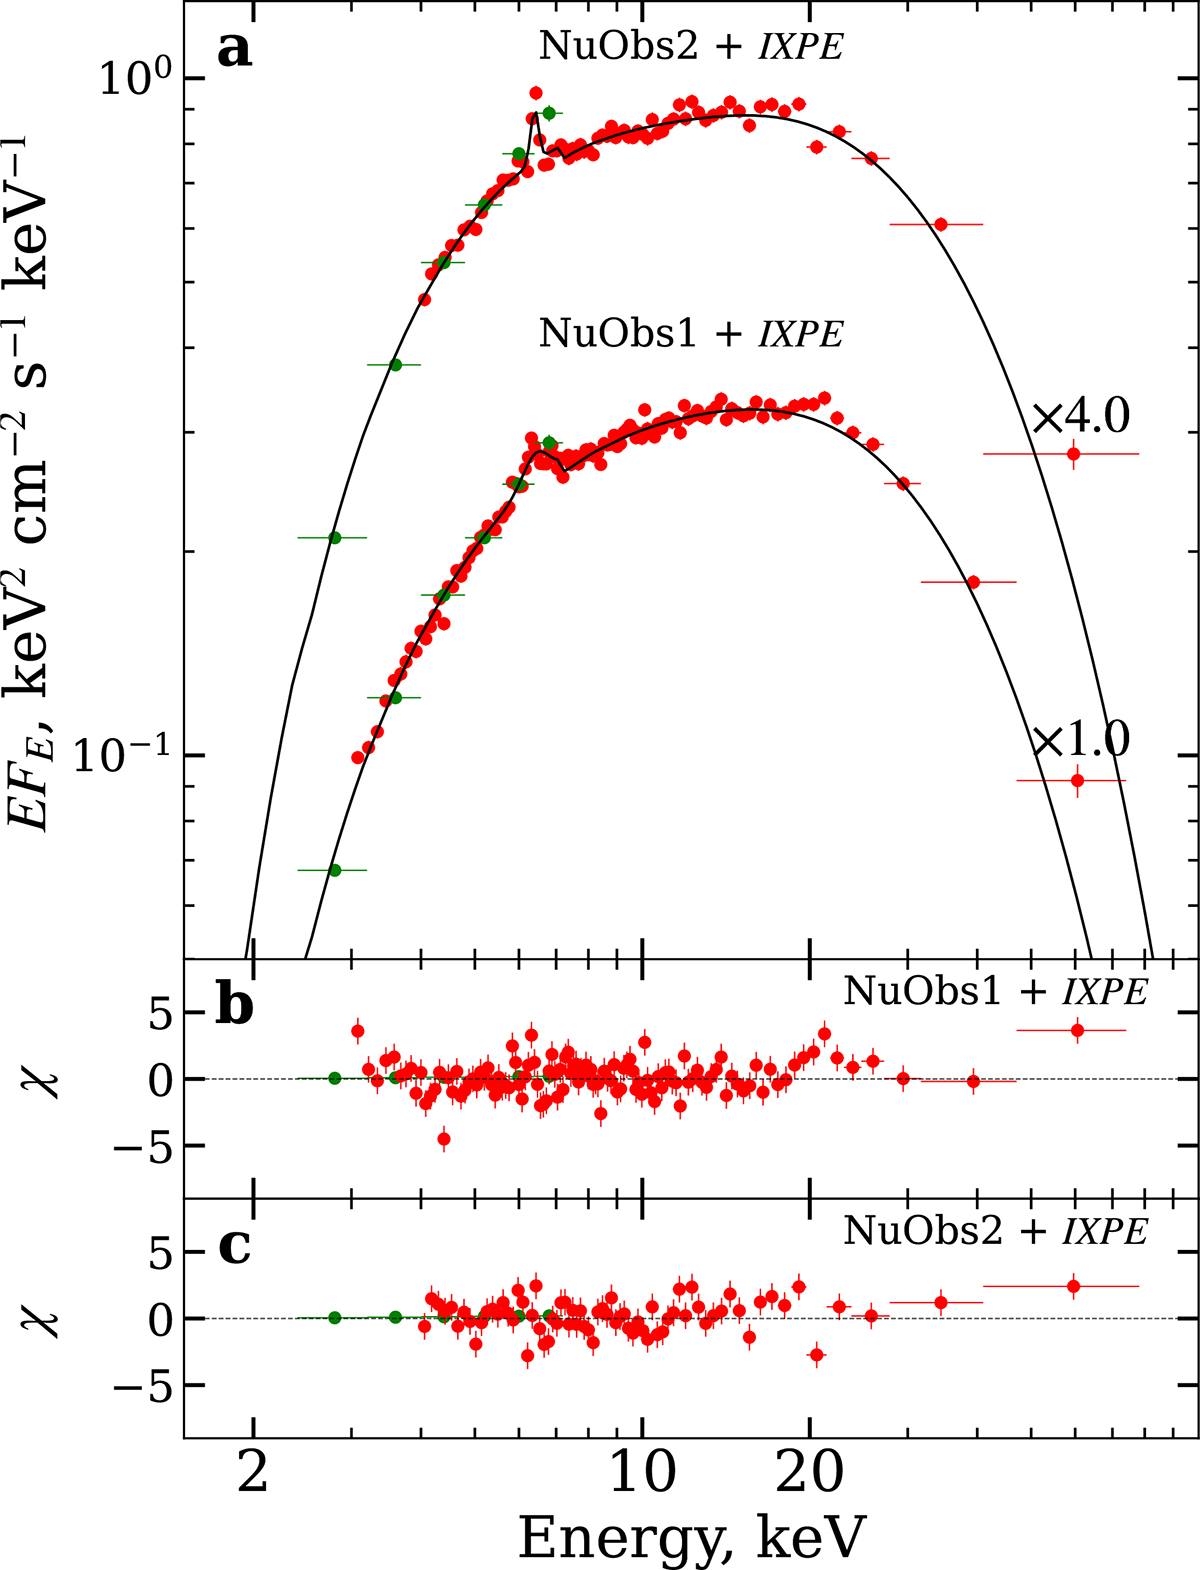
Fig. 4.
Download original image
Unfolded energy spectra from the joint IXPE and NuSTAR analysis. The IXPE spectra correspond to the Stokes I datasets from DU1 and DU3. Green points denote the IXPE measurements, while red points represent the NuSTAR spectrum. Cross markers indicate the multiplicative scaling factors applied to the spectra for visual clarity. Panels (b) and (c) show residuals of the joint fits for NuObs1+IXPE and NuObs2+IXPE, respectively.
Current usage metrics show cumulative count of Article Views (full-text article views including HTML views, PDF and ePub downloads, according to the available data) and Abstracts Views on Vision4Press platform.
Data correspond to usage on the plateform after 2015. The current usage metrics is available 48-96 hours after online publication and is updated daily on week days.
Initial download of the metrics may take a while.