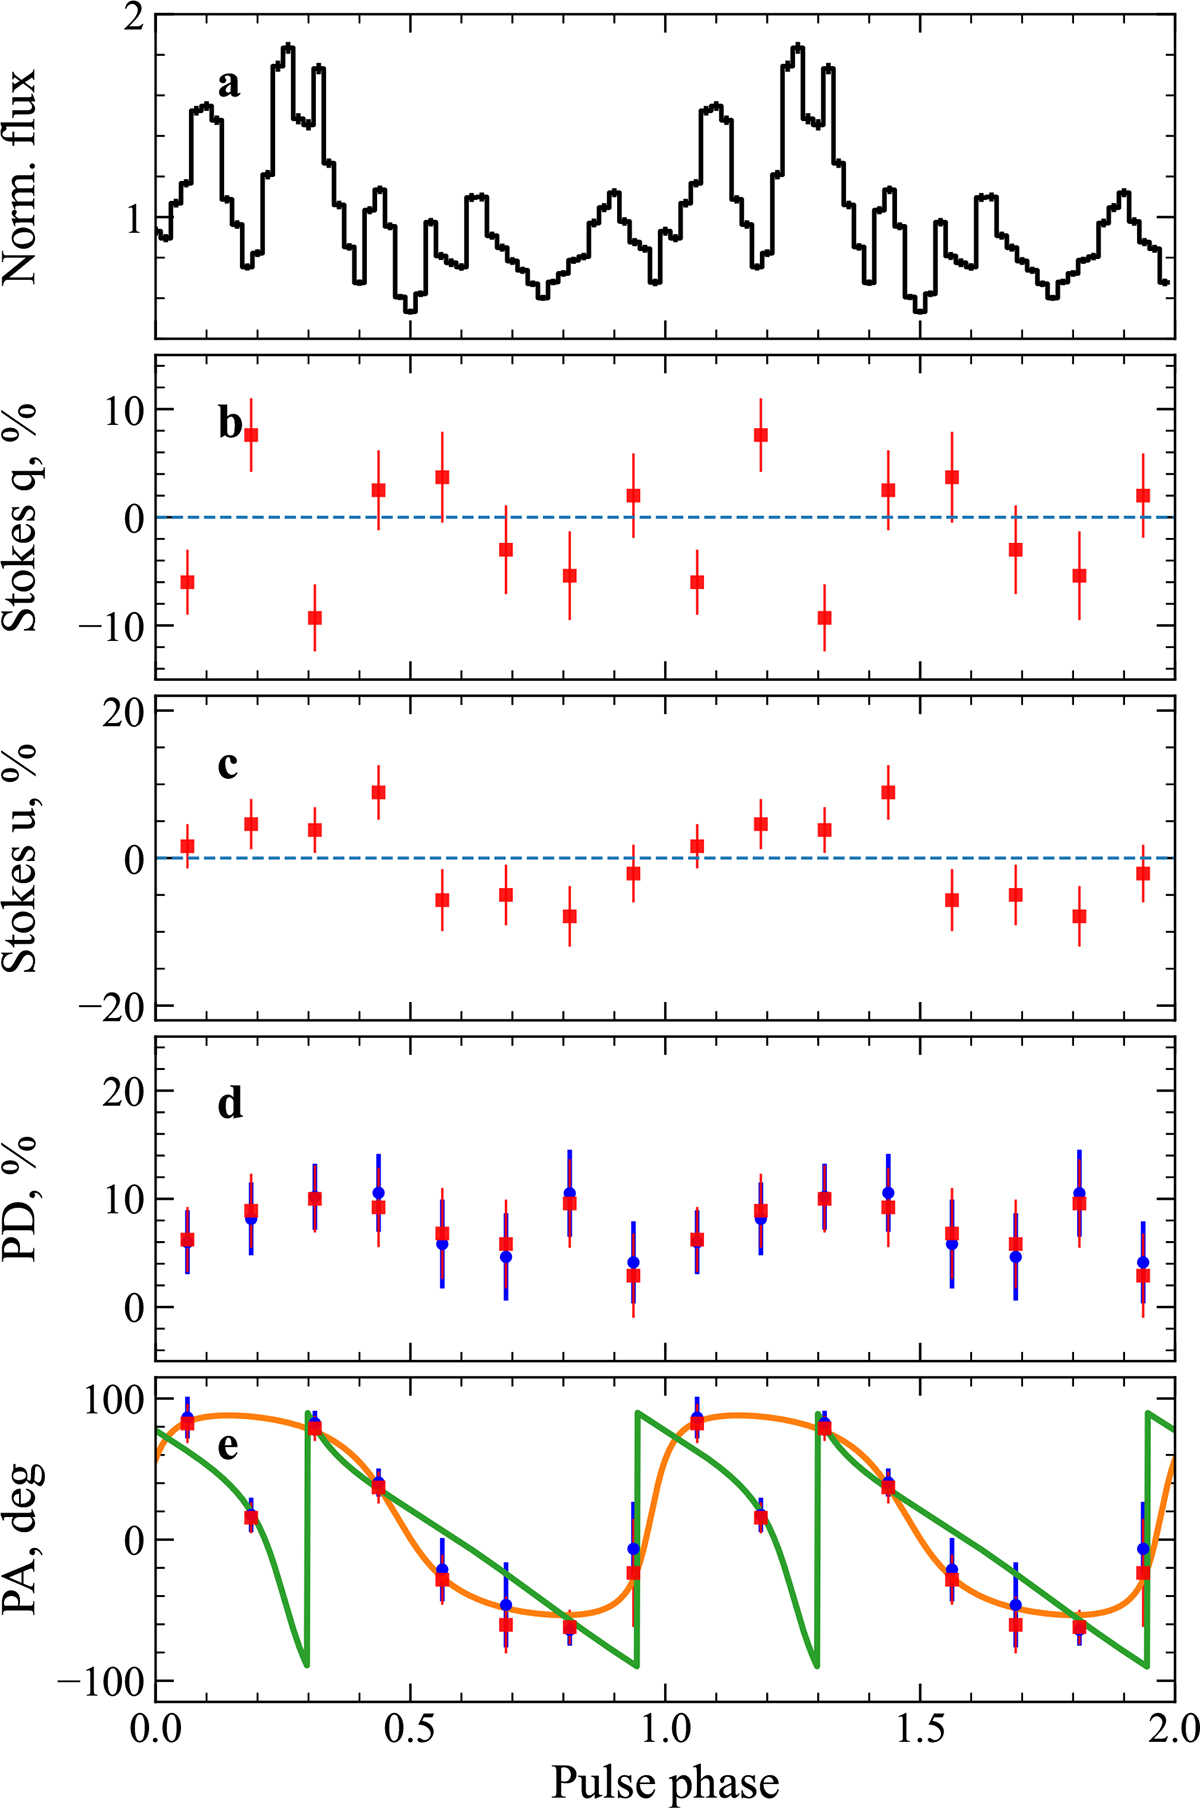
Fig. 3.
Download original image
Phase-resolved properties of 4U 1954+319 over two pulse cycles. The PD and PA measurements derive from two methods: blue points show spectro-polarimetric analysis results, and square red symbols show model-independent measurements obtained with ixpepolarization. Panels display (a) the normalized pulse profile in the 2–8 keV band derived from the IXPE data, (b)–(c) the Stokes parameters q and u, (d) the PD, and (e) the PA. The PA panel shows two RVM solutions from Table 3, corresponding to two distinct posterior clusters in Fig. 6: Solution 1 (orange) and Solution 2 (green).
Current usage metrics show cumulative count of Article Views (full-text article views including HTML views, PDF and ePub downloads, according to the available data) and Abstracts Views on Vision4Press platform.
Data correspond to usage on the plateform after 2015. The current usage metrics is available 48-96 hours after online publication and is updated daily on week days.
Initial download of the metrics may take a while.