


| Issue |
A&A
Volume 710, June 2026
|
|
|---|---|---|
| Article Number | A402 | |
| Number of page(s) | 22 | |
| Section | Galactic structure, stellar clusters and populations | |
| DOI | https://doi.org/10.1051/0004-6361/202557719 | |
| Published online | 01 July 2026 | |
Expansion kinematics of young clusters
II. NGC 2264 N & S and Collinder 95 with HectoSpec
1
Department of Space, Earth & Environment, Chalmers University of Technology,
412 96
Gothenburg,
Sweden
2
Department of Astronomy, University of California,
Berkeley,
CA
94720-3411,
USA
3
Department of Astronomy, University of Virginia,
Charlottesville,
VA
22904,
USA
★ Corresponding author: This email address is being protected from spambots. You need JavaScript enabled to view it.
Received:
16
October
2025
Accepted:
23
April
2026
Abstract
Aims. Studying the dynamical evolution of young clusters is crucial to gaining a more general understanding of the star formation process.
Methods. We took spectra of >600 candidate pre-main sequence (PMS) stars in several nearby young clusters (NGC 2264 N & S, Collinder 95, and Collinder 359) using MMT/Hectospec. These spectra were analyzed for Hα emission and lithium absorption, features indicative of low-mass young stellar objects (YSOs) still in their PMS evolution. We complemented these samples with YSOs identified via Gaia DR3 variability. In conjunction with Gaia astrometry, these data enable an analysis of cluster structure, kinematics, and ages. We searched for halos of YSOs around our targets in order to test models of young cluster dynamical evolution.
Results. For the NGC 2264 N & S cluster pair, we identified 354 YSOs, while for Collinder 95 and 359 we identified 130 and 7 YSOs, respectively. We calculated kinematic “traceback ages” for YSOs in these clusters, which we compared to isochronal ages estimated using several sets of stellar evolution models. We find that for NGC 2264 N & S, the kinematic ages are generally less than their isochronal ages, which may indicate these systems remained bound for a few megayears before their current state of expansion. On the other hand, kinematic ages for Collinder 95 are often significantly greater than their isochronal ages, which implies many of these YSOs did not originate from a central dense region, leading to overestimated kinematic ages.
Conclusions. We conclude that NGC 2264 N & S clusters likely formed as initially bound and compact systems but have been gradually evaporating as cluster members become unbound and form halos of unbound YSOs surrounding the cluster cores. Further, we conclude that Collinder 95 was initially sparse and substructured when formed and has been dispersing since gas expulsion.
Key words: stars: formation / stars: kinematics and dynamics / stars: low-mass / stars: pre-main sequence / open clusters and associations: general
© The Authors 2026
 Open Access article, published by EDP Sciences, under the terms of the Creative Commons Attribution License (https://creativecommons.org/licenses/by/4.0), which permits unrestricted use, distribution, and reproduction in any medium, provided the original work is properly cited.
This article is published in open access under the Subscribe to Open model. This email address is being protected from spambots. You need JavaScript enabled to view it. to support open access publication.
1 Introduction
The vast majority of stars are born in stellar clusters (e.g., Lada & Lada 2003; Gutermuth et al. 2009), so understanding the formation and evolution of these clusters is critical to shedding light on the star formation process. However, age estimates for these clusters produced by fitting stellar evolutionary models to observational data suffer from many sources of uncertainty, particularly for the low-mass pre-main sequence (PMS) stars, which are the majority of the population in young clusters (Miret-Roig et al. 2024).
Kinematic ages offer a model-independent alternative for estimating the age of a stellar cluster and provide additional insight into the evolution and history of clusters. The kinematic age, or traceback age, reflects a physical consequence of prolific star formation in young stellar clusters. In these clusters, feedback from young massive stars expels the surrounding molecular gas, causing the cluster to lose most of its binding mass (e.g., Goodwin & Bastian 2006). This produces an expanding halo of young stars around the cluster center, an expansion trend reflected in some simulations of young clusters (e.g., Farias et al. 2019) and also in many recent observational works (Kuhn et al. 2019; Armstrong et al. 2022; Guilherme-Garcia et al. 2023; Wright et al. 2024; Armstrong & Tan 2024), which have demonstrated that the majority of nearby young clusters exhibit such signatures of expansion. These expansion signatures can also be used to constrain the age of the cluster (Miret-Roig et al. 2024; Armstrong & Tan 2024). By identifying young stellar objects (YSOs) moving outward from the cluster center and calculating the time required for them to travel to their current positions from their assumed initial configuration, we can calculate a kinematic (or traceback) age of a stellar cluster. Such kinematic age analysis has been greatly enabled by the advent of Gaia’s high precision position and proper motion measurements (Gaia Collaboration 2021), with which we can probe the internal kinematics of stellar clusters.
Armstrong & Tan (2024) investigated the internal kinematics of the λ Ori cluster using high probability members from the Cantat-Gaudin et al. (2020a) catalog, updated with Gaia data-release 3 (DR3) astrometry and cross-matched with the radial velocity catalog of Tsantaki et al. (2022). Using both the Q-parameter (Cartwright & Whitworth 2004) and angular dispersion parameter (Da Rio et al. 2014), they found evidence that the cluster contains significant substructure outside the smooth central cluster core. Armstrong & Tan (2024) found strong evidence of asymmetric expansion in the λ Ori cluster and determined the direction at which the rate of expansion is at a maximum. They also inverted the maximum rate of expansion of  km/s/pc to give an expansion timescale of
  : Myr, which they compared to other kinematic age methods applied to this cluster (Squicciarini et al. 2021 ; Quintana & Wright 2022; Pelkonen et al. 2024) and literature age estimates (Kounkel et al. 2018; Zari et al. 2019; Cao et al. 2022). Armstrong & Tan (2024) also found significant asymmetry in the velocity dispersions and signatures of cluster rotation in the plane-of-sky. Putting all of these results together, they concluded that the λ Ori cluster likely formed in a sparse, substructured configuration and that it is not simply the dispersing remnant of an initially bound monolithic cluster that began to expand after the dispersal of its parent molecular cloud. The asymmetric kinematic signatures, and the discovery of a group of candidate ejected cluster members in particular, suggest a more complex dynamical history for the λ Ori cluster.
We sought to estimate the kinematic ages for clusters Collinder 95, NGC 2264, and Collinder 359, building on methods developed by Armstrong & Tan (2024) (Paper I). We established a robust list of probable YSOs in these clusters through a combination of spectroscopic youth indicators and Gaia DR3 variability YSO flags (Marton et al. 2023). We created a robust list of YSOs, and using their precise Gaia astrometry, we calculated the kinematic ages of clusters Collinder 95 and NGC 2264, omitting Collinder 359 due to an insufficient amount of identified YSOs (N < 10). We then compared these kinematic age estimates to traditional isochronal age estimates using both the Baraffe et al. (2015) and PARSEC models (Marigo et al. 2017), and we inferred the likely formation history and subsequent evolution of these clusters.
2 Data
In our analysis, we combined existing kinematic data from Gaia DR3 with new optical spectroscopic observations of low-mass PMS candidates to create a lists of YSO candidates for each target young cluster. We then performed a kinematic age analysis on these samples.
2.1 Target selection
The target clusters were chosen for their relatively young estimated isochronal ages, making them prime targets for an indepth and insightful kinematic age analysis. They were also selected due to their relatively close line-of-sight distance (<1 kpc), allowing spectra to be obtained for the more numerous lower-mass cluster members. The majority of the known YSO populations of these clusters are also within a 1° diameter on the sky, meaning we could observe both the central cluster core and sparse halo within the MMT field of view.
NGC 2264 is a nearby massive young cluster (–760 pc, –3 Myr; Venuti et al. 2018), second only to the Orion Nebula Cluster in terms of proximity, mass and well-defined PMS population (Dahm 2008), where star formation is still ongoing within its parental cloud. PMS members of NGC 2264 have been identified with X-ray observations (e.g., Flaccomio et al. 2006; Guarcello et al. 2017), photometric variability (Cody et al. 2014), Hα emission (Dahm & Simon 2005) and other spectroscopic youth indicators (GES; Venuti et al. 2018), belonging to a total population of >700 (Dahm & Simon 2005), exhibiting hierarchical structure with multiple subclusters, in particular, two embedded star-forming clumps (NGC 2264 N / S Mon and NGC 2264 S / Cone Nebula Cluster) are surrounded by a halo of older sparsely distributed YSOs (Sung et al. 2008), indicating an extended period of sequential star formation with a complex dynamical history (Nony et al. 2021; Flaccomio et al. 2023).
In addition, 2.5 degrees west of NGC 2264 lies the relatively understudied young cluster Collinder 95, of similar age and distance (Cantat-Gaudin et al. 2020a). Both of these young clusters are associated with an extensive molecular cloud complex which has been found to contain a sparse, widely distributed population of YSOs (Mon OB1; Rapson et al. 2014), as well as many protostars, again suggesting multiple epochs of star formation in this region.
Collinder 359 was chosen for similar reasons, being a young open cluster at close distance of 250 pc (Lodieu et al. 2006). While young, at –30 Myr, Collinder 359 is estimated to be significantly older than NGC 2264 and Collinder 95, which aligns with us ultimately identifying the fewest number of YSOs in Collinder 359 out of all three clusters.
Candidates YSO members of these clusters were selected by fitting low-mass PMS Baraffe et al. (2015) isochrones to Gaia estimates of BP - RP color and G-band magnitude values for stars across all three cluster fields. YSO candidates located above younger isochrones in the color-magnitude diagram were given greater target priorities for observations. Targets were selected in the Gmag range 14-17.5 for NGC 2264 N & S and Coll 95 and range 13-17 for Coll 359 with the goal to find low-mass (~1.0–0.3 M⊙) cluster members and to keep fiber cross-talk in the observations to a minimum. Targets were also selected within parallax range 2.2–1.0 mas to be in the right distance range ~700 ± 300 pc for NGC 2264 and Coll 95, with a parallax >1.25 mas for Coll 359, and selected with RUWE < 1.4 to prioritize cluster members with reliable Gaia astrometry.
MMT-HectoSpec has a 1 degree diameter field of view and 300 fibers, which sets the limit for number of targets we can observe per field. The final list of targets are selected after running a fiber-configuration algorithm in “xfitfibs”, which calculates the optimal arrangement of fibers on targets without fibers crossing and with sufficient space between them (20 arcseconds), whilst weighting target priorities. This means that targets in denser regions are more difficult to allocate fibers to, biasing selection away from targets in the core of a cluster, but sampling the sparse cluster halo well.
Central coordinates in RA, Dec for observed fields were (100.2, 9.7) for NGC 2264, including both N & S subclusters in the same field of view, (97.8, 10.0) for Coll 95 and (270.4, 3.1) for Coll 359. As well as ~250 science targets within a 1 degree diameter of these central positions, 30-40 HectoSpec fibers were allocated to empty sky for sky spectrum subtraction. Candidate guide stars were also selected from Gaia in the Gmag range 1215 and are used at the edge of the HectoSpec field, not on the surface where the fibers are positioned.
2.2 Data reduction
Using these isochronally selected YSO candidates, we observed >600 stars in four nearby young clusters (NGC 2264 N, NGC 2264 S, Collinder 95, and Collinder 359) using the MMT/Hectospec spectrograph. We observed using the 270 line mm−1 grating in the optical range (–3700–9150 Å) in order to identify and flag broad Hα emission lines and lithium absorption lines - features indicative of low-mass YSOs which are still in their PMS evolution (Soderblom 2010).
Collinder 95 was observed on February 27, 2022 (3 × 40 minute exposures); NGC 2264 on March 1, 2022 (3 × 40 minute exposures); and Coll 359 on April 4, 2022 (4 × 40 minute exposures). For each night of observations bias, dark, domeflat and sky flat fields were taken as well as the target fields, and data reduction including sky subtraction and cosmic ray rejection was performed using the HSRED v2.0 pipeline. Ultimately, there were 202 combined spectra obtained in the Collinder 95 cluster with a median S/N of 36.07, 200 in the NGC 2264 N & S clusters with a median S/N of 30.5, and 212 in the Collinder 359 cluster with a median S/N of 53.1.
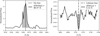 |
Fig. 1 Left : example Hα spectrum of the YSO candidate (Gaia Source ID: 3326702657541965952) from NGC 2264, with the source selected as a YSO due to its strong Hα line, i.e., with an EW(Hα) = −48.97 Å. Right : example 6708 Å Li spectrum of the YSO candidate ( Gaia Source ID: 3326714782234731520) from NGC 2264, with this source selected as a YSO due to its strong Li absorption line, i.e., with EW(Li) = 0.32 Å. |
3 Young stellar object identification
There are a few spectral features which can be used to identify young PMS stars. A strong Hα emission line (6564 Å), caused by residual accretion and/or enhanced chromospheric activity, appears in spectra for stars <10 Myr (Classical T Tauris; CTTs), whereas a strong lithium absorption line (6708 Å) is visible in spectra for PMS stars <20 Myr (Soderblom 2010). Once the base of the convection zone in PMS stars reaches 3 × 10⁶ K, Li is rapidly depleted, on a timescale dependent on their spectral type, which makes the presence of the Li line a strong discriminator between PMS stars and older field stars.
We measured the equivalent widths (EWs) using standard procedures. We fit the continuum of a spectrum and normalize. We then used the python package specutils to measure EWs of Hα specifying the spectral region 6564 ± 30 Å and of Li specifying the spectral region 6707.8 ± 2 Å. Uncertainties were estimated as 1.5 × √FHWM × p/S /N, using the Full Width at Half Maximum (FWHM) of the same spectral region, with p as the size of one pixel in the spectrum in wavelength units. The S/N was also estimated from the spectrum using specutils.
We searched for prominent Hα emission and lithium absorption lines in the spectra of our observed candidate cluster members, quantified by their EW values. We identified YSO candidates if they have |EW(Hα)| > 10 Å or EW(Li) -σEW(Li) > 0.15 Å, as these are established thresholds for these spectroscopic indicators of youth (e.g., Žerjal et al. 2021; Armstrong et al. 2022). Two example YSO candidate spectra are shown in Fig. 1. In Fig. 2 we plot EW(Hα) versus EW(Li) for all the stars observed in our target clusters with the YSO criteria thresholds indicated as dashed lines.
We found 124 YSOs in NGC 2264, 35 in Collinder 95, and 7 in Collinder 359 using these spectroscopic indicators of youth.
To complement this sample of probable YSOs, overlapping with the same field of view we add in YSOs flagged by Gaia DR3 variability (Marton et al. 2023): 268 YSOs in NGC 2264, 104 in Collinder 95, and 2 in Collinder 359. We also quality filtered in this step, rejecting stars with parallaxes <1 mas, with a G-band mean flux divided by its error of less than 50, an integrated RP mean flux divided by its error of less than 20, an integrated BP mean flux divided by its error of less than 20, or with five or fewer visibility periods.
We assessed if there is likely to be any level of contamination in the Gaia varYSO sample using a control field estimation approach (described in Appendix. A). Overall, we found no evidence that there is any significant contamination in our YSO sample.
Our criteria for identifying YSOs used observations at optical wavelengths. Thus, heavily extincted YSOs within the densest regions of NGC 2264 may be preferentially missed.
Between these two methods of YSO identification - spectroscopic and the Gaia DR3 variability catalog - some stars were flagged using both methods. Stars that were flagged by both methods numbered 38 in NGC 2264, nine in Collinder 95, and two in Collinder 359. A star was listed as a YSO in the final tally if it was flagged by either method.
A detailed breakdown of the number of YSOs identified via each method in each cluster is available in Table 1. Using these two methods, we generated a list of robust YSO candidates, ultimately selecting a total of 354 YSOs in NGC 2264, 130 in Collinder 95, and 7 in Collinder 359.
In Fig. 3 we plot a Gaia BP - RP color absolute G magnitude diagram of selected YSOs in NGC 2264 (red) and Collinder 95 (blue). YSOs identified by spectroscopic criteria are marked as empty circles, while YSOs identified by Gaia variability are marked by smaller solid circles. YSO identified by both criteria appear as larger solid circles. Overplotted are 1, 2, 5, 10, and 30 Myr isochrones and 0.2, 0.5 & 0.8 M⊙ tracks from Baraffe et al. (2015) evolutionary models. Absolute G magnitudes are calculated using cluster distances given in Table 2, using 722 pc for NGC 2264 as a whole. Most YSOs appear above the 5 Myr isochrone, consistent with previous age estimates. YSOs appearing below, and thus older, are likely more extinct, as these magnitudes do not yet take into account extinction and reddening.
NGC 2264 has been studied using a variety of observational data. Flaccomio et al. (2023) combined X-ray observations with Gaia EDR3 data, as well as public optical and IR photometry from many sources, to study over 2000 candidate members of NGC 2264 in a 2.5 × 2.5° area. Out of our 354 YSOs in NGC 2264, 332 of them match with their sample. Venuti et al. (2018) observed candidate members of NGC 2264 as part of the Gaia-ESO spectroscopic survey (Randich et al. 2013), of which 239 match with our sample. Hunt & Reffert (2024) select candidate cluster members for both NGC 2264 and Collinder 95 by their similar proper motions. In total, 94 of our 354 NGC 2264 YSOs match with their NGC 2264 sample, 43 match with an extended population they name MonOB1-D, and 81 of our 130 YSOs in Collinder 95 match with their membership for Collinder 95.
Overall, there is significant overlap between our YSOs and all of these literature samples. However, when using new spectroscopic observations and Gaia DR3 varYSOs, we were able to identify YSOs previously missing from these lists.
These studies have also differed in their structural decompositions of NGC 2264 in particular. Kuhn et al. (2014) define eight subclusters within NGC 2264, six of which have only 10-20 member stars each. Flaccomio et al. (2023) define ten subregions. On the other hand, Cantat-Gaudin et al. (2020a) only report one cluster named NGC 2264, and Hunt & Reffert (2024) report NGC 2264 and Mon OB1-D. Wright et al. (2024) also adopt a two-region division between the S Mon and Spokes clusters, which is largely equivalent to our north and south division. As the goal of our analysis is to robustly measure broad kinematic trends, such as cluster expansion, we refrain from separating the YSO sample into the smallest possible spatial components, which are not necessarily distinct in velocity space (Flaccomio et al. 2023). Rather, we favor the straightforward division of NGC 2264 into its two main subclusters, which are distinct spatially and kinematically (Sung et al. 2008; Wright et al. 2024).
Number of identified YSOs in each cluster, separated by identification method.
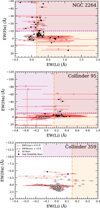 |
Fig. 2 Scatter plots of Hα EW vs. lithium EW for all the stellar spectra in our samples of clusters NGC 2264 (N & S), Collinder 95, and Collinder 359. If a star has an EW(Hα)−σ < −10 Å (above the horizontal dashed purple line) or an EW(Li)−σ > 0.15 Å (right of the vertical dot-dashed orange line), it is flagged as a YSO. Gaia variability catalog stars are additionally marked with a closed circle. |
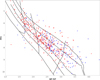 |
Fig. 3 Gaia BP - RP color absolute G magnitude diagram of selected YSOs in NGC 2264 (red) and Collinder 95 (blue). The YSOs identified by spectroscopic criteria are marked as empty circles, while YSOs identified by Gaia variability are marked by smaller solid circles. The YSOs identified by both criteria appear as larger solid circles. Overplotted are 1, 2, 5, 10, and 30 Myr isochrones and 0.2, 0.5, and 0.8 M⊙ tracks from Baraffe et al. (2015) evolutionary models. Absolute G magnitudes were calculated using cluster distances given in Table 2, using 722 pc for NGC 2264 as a whole. |
Physical properties of NGC 2264 N, NGC 2264 S, and Collinder 95.
4 Kinematic analysis
We then used this population of YSOs to conduct a kinematic analysis of the star clusters, excluding Collinder 359, as its sample contained too few identified YSOs to produce statistically significant results. Therefore, we only conducted kinematic analyses of the YSOs in the star clusters NGC 2264 N, NGC 2264 S, and Collinder 95.
4.1 Internal proper motions
The cluster frame motion was found by subtracting out the mean cluster proper motion from that of each YSO. The adopted mean proper motions, radial velocities, center locations and half-mass radii r50 of each cluster are listed in Table 2.
We use center coordinates from existing literature (see Table 2), while YSO half-mass radii are derived from our identified YSO population, calculated by taking the median radial distance from cluster center of all member YSOs. In particular, we check recent cluster catalogs with membership based on Gaia (e.g., Cantat-Gaudin et al. 2020a; Hunt & Reffert 2024) for cluster parameters. For Collinder 95 we take central coordinates, proper motions and distance from Cantat-Gaudin et al. (2020a). However, for NGC 2264, these catalogs do not distinguish between the two apparent subclusters, NGC 2264 N & S. Instead, we use cluster parameters for NGC 2264 N & S from Maíz Apellániz (2019), except for the central proper motions of NGC 2264 S, which in Maíz Apellániz (2019) are given as identical to NGC 2264 N. For the central proper motions of NGC 2264 S we take the median proper motion of our confirmed YSOs with Dec < 9.7°.
The cluster frame proper motions of the YSOs in each cluster are visualized in Fig. 5. These plots show arrows denoting each star’s plane of sky motion with the direction of this motion color coded according to the color wheel in the top left corner. Gaia YSOs and spectroscopically identified YSOs are marked differently on the plots for clarity. In Fig. 5 the distinct proper motions of NGC 2264’s two subclusters become clear through the plotted vectors. We note that YSOs outside the half-mass radii, indicated using dashed circles, appear to be preferentially moving away from the cluster centers, which is particularly apparent for NGC 2264 N and Collinder 95.
4.2 Tangential velocities
Virtual expansion is the projection effect in plane-of-sky motions created when a population of stars is receding or approaching in the line-of-sight. We corrected for this effect using equations provided in Brown et al. (1997) using each cluster’s bulk radial velocity as provided in the Cantat-Gaudin et al. (2020a) catalog. We used a Markov chain Monte Carlo (MCMC) approach to sample uncertainties from the posterior distribution for the final corrected tangential velocities vl and vb, similar to the approach used by Armstrong & Tan (2024). We use these velocities in our subsequent kinematic analysis.
We searched for signs of expansion in the plane-of-sky among our YSOs by measuring the angle between each star’s virtual expansion corrected tangential velocities relative to the cluster frame and the vector between the cluster center and the YSOs sky position, which we denote as ∆θ. We plotted histograms of Δθ, producing the distributions shown in Fig. 4 for all three clusters. If there is an expanding halo of YSOs in these clusters, we expect a substantial peak to be present around zero degrees. We observed this trend for NGC 2264 N and Collinder 95, but not for NGC 2264 S.
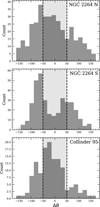 |
Fig. 4 Expansion direction histograms of YSOs in NGC 2264 N, NGC 2264 S, and Collinder 95, where the measured angle, Δθ, is the difference in a YSO’s direction of motion from pure radial outward motion from the cluster center. We observed that there is a large proportion of stars near zero (±50°) for NGC 2264 N and Collinder 95, indicating that there is significant outward expansion of YSOs from their cluster centers. We did not observe this same trend for NGC 2264 S. The shaded region shows a range of ±50°, defining a subset of YSOs with the strongest radial expansion. |
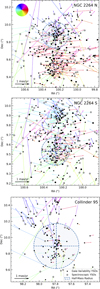 |
Fig. 5 Proper motion maps of YSOs in NGC 2264 N, NGC 2264 S, and Collinder 95. Stars flagged as YSOs via our spectroscopic analysis are marked with an open circle, while YSOs flagged through the Gaia variability catalog are marked with smaller black point. (Stars flagged by both indicators are denoted through a filled in circle/larger black point.) The proper motion of each YSO is shown with an arrow which is color coded according to the direction of motion. The average motion of each cluster or subcluster has been subtracted out (see these values in Table 2), allowing us to observe the plane of sky motion of each YSO within the cluster frame. The center of the cluster is denoted by the intersection point of the dotted two lines. The dotted blue circle denotes the half-mass radius of the identified YSOs in each cluster. |
4.3 Average expansion velocities
Another indicator for cluster expansion is the median cluster expansion velocity ῡout, i.e., the average of their radial tangential velocities. Following the approach described in Armstrong & Tan (2024), we calculated the expansion velocity vout for individual YSOs with additional perturbations to their velocities randomly sampled from their respective uncertainties, and the median expansion velocity of the YSO sample is reported. This was repeated for 1 000 000 iterations, and the median of the posterior distribution was taken as the cluster expansion velocity ῡout. The uncertainties on the cluster expansion velocity are then taken as the 16th and 84th percentile values of the posterior distribution. Note, for the purpose of allocating YSOs to either NGC 2264 N or S clusters for this calculation of cluster expansion velocity, we only included YSOs within a 0.17° radius of the central position of either cluster when calculating ῡout to restrict the sample to YSOs in the dense clusters, rather than the sparse surrounding population. Expansion velocities and uncertainties for each cluster are presented in Table 2.
We find that NGC 2264 N has  km/s, NGC 2264 S has
  km/s and Collinder 95 has
  km/s. These positive median velocities provide evidence of 4σ, 2σ and 6σ significance, respectively, that these clusters are expanding.
These velocities are lower than the expansion velocity found for λ Ori of  km/s by Armstrong & Tan (2024), but are comparable to the expansion velocities found for δ Sco and σ Sco subregions of Upper Scorpius by Armstrong et al. (2025), and sit in the middle of the range of expansion velocities calculated by Kuhn et al. (2019); Wright et al. (2024) for various nearby young clusters. In particular, Kuhn et al. (2019) measured expansion velocities of ῡout = 0.39 ± 0.15 km/s for S Mon (NGC 2264 N) and ῡout = 0.36 ± 0.40 km/s for IRS 1 (NGC 2264 S; but further divided into IRS 1 and IRS 2), while Wright et al. (2024) measured expansion velocities of
  km/s for S Mon (NGC 2264 N) and
  km/s for the Spokes cluster (NGC 2264 S). Our expansion velocity for NGC 2264 N is in close agreement with those from both Kuhn et al. (2019) and Wright et al. (2024), while our expansion velocity for NGC 2254 S agrees well with that from Wright et al. (2024), but the further division of NGC 2264 S into IRS 1 and IRS 2 groups by Kuhn et al. (2019) makes it difficult to make a direct comparison with their results.
4.4 Areal number density profiles and cluster core sizes
We investigated the radial density profiles of the clusters and defined the radii of the cluster cores using the same approach as Armstrong & Tan (2024). We binned cluster members by increasing radial distance from the cluster center, R. We calculated the areal number density, N*, of each bin. The resulting radial areal number density profiles are shown in Fig. 6.
We define the core radius of a cluster, rc, as the radius at which the density is half the peak density, which is rc = 0.65 pc for NGC 2264 N, 1.40 pc for NGC 2264 S and 1.27 pc for Collinder 95. We find that 24, 72 and 26 cluster members are located within the core radii of NGC 2264 N, NGC 2264 S and Collinder 95, respectively.
Incompleteness in the cluster sample may affect the determination of core radii rc , particularly if crowding effects or differential extinction cause YSOs in the cluster cores to be more difficult to identify than elsewhere. This may cause rc to be slightly overestimated. However, robustly quantifying these effects and propagating these into our radii estimations is beyond the scope of this paper.
The areal density profiles of NGC 2264 N and Collinder 95 smoothly decrease with increasing radius, while the profile of NGC 2264 S has its peak density offset from the central coordinates. This is likely due to the substructure that Kuhn et al. (2019) defined as the IRS 1 and IRS 2 subgroups of the cluster, both of which are contained within our resulting core radius for NGC 2264 S.
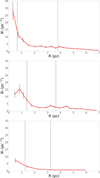 |
Fig. 6 Radial profiles of areal stellar number density profiles of NGC 2264 N (top), NGC 2264 S (middle), and Collinder 95 (bottom). Vertical dashed lines indicate the core radii (rc), as defined in Sect. 4.4, and the half-mass radii (r50). |
4.5 Velocity dispersions and crossing times
We calculated the velocity dispersions in each cluster using the same Bayesian inference approach described in Armstrong & Tan (2024). We modeled the velocity distributions as 2D Gaussians with free parameters for the central velocity, μ, and velocity dispersion, σ, in each dimension. We then added an uncertainty randomly sampled from the observed uncertainty distribution in each dimension for each star in a cluster. We sampled the posterior distribution function with MCMC, using an unbinned maximum likelihood test to compare the model and observations. As a prior, we required that velocity dispersion be greater than 0 km s−1. We repeated this process for 2000 iterations with 1000 walkers, the first half of which were discarded as burn-in. We then took the median of the posterior distribution as the best fit for each free parameter and the 16th and 84th percentiles as their respective 1σ uncertainties.
With this approach we calculated the velocity dispersions for cluster members within the cluster cores and for cluster members within the cluster half-mass radii using their virtual-expansion corrected tangential velocities (vl, vb). Using these velocity dispersions along with our previous estimates of cluster core radii and half-mass radii, we estimated the crossing times for core radii τcross(rc) and half-mass radii τcross(r50) of each cluster. Both 1D velocity dispersions σvl, σvb and crossing times are given for each cluster in Table 2, along with their respective uncertainties.
Notably, while the velocity dispersions in the cluster cores of NGC 2264 N & S are relatively low (<2 km/s) and would not be unusual for gravitationally bound clusters, the velocity dispersion for the core of Collinder 95 is relatively large (>4 km/s). Given the sparseness of the cluster, this suggests it was born with a relatively high velocity dispersion and was gravitationally unbound from an early time (see Sect. 5.3).
However, to properly assess gravitational boundedness requires assessment of the virial state of the clusters. This in turn requires estimates of each cluster’s total mass, which is complicated by the incompleteness of our YSO sample.
For all three clusters, velocity dispersions of YSO members within their half-mass radii are relatively high (>2 km/s). In the cases of NGC 2264 N & S, these velocity dispersions are significantly greater than those of their cluster cores, indicating that the halos of YSOs surrounding the cores of each cluster are likely not gravitationally bound and are dispersing. In Collinder 95 these velocity dispersions seem isotropic, while in NGC 2264 N & S, velocity dispersions in the directions of Galactic longitude and latitude (σv,l,σv,b) are anisotropic at the 3σ and 2.5σ significance levels, respectively.
4.6 Traceback ages
We calculated each cluster’s kinematic age τkin,CA by “tracing back” each star to its moment of closest approach to the cluster center, assuming constant velocity. We repeated this calculation N = 10000 times, each time adding a random (normal) amount of the proper motion error to the proper motion of each star. This generated a distribution of kinematic ages for each star, which we could then use to find the estimated error bounds (16th and 84th percentiles) of each star’s kinematic age. From this, we were able to calculate a kinematic age value with error estimates for each star in each stellar cluster. We then used the distribution of the YSO kinematic ages in a cluster to estimate the overall kinematic age value of the cluster. For YSOs in NGC 2264, we calculated kinematic ages relative to either the N or S subcluster centers regardless of location.
We performed these calculations for all YSOs consistent with being closer to the cluster center in the past, i.e., |Δθ| < 90°, as well as the subset consisting only of YSOs with a particularly strong outward expansion from the cluster center, i.e., those with |Δθ| < 50°, as denoted by the vertical dashed lines in Fig. 4. These distributions of kinematic ages are shown in Fig. 7.
For NGC 2264 N, the median kinematic age of all YSO cluster members with |Δθ| < 50°is τkin,CA = 1.08 Myr with a standard deviation of ±1.64 Myr. For NGC 2264 S, the median kinematic age of such YSO cluster members is τkin,CA = 0.61 Myr with a standard deviation of ±0.51 Myr. For Collinder 95, the median kinematic age of such cluster members is τkin,CA = 0.94 Myr with a standard deviation of ±0.84 Myr. All of our kinematic age estimations are listed in Table 3.
When we further restrict the population we are considering to only YSOs whose current distance from cluster center is greater than the half-mass radius (R > r50), shown as dashed circles in Fig. 5, and whose final closest approach distance from cluster center is less than the cluster’s half-mass radius, we observe the median kinematic age values of each cluster increase slightly. The half-mass radius used here is calculated as the smallest radius that includes half of our identified YSOs in each group (Sect. 4.1). We note that selection bias of spectroscopic targets away from the dense cluster cores (because of fiber crowding) might bias the half-mass radius that we calculate from our sample to moderately larger values. The half-mass radii for each cluster are listed in Table 2.
When filtering only for YSOs whose current position is outside our half-mass radius and whose closest approach distance was inside of it, we find that: for NGC 2264 N, the median kinematic age shifts to 1.81 Myr with a standard deviation of 1.47 Myr; for NGC 2264 S, the median kinematic age shifts to 1.14 Myr with a standard deviation of 0.57 Myr; for Collinder 95, the median kinematic age becomes 1.62 Myr with a standard deviation of 0.77 Myr. We can observe this increase clearly in Fig. 7. These values are listed also in Table 3.
We also consider how many cluster members have their closest approach to the cluster centers within the core radii of each cluster, as defined in Sect. 4.4, and which are currently located outside the cores. We list the number of YSOs per cluster with closest approach distances within the core radii with different tolerances according to the uncertainties on their closest approach distances in Table 2.
5 Age comparison
5.1 Correcting for extinction
We then seek to compare the kinematic age estimates calculated in the previous section to the isochronal ages of each cluster. To calculate these isochronal ages, we first correct our YSOs for reddening and extinction. Using extinction values from the STARHORSE catalog (Anders et al. 2022) and Gaia DR3 data, we create a local extinction “map” to estimate extinction values of all YSOs in our clusters. The map consists of 0.2° RA by 0.2° Dec cells as shown in Fig. 8.
We then took the median STARHORSE AG extinction values of all stars within each RA-Dec cell, only including stars within a certain range of parallax values. For NGC 2264, the range of parallaxes present in our YSOs is 1.018-2.958 mas, so when picking from the extinction catalog, we only included stars between 0.95 and 3.0 mas. For Collinder 95, the range of parallaxes present in our YSOs is 1.037-2.818 mas, so when picking from the extinction catalog, we only included stars between 0.95 masand 2.9 mas.
Then, we assign this median extinction value to all YSOs located within that cell. Using this method, we generate estimated extinction values for all YSOs in our sample, along with error bounds on these values (the 16th and 84th percentiles.) The minimum amount of catalog stars in each cell used to calculate these median and error bounds is Nmin = 31 for NGC 2264 and Nmin = 20 for Collinder 95. The extinction values estimated for each cell are visualized in Fig. 8. We follow the same approach for ABP & ARP in order to also estimate reddening values in the Gaia photometric bands.
Median kinematic and isochronal ages for NGC 2264 N, NGC 2264 S, and Collinder 95 across several YSO subpopulations.
5.2 Calculating isochronal ages
To estimate the isochronal ages riso for cluster members, we use the Baraffe et al. (2015), PARSEC (Marigo et al. 2017) and SPOTS (Somers et al. 2020) stellar isochrone models. The Baraffe et al. (2015) model specializes in PMS stars and low-mass MS stars, with a mass range of 0.01–1.4 M⊙, while the PARSEC model has a mass range >0.1 M⊙. The SPOTS models occupy a smaller mass range 0.08–1.3 M⊙, but are distinguished by having parameters for spot coverage fraction Fspot and spot temperature ratio Xspot. Here we assume Fspot = 0.35 and Xspot = 0.9 and use the corresponding set of isochrones, as was done for the λ Ori cluster by Armstrong & Tan (2024).
We start with the Baraffe et al. (2015) stellar isochrones. Following the method of Armstrong & Tan (2024), for each star in each cluster, we compare each individual star to a series of ∼960 Baraffe et al. (2015) isochrones with ages ranging from ∼0.5 to 10000 Myr. For each star, we iterate the calculation N = 100 times, each time multiplying the error on the extinction value with a value randomly sampled from a normal distribution N ∼ (0,1) and add this to the star’s median extinction value. Then, we use this new perturbed extinction value to find the isochrone closest to this star’s G-band magnitude and BP - RP color. Typical uncertainty in absolute Gmag due to Gaia DR3 parallax uncertainty for YSOs with ruwe < 1.4 in our sample is of order ∼0.12 mags. Combining this in quadrature with the typical AG uncertainty of ∼ 1.0 mag for these sources yields a net increase of <0.01 mag in absolute G mag. Even for the lowest AG uncertainty of any cell in our extinction grid (0.246 mag), the net increase by combining these in quadrature is ∼0.025 mag. Uncertainty for apparent photometric magnitudes in Gaia DR3 are yet much smaller than this. This shows that the extinction uncertainty dominates the uncertainty propagated into the isochronal age estimation, hence we simplify the age-estimate procedure by treating these other uncertainties as negligible. We then do the same for the G-band magnitude and G - RP color. From this series of N = 100 iterations, we were able to generate a distribution of isochronal ages for each star for both the BP-RP and G-RP isochrones. Then, we take the median age as the isochronal age value for that star. We also take the 16th and 84th percentiles of this distribution as the upper and lower error bounds on this value. From this process, we were able to calculate the Baraffe et al. (2015) isochronal ages for each individual star for either the BP - RP or G - RP color. We follow the same approach to estimate ages using PARSEC (Marigo et al. 2017) and SPOTS (Somers et al. 2020) isochrones.
Median isochronal ages for each cluster are given in Table 3. Particularly noticeable is the clear difference between ages estimated using either BP – RP or G – RP colors. Using Baraffe et al. (2015) models, ages estimated using G – RP color are consistently younger than ages estimated using BP – RP color, while using Marigo et al. (2017) models, ages estimated using G – RP color are consistently older. These discrepancies in ages estimated using different stellar evolution models and different colors have been seen for other nearby young clusters and associations in the literature (e.g., Ratzenböck et al. 2023; Armstrong & Tan 2024; Fajrin et al. 2025).
We also note the 0.0 Myr median ages for Collinder 95 using Somers et al. (2020) models with BP – RP color in Table 3. These are due to the fact that the majority of Collinder 95 YSOs in this case are located above the youngest isochrone in the BP-RP CMD, and thus a valid age cannot be interpolated.
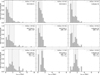 |
Fig. 7 Traceback ages (see text) of YSOs for NGC 2264 N (left column), NGC 2264 S (middle column), and Collinder 95 (right column). Each row represents a different subpopulation. First row : all identified YSOs in each cluster. Second row : YSOs with |Δθ| ≤ 50°. Third row : YSOs with |Δθ| ≤ 50° with the additional requirement of a current distance from the cluster center greater than the half-mass radius and a distance of closest approach to the cluster center of less than the half-mass radius. The median and ±1σ range of the distributions are indicated. |
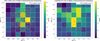 |
Fig. 8 Left : plot of the extinction correction estimation for NGC 2264 N & S. The extinction values of each cell were determined by drawing the extinction values derived from the STARHORSE code and Gaia DR3 data from a catalog of stars (Anders et al. 2022). We divided the cluster into 0.2° radial ascension by 0.2° declination cells. Then we took the median extinction value of each cell and applied it to all the YSOs within that cell, thereby estimating each YSOs’ extinction value. The YSOs are overplotted as orange crosses. The lowest number of catalog stars populating any cell is Nmin = 20 for Collinder 95 and Nmin = 31 for NGC 2264. Right : same but for Collinder 95. |
5.3 Kinematic age versus isochronal age
In Figs. B.1, B.2, and B.3 (top row) we compare the isochronal age values for each set of stellar evolution models using Gaia G – RP color (blue) and BP – RP color (black) with the kinematic ages of YSOs with position-velocity angles with ±50°. We generally expect the kinematic ages of cluster members will be lower than their isochronal ages. This is because the kinematic age calculation gives the time when a star would have been at its closest approach distance to the cluster center, but a star may have formed significantly earlier than that and only began to move away from the cluster center following residual gas expulsion around the cluster and the loss of binding mass. Therefore, isochronal age estimates should be higher than kinematic age estimates for stars that originated within the cluster, and the average difference indicates the duration of an “embedded phase” (e.g., Miret-Roig et al. 2024). In Figs. B.1 and B.2 we can see that this holds true for most YSOs in NGC 2264 N & S, as generally fewer stars are in the grayed out “forbidden” region, where isochronal age is less than kinematic age. However, many YSOs belonging to Collinder 95 are located in the ’forbidden zone’, with kinematic ages seemingly too old for their isochronal ages.
Comparing the isochronal ages for each cluster using each stellar isochrone model, in general the PARSEC (Marigo et al. 2017) models give older ages, followed by SPOTS (Somers et al. 2020) models, and the Baraffe et al. (2015) models give the youngest.
We also compare ages for subsets of cluster members filtered on closest approach distance in Figs. B.1, B.2, B.3, requiring the closest approach distance <rc (lower rows) or closest approach distance <rc within the 1σ uncertainty (middle rows), and that the YSO is located outside the core radius rc.
In Figs. B.4, B.5, B.6, half-mass radius (r50) is used rather than core-radius (rc), with the additional requirement that the YSOs’ closest approach distance is within r50, while their current distance is outside of r50. (In Fig. B.7 some YSOs have BP-RP τiso,SPOTS = 0, meaning that many are located above the SPOTS log(Age) = 4 isochrone - likely because their extinction is not well estimated or they are binaries. Nevertheless, these younger ages (<0.5 Myr) are unreliable. There are fewer zeros in the GRP isochronal ages than in the BP-RP isochronal ages; therefore, G-RP is used in Figs. B.1, B.2, & B.3.)
For both NGC 2264 N & S clusters the majority of cluster members have isochronal ages greater than their kinematic ages. However, for Collinder 95 there are still a significant number of member YSOs with Tkin,CA > τiso for any stellar evolution model, which thus inhabit the “forbidden” zone. A possible interpretation of this would be that YSOs in the “forbidden” zone did not originate from their position of closest approach to the cluster center, but from an initially sparser distribution, and thus Tkin,CA are overestimated ages. Alternatively, there is also the possibility that all of our isochronal age estimates are underestimated, either due to underestimated reddening or because the stellar evolution models themselves systematically underestimate ages for YSOs in this mass range.
Furthermore, instead of comparing the kinematic ages and isochronal ages of individual cluster members, we can also consider the cluster as a whole. We find that the median kinematic age values for all three clusters are lower than the median isochronal age values in nearly all cases, as seen in Fig. B.7, for both the Baraffe et al. (2015) and PARSEC isochrones. Here, we can see clearly that the Baraffe et al. (2015) isochrones yield much lower ages than the PARSEC isochrones. Furthermore, in Fig. B.7 we also note again that, as expected, very few cluster medians fall in the gray “forbidden” zone where isochronal ages are less than kinematic ages (see also Miret-Roig et al. 2024).
5.4 Age spread
In each cluster, we look for evidence of significant spread in each of τkin,CA and τiso estimated using each set of stellar evolution models. Following the same approach as Armstrong & Tan (2024), we calculate the difference between τ for individual cluster members and the sample mean τ and normalize by the uncertainty of τ for each cluster member, removing the largest 10% as outliers. We report the median normalized age differences, στ,kin,CA and στ,iso, per cluster in Table 4.
Overall, the evidence of isochronal age spread στ,iso is uncertain, i.e., the significance of the spread depends strongly on the models used to estimate ages and even on the photometric colors used for the same set of models, but is not strongly dependent on the filtering of cluster members by closest approach distance. In particular, στ,iso using G - RP color is rarely >3 within any stellar evolution models.
We did not find evidence of kinematic age spread στ,kin,CA in all clusters, and particularly, στ,kin,CA is significant for cluster members whose closest approach distance is < rc in each cluster. This likely indicates for NGC 2264 N & S, which have dense and compact cores, that cluster members have gradually been ejected or become unbound from the cluster cores over their lifetimes (2-3 Myr). For Collinder 95, which is sparse and likely was not as compact at formation as NGC 2264 N & S, the kinematic age spread is more likely a result of kinematic ages being overestimated for YSOs that did not originate from their closest approach positions, i.e., the same reason as why many cluster members inhabit the “forbidden” zones of Fig. B.3.
5.5 Cluster halos
We compare the distributions of the clusters halos in λ Ori (Armstrong & Tan 2024), NGC 2264 N & S, and Collinder 95, defined as cluster members consistent with originating within the cluster core radii rc within 1σ of their closest approach distance (blue; Fig. 9). We show their spatial distributions, histograms of relative velocity orientation Δθ and isochronal ages, τiso, according to PARSEC models (Marigo et al. 2017) using Gaia BP – RP color against traceback timescale to closest approach, τkin,CA (Fig. 9).
The distributions of halo members for each cluster are distinct. For NGC 2264 N & S, the majority of halo members are located within each cluster’s half-mass radius r50, have wider distributions of Δθ, though still with peaks close to 0°, and have young traceback ages, τkin,CA, generally <3 Myr and younger than their isochronal ages, τiso. For Collinder 95, the majority of halo members are located outside the cluster’s half-mass radius r50, have a narrower distribution of Δθ with a peak close to 0°, but have older traceback ages, τkin,CA, that are generally 4–14 Myr and older than their isochronal ages, τiso. For λ Ori, close to half of halo members are located outside the cluster’s half-mass radius r50 and half are within. They have a very narrow distribution of ∆θ with a peak close to 0°, but have a mix of traceback ages, τkin,CA, half of which are older than their isochronal ages, τiso, and half of which are younger.
Since the vast majority of halo members of NGC 2264 N & S have τkin,CA < τiso, they are consistent with having formed within the bound cores of these clusters, but have subsequently become unbound, likely including some via dynamical ejection, as the clusters evolve dynamically. Apart from these halo members, there is also a sparse distribution of YSOs surrounding the cluster cores which are not consistent with originating in either core. These belong to smaller substructures which could be considered part of the wider Mon OB1 association (Rapson et al. 2014; Wright 2020).
Since the majority of halo members for Collinder 95 have τkin,CA > τiso, they are not consistent with having originated within the cluster core, unless the isochronal ages τiso are severely underestimated. It is possible that many of these may have formed in smaller substructures surrounding the core, similar to the non-halo YSOs surrounding NGC 2264 N & S, but then it is striking that so many of these have velocities directed radially away from the core, consistent with overall linear radial expansion and seemingly with little random motion inherited from the turbulence of their natal cloud. The large spread of τkin,CA among halo members also indicates that they would have escaped the core of Collinder 95 gradually rather than after a single catastrophic event, such as a supernova expelling residual gas, or alternatively that they originated at a range of distances from the cluster core and have since moved radially away from it.
Even considering the possible selection bias caused by incompleteness of the YSO sample (see Sect. 3), slight underestimation of cluster core density and loss of the youngest (and heavily extinct) YSOs from our sample will likely make little difference to these conclusions. Such objects would likely have small τiso and small τkin , which thus do not effect the differences in the populations located in the ‘forbidden’ zones between NGC 2264 and Collinder 95.
As described in Armstrong & Tan (2024), λ Ori also has many halo members with τkin,CA > τiso, but most of these disappear with a more restrictive filter on closest approach distance leaving only candidate ejected stars with timescales compatible with other age estimates (<4 Myr), unlike with Collinder 95 (see Fig. B.3). The significant substructure surrounding the cluster core, which appears to be inconsistent with originating from it, similar to NGC 2264, has led to the conclusion that much of this population formed sparsely distributed and hierarchically structured (Kounkel et al. 2018; Armstrong & Tan 2024).
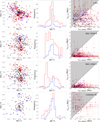 |
Fig. 9 Spatial coordinates (left column), with the cluster core radii (rc) and half-mass radii (r50) indicated as black circles; relative velocity orientation (Δθ) histograms (middle column), and PARSEC ages τiso BP-RP against traceback to the closest approach age τkin,CA (right column) for λ Ori, NGC 2264 N & S, and Collinder 95 (descending rows). Cluster members with the closest approach distance within 1σ of the core radius (rc) and with a present position outside the core radius are indicated as blue points. Other cluster members consistent with moving away from the cluster centers are indicated by red points, and cluster members not consistent with moving away from the cluster centers are indicated by black points. |
Median normalized age spreads (kinematic and isochronal) across YSO subpopulations in NGC 2264 N, NGC 2264 S, and Collinder 95.
6 Conclusions
By analyzing optical stellar spectra and flagging stars with spectral indicators of youth (|EW(Hα)| > 10 Â or EW(Li) > 1.5Â), we were able to identify 166 YSOs across several young clusters (NGC 2264 N & S, Collinder 95, and Collinder 359). Using an additional 325 YSOs flagged as variable stars by the Gaia DR3 catalog (Marton et al. 2023), we generated lists of YSOs (with N > 100) for both NGC 2264 N & S and Collinder 95 that allowed us to calculate the kinematic (or traceback) ages of these clusters. After limiting the YSOs used in the kinematic age estimation to only those with Δθ within ±50°, we found a median kinematic age of 1.08 Myr for NGC 2264 N, 0.61 Myr for NGC 2264 S, and 0.94 Myr for Collinder 95.
In all clusters, we found a significant number of YSOs outside of the cluster radii with velocities inconsistent with the origin within the cluster radii (see Fig. 5). This provides evidence of a sparse population of YSOs surrounding the dense cluster cores with a distinct substructure and kinematics, which could belong to the young stellar association Mon OB1. The existence of bound compact clusters within the volumes of sparse associations has been observed elsewhere (e.g., Vela OB2; Armstrong et al. 2022).
We compared the kinematic age values with isochronal age values for the Baraffe et al. (2015) and PARSEC (Marigo et al. 2017) stellar evolution models. As seen in Fig. B.7, although the three isochronal models give significantly different results, most models provide isochronal age estimates that are, on average, higher than our kinematic age estimates, which is consistent with YSOs forming within a more compact cluster volume and then subsequently becoming unbound and drifting away.
We found significant differences between the ages estimated when fitting stellar evolution models to YSOs in either the BP – RP or G – RP color, as can be seen in Figs. B.4, B.5, B.6, and B.7 and in the ages reported in Table 3. This indicates systematic differences between the observed photometric bands and the corresponding synthetic photometric bands predicted by stellar evolution models.
The systematic offset between the kinematic ages and isochronal estimates of 2-4 Myr according to PARSEC models in BP - RP color, for example (see Fig. B.7), has been suggested in similar recent works (such as Miret-Roig et al. 2024) as being an indication of an early period in cluster evolution where the cluster is still embedded in its parent molecular cloud for several megayears before stellar feedback expels this gas and cluster members begin to become unbound as the majority of binding mass is lost. However, this offset is not observed for all clusters. Armstrong & Tan (2024) estimated kinematic ages for the λ Ori cluster using several approaches but found that these were all in agreement with or even greater than the ages estimated in the literature using stellar evolution models. They also found evidence that the λ Ori cluster likely formed in a sparse, hierarchically structured configuration and thus was initially unbound.
Collinder 95 has a similarly sparse distribution of YSO members, a majority of which have relative motions consistent with expanding away from the cluster center. Moreover, for those YSO members consistent with being unbound from the cluster, the median kinematic age (5.8-7.5 Myr) is significantly greater than the median isochronal age estimates with all models, except for the PARSEC models using G – RP color (7.1-10.3 Myr; Table 3), which would suggest that Collinder 95 formed initially sparse and unbound. However, the uncertainty in the isochronal age estimates makes this difficult to verify. This contrasts with the NGC 2264 N & S clusters, which are more massive and densely concentrated and likely formed bound before subsequently losing cluster members a few megayears into their evolution.
Acknowledgements
I.C. acknowledges support from a Chalmers Astrophysics & Space Science Summer (CASSUM) Research Fellowship, including partial support from W&M Lundgrens grant 2022-4019. J.J.A. acknowledges support from a Chalmers Initiative on Cosmic Origins (CICO) postdoctoral fellowship. J.C.T. acknowledges support from ERC Advanced Grant MSTAR (788829). This work has made use of data from the ESA space mission Gaia (http://www.cosmos.esa.int/gaia), processed by the Gaia Data Processing and Analysis Consortium (DPAC, http://www.cosmos.esa.int/web/gaia/dpac/consortium). Funding for DPAC has been provided by national institutions, in particular the institutions participating in the Gaia Multilateral Agreement. This research made use of the Simbad and Vizier catalog access tools (provided by CDS, Strasbourg, France), Astropy (Astropy Collaboration 2013) and TOPCAT (Taylor 2005).
References
- Anders, F., Khalatyan, A., Queiroz, A. B. A., et al. 2022, A&A, 658, A91 [NASA ADS] [CrossRef] [EDP Sciences] [Google Scholar]
- Armstrong, J. J., & Tan, J. C. 2024, A&A, 692, A166 [NASA ADS] [CrossRef] [EDP Sciences] [Google Scholar]
- Armstrong, J. J., Wright, N. J., Jeffries, R. D., Jackson, R. J., & Cantat-Gaudin, T. 2022, MNRAS, 517, 5704 [NASA ADS] [CrossRef] [Google Scholar]
- Armstrong, J. J., Tan, J. C., Wright, N. J., et al. 2025, MNRAS, 543, 2349 [Google Scholar]
- Astropy Collaboration (Robitaille, T. P., et al.) 2013, A&A, 558, A33 [NASA ADS] [CrossRef] [EDP Sciences] [Google Scholar]
- Baraffe, I., Homeier, D., Allard, F., & Chabrier, G. 2015, A&A, 577, A42 [NASA ADS] [CrossRef] [EDP Sciences] [Google Scholar]
- Brown, A. G. A., Dekker, G., & de Zeeuw, P. T. 1997, MNRAS, 285, 479 [NASA ADS] [CrossRef] [Google Scholar]
- Cantat-Gaudin, T., Anders, F., Castro-Ginard, A., et al. 2020a, A&A, 640, A1 [NASA ADS] [CrossRef] [EDP Sciences] [Google Scholar]
- Cantat-Gaudin, T., Anders, F., Castro-Ginard, A., et al. 2020b, VizieR Online Data Catalog: Portrait Galactic disc (Cantat-Gaudin+, 2020), VizieR On-line Data Catalog: J/A+A/640/A1. Originally published in: 2020A&A...640A...1C [Google Scholar]
- Cao, L., Pinsonneault, M. H., Hillenbrand, L. A., & Kuhn, M. A. 2022, ApJ, 924, 84 [NASA ADS] [CrossRef] [Google Scholar]
- Cartwright, A., & Whitworth, A. P. 2004, MNRAS, 348, 589 [Google Scholar]
- Cody, A. M., Stauffer, J., Baglin, A., et al. 2014, AJ, 147, 82 [Google Scholar]
- Da Rio, N., Tan, J. C., & Jaehnig, K. 2014, ApJ, 795, 55 [NASA ADS] [CrossRef] [Google Scholar]
- Dahm, S. E. 2008, ASP Conf. Ser., 4, 966 [Google Scholar]
- Dahm, S. E., & Simon, T. 2005, AJ, 129, 829 [NASA ADS] [CrossRef] [Google Scholar]
- Fajrin, M., Armstrong, J. J., Tan, J. C., Farias, J. P., & Eyer, L. 2025, MNRAS, 537, 1320 [Google Scholar]
- Farias, J. P., Tan, J. C., & Chatterjee, S. 2019, MNRAS, 483, 4999 [NASA ADS] [CrossRef] [Google Scholar]
- Flaccomio, E., Micela, G., & Sciortino, S. 2006, A&A, 455, 903 [NASA ADS] [CrossRef] [EDP Sciences] [Google Scholar]
- Flaccomio, E., Micela, G., Peres, G., et al. 2023, A&A, 670, A37 [NASA ADS] [CrossRef] [EDP Sciences] [Google Scholar]
- Gaia Collaboration (Brown, A. G. A., et al.) 2021, A&A, 650, C3 [EDP Sciences] [Google Scholar]
- Goodwin, S. P., & Bastian, N. 2006, MNRAS, 373, 752 [Google Scholar]
- Guarcello, M. G., Flaccomio, E., Micela, G., et al. 2017, A&A, 602, A10 [Google Scholar]
- Guilherme-Garcia, P., Krone-Martins, A., & Moitinho, A. 2023, A&A, 673, A128 [NASA ADS] [CrossRef] [EDP Sciences] [Google Scholar]
- Gutermuth, R. A., Megeath, S. T., Myers, P. C., et al. 2009, ApJS, 184, 18 [Google Scholar]
- Hunt, E. L., & Reffert, S. 2024, A&A, 686, A42 [NASA ADS] [CrossRef] [EDP Sciences] [Google Scholar]
- Kounkel, M., Covey, K., Suárez, G., et al. 2018, AJ, 156, 84 [NASA ADS] [CrossRef] [Google Scholar]
- Kuhn, M. A., Feigelson, E. D., Getman, K. V., et al. 2014, ApJ, 787, 107 [Google Scholar]
- Kuhn, M. A., Hillenbrand, L. A., Sills, A., Feigelson, E. D., & Getman, K. V. 2019, ApJ, 870, 32 [CrossRef] [Google Scholar]
- Lada, C. J., & Lada, E. A. 2003, ARA&A, 41, 57 [Google Scholar]
- Lodieu, N., Bouvier, J., James, D. J., et al. 2006, A&A, 450, 147 [NASA ADS] [CrossRef] [EDP Sciences] [Google Scholar]
- Maíz Apellániz, J. 2019, A&A, 630, A119 [NASA ADS] [CrossRef] [EDP Sciences] [Google Scholar]
- Marigo, P., Girardi, L., Bressan, A., et al. 2017, ApJ, 835, 77 [Google Scholar]
- Marton, G., Ábrahám, P., Rimoldini, L., et al. 2023, A&A, 674, A21 [NASA ADS] [CrossRef] [EDP Sciences] [Google Scholar]
- Miret-Roig, N., Alves, J., Barrado, D., et al. 2024, Nat. Astron., 8, 216 [Google Scholar]
- Nony, T., Robitaille, J. F., Motte, F., et al. 2021, A&A, 645, A94 [NASA ADS] [CrossRef] [EDP Sciences] [Google Scholar]
- Pelkonen, V. M., Miret-Roig, N., & Padoan, P. 2024, A&A, 683, A165 [NASA ADS] [CrossRef] [EDP Sciences] [Google Scholar]
- Quintana, A. L., & Wright, N. J. 2022, MNRAS, 515, 687 [NASA ADS] [CrossRef] [Google Scholar]
- Randich, S., Gilmore, G., & Gaia-ESO Consortium 2013, The Messenger, 154, 47 [NASA ADS] [Google Scholar]
- Rapson, V. A., Pipher, J. L., Gutermuth, R. A., et al. 2014, ApJ, 794, 124 [Google Scholar]
- Ratzenböck, S., Großschedl, J. E., Alves, J., et al. 2023, A&A, 678, A71 [NASA ADS] [CrossRef] [EDP Sciences] [Google Scholar]
- Soderblom, D. R. 2010, ARA&A, 48, 581 [Google Scholar]
- Somers, G., Cao, L., & Pinsonneault, M. H. 2020, ApJ, 891, 29 [Google Scholar]
- Squicciarini, V., Gratton, R., Bonavita, M., & Mesa, D. 2021, MNRAS, 507, 1381 [NASA ADS] [CrossRef] [Google Scholar]
- Sung, H., Bessell, M. S., Chun, M.-Y., Karimov, R., & Ibrahimov, M. 2008, AJ, 135, 441 [NASA ADS] [CrossRef] [Google Scholar]
- Taylor, M. B. 2005, ASP Conf. Ser., 347, 29 [Google Scholar]
- Tsantaki, M., Pancino, E., Marrese, P., et al. 2022, A&A, 659, A95 [NASA ADS] [CrossRef] [EDP Sciences] [Google Scholar]
- Venuti, L., Prisinzano, L., Sacco, G. G., et al. 2018, A&A, 609, A10 [NASA ADS] [CrossRef] [EDP Sciences] [Google Scholar]
- Wright, N. J. 2020, New A Rev., 90, 101549 [NASA ADS] [CrossRef] [Google Scholar]
- Wright, N. J., Jeffries, R. D., Jackson, R. J., et al. 2024, MNRAS, 533, 705 [NASA ADS] [CrossRef] [Google Scholar]
- Zari, E., Brown, A. G. A., & de Zeeuw, P. T. 2019, A&A, 628, A123 [NASA ADS] [CrossRef] [EDP Sciences] [Google Scholar]
- Žerjal, M., Rains, A. D., Ireland, M. J., et al. 2021, MNRAS, 503, 938 [CrossRef] [Google Scholar]
Appendix A Gaia varYSO contamination
To assess the likely contamination level in our YSO sample from the Gaia varYSO catalog (Marton et al. 2023), we count the number of varYSOs found within sets of control fields located at the same Galactic latitudes as the clusters (Fig. A.1). The median counts for Gaia varYSOs with d< 1 kpc (red) in the 12 control fields is 1 source per 1 degree field of view. This strongly suggests that there is no appreciable field contamination among the Gaia varYSO sample used for these clusters.
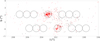 |
Fig. A.1 All Gaia varYSO sources (red < 1 kpc, black > 1 kpc) in the region surrounding NGC 2264 and Collinder 95, which are the two obvious dense regions. We plot the 1 degree MMT field of views around each cluster, as well as control fields each located at the same Galactic latitudes but ±2,±3,±4 degrees away from either cluster in Galactic longitude. |
Appendix B Supplementary figures
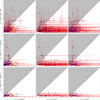 |
Fig. B.1 Kinematic age, τkin, against isochronal age, τiso, for YSOs moving away from the cluster center (top panel), for YSOs with closest approach distances within 1σ of the core radius, rc (middle panel), and for YSOs with closest approach distances within the core radius rc (lower panel), for NGC 2264 N. The plot denotes photometric color used for τiso using point color (BP – RP as black, G – RP as blue). |
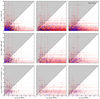 |
Fig. B.4 Kinematic age, τkin, against isochronal age, τiso, for all YSOs (top panel), for YSOs moving away from the cluster center (middle panel), and for YSOs with closest approach distances within r50 and current distances outside of r50 (lower panel), for NGC 2264 N. The plot denotes photometric color used for τiso using point color (BP-RP as black, G-RP as blue.) |
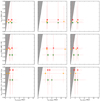 |
Fig. B.7 Median kinematic ages (τkin) versus their median isochronal ages (τiso) for clusters NGC 2264 N (red), NGC 2264 S (green), and Coll 95 (orange). The plot is divided into nine panels, with the three subgroups as rows: all YSOs (top panel), YSOs moving away from the cluster center (middle panel), and YSOs with closest approach distances within r50 and current distances outside of r50 (lower panel). Columns denote the different isochrone models used, with Baraffe (left), PARSEC (middle), and SPOTS (right). The plot denotes photometric color used (BP-RP or G-RP) using symbols (BP-RP marked by a plus, G-RP marked by an X.) The error bars on each value are the 16th and 84th percentiles of the distribution of either kinematic or isochronal ages. |
All Tables
Median kinematic and isochronal ages for NGC 2264 N, NGC 2264 S, and Collinder 95 across several YSO subpopulations.
Median normalized age spreads (kinematic and isochronal) across YSO subpopulations in NGC 2264 N, NGC 2264 S, and Collinder 95.
All Figures
|
Fig. 1 Left : example Hα spectrum of the YSO candidate (Gaia Source ID: 3326702657541965952) from NGC 2264, with the source selected as a YSO due to its strong Hα line, i.e., with an EW(Hα) = −48.97 Å. Right : example 6708 Å Li spectrum of the YSO candidate ( Gaia Source ID: 3326714782234731520) from NGC 2264, with this source selected as a YSO due to its strong Li absorption line, i.e., with EW(Li) = 0.32 Å. |
| In the text | |
|
Fig. 2 Scatter plots of Hα EW vs. lithium EW for all the stellar spectra in our samples of clusters NGC 2264 (N & S), Collinder 95, and Collinder 359. If a star has an EW(Hα)−σ < −10 Å (above the horizontal dashed purple line) or an EW(Li)−σ > 0.15 Å (right of the vertical dot-dashed orange line), it is flagged as a YSO. Gaia variability catalog stars are additionally marked with a closed circle. |
| In the text | |
|
Fig. 3 Gaia BP - RP color absolute G magnitude diagram of selected YSOs in NGC 2264 (red) and Collinder 95 (blue). The YSOs identified by spectroscopic criteria are marked as empty circles, while YSOs identified by Gaia variability are marked by smaller solid circles. The YSOs identified by both criteria appear as larger solid circles. Overplotted are 1, 2, 5, 10, and 30 Myr isochrones and 0.2, 0.5, and 0.8 M⊙ tracks from Baraffe et al. (2015) evolutionary models. Absolute G magnitudes were calculated using cluster distances given in Table 2, using 722 pc for NGC 2264 as a whole. |
| In the text | |
|
Fig. 4 Expansion direction histograms of YSOs in NGC 2264 N, NGC 2264 S, and Collinder 95, where the measured angle, Δθ, is the difference in a YSO’s direction of motion from pure radial outward motion from the cluster center. We observed that there is a large proportion of stars near zero (±50°) for NGC 2264 N and Collinder 95, indicating that there is significant outward expansion of YSOs from their cluster centers. We did not observe this same trend for NGC 2264 S. The shaded region shows a range of ±50°, defining a subset of YSOs with the strongest radial expansion. |
| In the text | |
|
Fig. 5 Proper motion maps of YSOs in NGC 2264 N, NGC 2264 S, and Collinder 95. Stars flagged as YSOs via our spectroscopic analysis are marked with an open circle, while YSOs flagged through the Gaia variability catalog are marked with smaller black point. (Stars flagged by both indicators are denoted through a filled in circle/larger black point.) The proper motion of each YSO is shown with an arrow which is color coded according to the direction of motion. The average motion of each cluster or subcluster has been subtracted out (see these values in Table 2), allowing us to observe the plane of sky motion of each YSO within the cluster frame. The center of the cluster is denoted by the intersection point of the dotted two lines. The dotted blue circle denotes the half-mass radius of the identified YSOs in each cluster. |
| In the text | |
|
Fig. 6 Radial profiles of areal stellar number density profiles of NGC 2264 N (top), NGC 2264 S (middle), and Collinder 95 (bottom). Vertical dashed lines indicate the core radii (rc), as defined in Sect. 4.4, and the half-mass radii (r50). |
| In the text | |
|
Fig. 7 Traceback ages (see text) of YSOs for NGC 2264 N (left column), NGC 2264 S (middle column), and Collinder 95 (right column). Each row represents a different subpopulation. First row : all identified YSOs in each cluster. Second row : YSOs with |Δθ| ≤ 50°. Third row : YSOs with |Δθ| ≤ 50° with the additional requirement of a current distance from the cluster center greater than the half-mass radius and a distance of closest approach to the cluster center of less than the half-mass radius. The median and ±1σ range of the distributions are indicated. |
| In the text | |
|
Fig. 8 Left : plot of the extinction correction estimation for NGC 2264 N & S. The extinction values of each cell were determined by drawing the extinction values derived from the STARHORSE code and Gaia DR3 data from a catalog of stars (Anders et al. 2022). We divided the cluster into 0.2° radial ascension by 0.2° declination cells. Then we took the median extinction value of each cell and applied it to all the YSOs within that cell, thereby estimating each YSOs’ extinction value. The YSOs are overplotted as orange crosses. The lowest number of catalog stars populating any cell is Nmin = 20 for Collinder 95 and Nmin = 31 for NGC 2264. Right : same but for Collinder 95. |
| In the text | |
|
Fig. 9 Spatial coordinates (left column), with the cluster core radii (rc) and half-mass radii (r50) indicated as black circles; relative velocity orientation (Δθ) histograms (middle column), and PARSEC ages τiso BP-RP against traceback to the closest approach age τkin,CA (right column) for λ Ori, NGC 2264 N & S, and Collinder 95 (descending rows). Cluster members with the closest approach distance within 1σ of the core radius (rc) and with a present position outside the core radius are indicated as blue points. Other cluster members consistent with moving away from the cluster centers are indicated by red points, and cluster members not consistent with moving away from the cluster centers are indicated by black points. |
| In the text | |
|
Fig. A.1 All Gaia varYSO sources (red < 1 kpc, black > 1 kpc) in the region surrounding NGC 2264 and Collinder 95, which are the two obvious dense regions. We plot the 1 degree MMT field of views around each cluster, as well as control fields each located at the same Galactic latitudes but ±2,±3,±4 degrees away from either cluster in Galactic longitude. |
| In the text | |
|
Fig. B.1 Kinematic age, τkin, against isochronal age, τiso, for YSOs moving away from the cluster center (top panel), for YSOs with closest approach distances within 1σ of the core radius, rc (middle panel), and for YSOs with closest approach distances within the core radius rc (lower panel), for NGC 2264 N. The plot denotes photometric color used for τiso using point color (BP – RP as black, G – RP as blue). |
| In the text | |
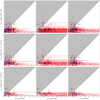 |
Fig. B.2 Same as Fig. B.1 but for NGC 2264 S. |
| In the text | |
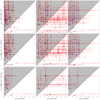 |
Fig. B.3 Same as Fig. B.1 but for Collinder 95. |
| In the text | |
|
Fig. B.4 Kinematic age, τkin, against isochronal age, τiso, for all YSOs (top panel), for YSOs moving away from the cluster center (middle panel), and for YSOs with closest approach distances within r50 and current distances outside of r50 (lower panel), for NGC 2264 N. The plot denotes photometric color used for τiso using point color (BP-RP as black, G-RP as blue.) |
| In the text | |
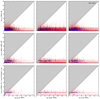 |
Fig. B.5 Same as Fig. B.4 but for NGC 2264 S. |
| In the text | |
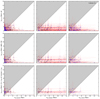 |
Fig. B.6 Same as Fig. B.4 but for Collinder 95. |
| In the text | |
|
Fig. B.7 Median kinematic ages (τkin) versus their median isochronal ages (τiso) for clusters NGC 2264 N (red), NGC 2264 S (green), and Coll 95 (orange). The plot is divided into nine panels, with the three subgroups as rows: all YSOs (top panel), YSOs moving away from the cluster center (middle panel), and YSOs with closest approach distances within r50 and current distances outside of r50 (lower panel). Columns denote the different isochrone models used, with Baraffe (left), PARSEC (middle), and SPOTS (right). The plot denotes photometric color used (BP-RP or G-RP) using symbols (BP-RP marked by a plus, G-RP marked by an X.) The error bars on each value are the 16th and 84th percentiles of the distribution of either kinematic or isochronal ages. |
| In the text | |
Current usage metrics show cumulative count of Article Views (full-text article views including HTML views, PDF and ePub downloads, according to the available data) and Abstracts Views on Vision4Press platform.
Data correspond to usage on the plateform after 2015. The current usage metrics is available 48-96 hours after online publication and is updated daily on week days.
Initial download of the metrics may take a while.