


Fig. B.7
Download original image
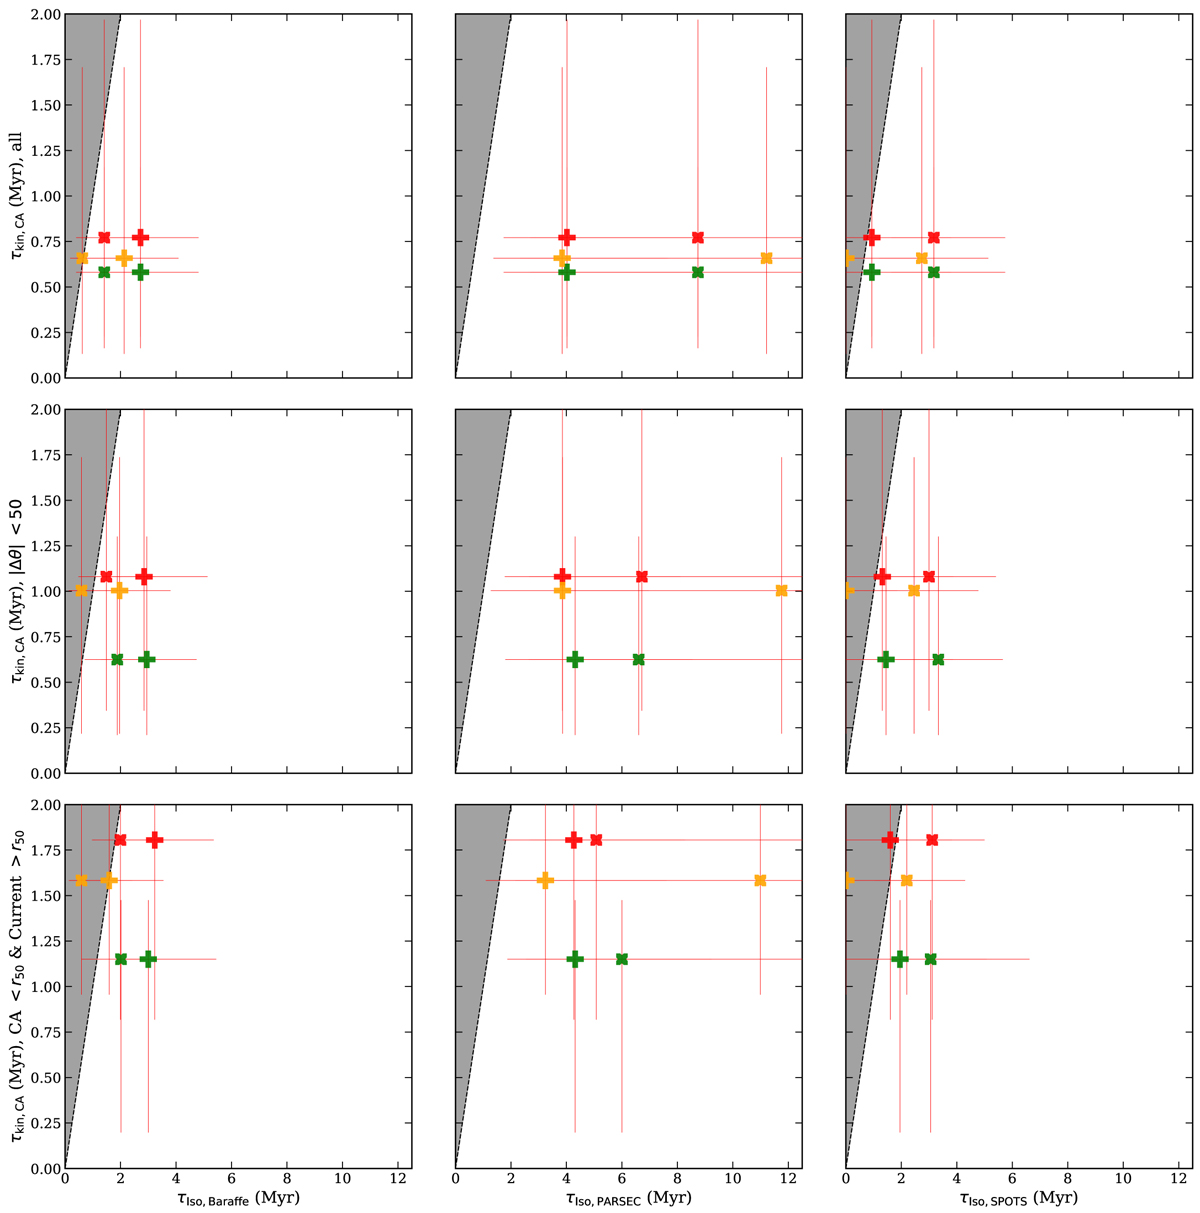
Median kinematic ages (τkin) versus their median isochronal ages (τiso) for clusters NGC 2264 N (red), NGC 2264 S (green), and Coll 95 (orange). The plot is divided into nine panels, with the three subgroups as rows: all YSOs (top panel), YSOs moving away from the cluster center (middle panel), and YSOs with closest approach distances within r50 and current distances outside of r50 (lower panel). Columns denote the different isochrone models used, with Baraffe (left), PARSEC (middle), and SPOTS (right). The plot denotes photometric color used (BP-RP or G-RP) using symbols (BP-RP marked by a plus, G-RP marked by an X.) The error bars on each value are the 16th and 84th percentiles of the distribution of either kinematic or isochronal ages.
Current usage metrics show cumulative count of Article Views (full-text article views including HTML views, PDF and ePub downloads, according to the available data) and Abstracts Views on Vision4Press platform.
Data correspond to usage on the plateform after 2015. The current usage metrics is available 48-96 hours after online publication and is updated daily on week days.
Initial download of the metrics may take a while.