


Fig. 6
Download original image
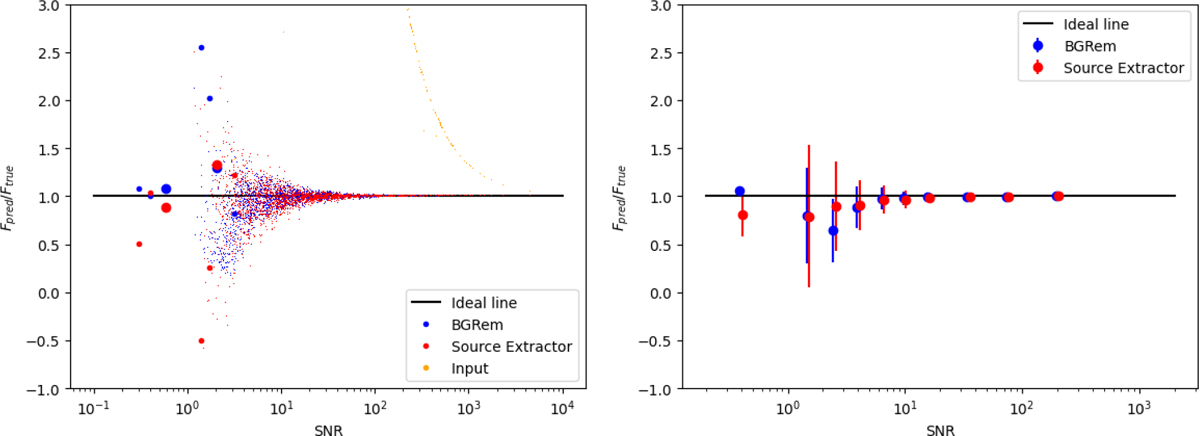
Left: ratio of predicted flux (Fpred) to true flux (Ftrue) for BGRem (blue), SExtractor (red), and the input image (yellow), compared to the ideal line (black) as a function of the signal-to-noise ratio (S/N). Points represent individual sources: small points indicate stars, medium points galaxies, and large points elongated galaxies. Right: same as the left panel, but binned in S/N, with error bars representing statistical error.
Current usage metrics show cumulative count of Article Views (full-text article views including HTML views, PDF and ePub downloads, according to the available data) and Abstracts Views on Vision4Press platform.
Data correspond to usage on the plateform after 2015. The current usage metrics is available 48-96 hours after online publication and is updated daily on week days.
Initial download of the metrics may take a while.