


| Issue |
A&A
Volume 710, June 2026
|
|
|---|---|---|
| Article Number | A363 | |
| Number of page(s) | 14 | |
| Section | Extragalactic astronomy | |
| DOI | https://doi.org/10.1051/0004-6361/202555815 | |
| Published online | 29 June 2026 | |
A large, chemically enriched, neutral gas reservoir in a galaxy at z = 6.782
1
Université Paris-Saclay, Université Paris Cité, CEA, CNRS, AIM, 91191 Gif-sur-Yvette, France
2
Centre national d’études spatiales (CNES), Paris, France
3
LUX, Observatoire de Paris, Université PSL, CNRS, Sorbonne Université, 92190 Meudon, France
4
Institut d’Astrophysique de Paris, UMR 7095, CNRS-SU, 98 bis boulevard Arago, 75014 Paris, France
5
INAF – Osservatorio Astronomico di Capodimonte, Salita Moiariello 16, 80131 Napoli, Italy
6
Niels Bohr Institute, University of Copenhagen, Jagtvej 128, 2200 Copenhagen, Denmark
7
Space Science Data Center (SSDC) – Agenzia Spaziale Italiana (ASI), I-00133 Roma, Italy
8
DTU Space, Technical University of Denmark, Elektrovej 327, DK2800 Kgs., Lyngby, Denmark
9
Cosmic Dawn Center (DAWN), Denmark
10
European Southern Observatory, Karl-Schwarzschild Str. 2, 85748 Garching bei München, Germany
11
Department of Astrophysics/IMAPP, Radboud University, 6525 AJ, Nijmegen, The Netherlands
12
Department of physics, University of Calabria, Via P., Bucci, Arcavacata di Rende (CS), Italy
13
INAF – Osservatorio di Astrofisica e Scienza dello Spazio, Via Piero Gobetti 93/3, 40129 Bologna, Italy
14
INFN – Laboratori Nazionali di Frascati, Frascati, Italy
15
School of Physics and Astronomy, University of Leicester, University Road, Leicester LE1 7RH, UK
16
INAF – IASF Milano, Via A. Corti 12, 20133 Milano, Italy
17
Osservatorio Astronomico di Brera, via E. Bianchi 46, I23807 Merate (LC), Italy
18
Department of Physics & Astronomy, Clemson University, Clemson, SC 29634, USA
19
Department of Astronomy, University of Geneva, Chemin Pegasi 51, 1290 Versoix, Switzerland
20
University of Warwick, Coventry CV4 7AL, UK
21
School of Physics and Centre for Space Research, University College Dublin, Belfield D04 V1W8 Dublin, Ireland
22
INAF – Osservatorio Astronomico di Roma, via Frascati 33, 00040 Monte Porzio Catone, Italy
23
Istituto di Astrofisica e Planetologia Spaziali, Via Fosso del Cavaliere 100, 00133 Roma, Italy
24
Astronomical Institute Anton Pannekoek, University of Amsterdam, 1090 GE, Amsterdam, The Netherlands
25
Department of Physics, University of Bath, Bath BA2 7AY, UK
26
Aix Marseille Université, CNRS, CNES, LAM, Marseille, France
★ Corresponding author: This email address is being protected from spambots. You need JavaScript enabled to view it.
Received:
4
June
2025
Accepted:
27
April
2026
Abstract
The physical and chemical characterization of galaxies formed within the first billion years after the Big Bang remains one of the central goals in contemporary astrophysics. For the last two decades, optical and near-infrared spectroscopy of long gamma-ray bursts (GRBs) have been heralded as an effective diagnostic to probe the interstellar medium (ISM) of the galaxies hosting these events and their metal and dust content, reaching even the most distant redshifts. An opportunity to fulfill this expectation was provided by the recent blast triggered by the Neil Gehrels Swift Observatory of GRB 240218A at redshift z = 6.782. From the GRB explosion, we were able to study a high-redshift galaxy selected in a complementary way with respect to flux-limited surveys, not depending on galaxy luminosity and stellar mass. Furthermore, the GRB afterglow allowed us to perform a coring of the galaxy ISM and to determine its kinematic and chemical properties. We present the VLT/X-shooter spectrum of its afterglow enabling the detection and the detailed characterization of neutral-hydrogen, low-ionization, high-ionization and fine-structure absorption lines, as well as excited level transitions. From this rich variety of absorption lines associated with gas inside and around the GRB host galaxy, we determined the metallicity, kinematics, chemical abundance pattern and dust depletion. This provides the first detailed characterization of the neutral gas of a galaxy at z > 6.5. Thanks to the presence of fine-structure absorption lines, we were able to estimate the distance of the closest absorbing gas clouds as dII = 620−140+230 pc. We determine a high neutral hydrogen column density, log(N(H I)/cm−2) = 22.5 ± 0.3, which is the highest one at z ≳ 6 determined so far for a GRB host galaxy, as well as a surprisingly high metal column density, log(N(Zn II)/cm−2)≥14.3. The observed metallicity of the host galaxy system is [Zn/H] ≥ −0.8, with a dust depletion level of [Zn/Fe] > 0.4. The high hydrogen column density, metal abundances, and dust depletion in the neutral gas align with those of the ionized gas of very high-redshift galaxies unveiled by ALMA and JWST, testifying that a rapid build-up of metals and dust, and massive neutral hydrogen reservoirs seem to be common features of galaxies in the early Universe. This research highlights the remarkable potential of GRBs as tools to investigate the detailed properties of galaxies deep into the re-ionization epoch, and stresses the importance of new missions capable of enlarging the sample of very high-redshift GRBs.
Key words: gamma-ray burst: general / dust / extinction / galaxies: abundances / galaxies: high-redshift / galaxies: ISM / gamma-ray burst: individual: GRB 240218A
© The Authors 2026
 Open Access article, published by EDP Sciences, under the terms of the Creative Commons Attribution License (https://creativecommons.org/licenses/by/4.0), which permits unrestricted use, distribution, and reproduction in any medium, provided the original work is properly cited.
This article is published in open access under the Subscribe to Open model. This email address is being protected from spambots. You need JavaScript enabled to view it. to support open access publication.
1. Introduction
Unveiling galaxies at the highest redshifts and studying their chemical evolution is a key objective in modern astrophysics.
Neutral gas, primarily composed of atomic hydrogen (H I), is a fundamental component of the interstellar medium (ISM) and the circumgalactic medium (CGM) in galaxies, and it contains the majority of metals at z ≥ 2.5 (Péroux & Howk 2020). Neutral gas forms the primary reservoir from which stars form and is hence a key player in chemical enrichment. Therefore, its observation is fundamental to understand galaxy evolution (Madau & Dickinson 2014).
Nowadays, thanks to the James Webb Space Telescope (JWST), it is possible to measure H I column densities in large fractions in galaxies during the re-ionization epoch at z > 5 and out to z ∼ 14 (Umeda et al. 2024; D’Eugenio et al. 2024; Hainline et al. 2024; Carniani et al. 2025; Witstok et al. 2025; Heintz et al. 2025). Through the detection of strong damped Lyman-α (DLA) absorbers, Heintz et al. (2024) provided direct measurements of H I for galaxies at z > 9 and showed evidence for abundant neutral gas reservoirs in some early galaxies. In order to sustain the high H I column densities while covering the entire physical extent of the galaxies, these sources must be embedded in large, extended layers or shells of neutral gas. High-redshift galaxies at z > 6 were not only forming stars efficiently but were also undergoing significant chemical evolution (Langeroodi et al. 2023; Heintz et al. 2023a; Nakajima et al. 2023; Curti et al. 2024), showing the richness of spectral features and unusual chemical abundances (e.g. Bunker et al. 2023; Curti et al. 2025; Castellano et al. 2024; D’Eugenio et al. 2024), which may indicate rapid enrichment processes occurring during the earliest stages of galaxy formation. These findings challenge earlier models that suggested that metal enrichment and dust formation were slower processes that occurred after z ∼ 5 (Madau & Dickinson 2014).
Despite this progress, a detailed study of chemical and kinematic properties of neutral gas remains difficult, even for JWST. The most powerful way to directly measure the properties of the neutral gas is through absorption lines detected in the spectrum of bright-background sources such as quasars (QSOs) and gamma-ray bursts (GRBs; Gehrels & Razzaque 2013). GRBs serve as cosmic beacons, which probe in great detail the star-forming galaxies that host them out to the highest redshifts; these galaxies are often faint and missed by flux-limited observations. The association of long-GRBs (LGRBs) with massive stars (Hjorth et al. 2003; Woosley & Bloom 2006; Fruchter et al. 2006; Hjorth et al. 2012; Cano et al. 2017) means that they point directly to the sites of star formation enriching the Universe (Krogager et al. 2024), unlike the alignments of QSOs, and makes them especially suitable for investigating galaxies and star formation up to the early Universe. They have already been observed out to zspec = 8.23 (GRB 090423A; Salvaterra et al. 2009; Tanvir et al. 2009) and zphot ≃ 9.4 (GRB 090429B; Cucchiara et al. 2011), and they are expected to be observable even beyond these redshifts (Campana et al. 2022; Kann et al. 2024).
Ground-based telescopes equipped with medium/high-resolution spectrographs allow us to dissect the light from GRB afterglows, revealing precise information about the chemical and physical properties of the absorbing gas in the host galaxy, in particular on the neutral gas and its components. Optical and near-infrared (NIR) absorption spectroscopy and the high spectral signal-to-noise ratio (SNR) provide valuable information on the neutral hydrogen column density (Selsing et al. 2019; Tanvir et al. 2019), the gas kinematics, and the distance of absorbing material from the GRB (Prochaska et al. 2006; Vreeswijk et al. 2007; D’Elia et al. 2009b), shedding light on the chemical properties of the ISM, metals, and dust content of their host galaxies up to the highest redshifts (Sparre et al. 2014; Hartoog et al. 2015; Saccardi et al. 2023). All of this can be done independently of the brightness of the host galaxies. Furthermore, thanks to the Very Large Telescope (VLT) X-shooter follow-up and its much higher spectral resolving power, we can constrain the neutral gas-phase and chemical composition much more accurately than will ever be possible with JWST.
Several studies investigate the metallicity and dust content of GRB-selected star-forming galaxies from z ∼ 2 up to z > 6 (e.g. Bolmer et al. 2019; Heintz et al. 2023b). These galaxies exhibit significant metal and dust production, highlighting a rapid build-up of these components in the early Universe. They also show a large scatter in the dust-corrected metallicities at a given redshift (De Cia et al. 2018; Heintz et al. 2023b; Konstantopoulou et al. 2024), which is not captured in most state-of-the-art galaxy evolution simulations (Yates et al. 2021), although there is broad agreement with the chemical enrichment as a function of cosmic time. Furthermore, these works reveal that the dust-to-metal ratio in these galaxies grows steadily with cosmic time, aligning with the predictions of earlier models, but suggesting faster dust production than previously assumed. Additionally, there is evidence of a correlation between metallicity and dust-to-metal ratio (De Cia et al. 2013), suggesting that these galaxies are significant contributors to the cosmic dust budget at high redshifts (see Heintz et al. 2023b, for further details).
All the results presented above exploited the best existing samples of GRB hosts, but are strongly impacted by poor statistics due to the small number of events, especially at high redshift. To date, GRB 130606A (Hartoog et al. 2013) and GRB 210905A (Saccardi et al. 2023), at z = 5.913 and z = 6.312, respectively, are the highest redshift GRBs with available optical and NIR spectroscopy of their afterglow characterized by a high SNR, good spectral resolution and a large number of detected absorption lines of the neutral gas in their host galaxies. With these afterglow spectra it was possible to study the chemical abundance pattern and depletion of metals, and to retrieve information on nucleosynthesis, all in unprecedented detail for faint galaxies at such high redshift (Chornock et al. 2013; Totani et al. 2014; Hartoog et al. 2015; Rossi et al. 2022; Saccardi et al. 2023; Fausey et al. 2025).
In this paper, we study the VLT/X-shooter optical and NIR afterglow spectrum of GRB 240218A at redshift z = 6.782. In Sects. 2 and 3, we present our dataset, the fitting of the absorption lines, and the curve of growth analysis and the GRB-absorbers distance calculation. In Sect. 4 we present our results. Our discussion and conclusions are drawn in Sect. 5. A ΛCDM cosmological model with ΩM = 0.308, ΩΛ = 0.692, and H0 = 67.8 km s−1 Mpc−1 (Planck Collaboration XIII 2016) was assumed for calculations. Oscillator strengths were adopted from NIST (Atomic Spectra Database Lines Form). All data are in the observer frame and 1σ errors are reported throughout the paper, unless otherwise specified. A companion paper (Brivio et al. 2025) presents and analyzes the GRB prompt and afterglow multi-wavelength spectral and temporal properties, comparing with those of the few high-redshift LGRBs observed so far and those of lower-z events.
2. VLT/X-shooter observation of GRB 240218A1
On February 18, 2024 at 02:00:00 UT the Neil Gehrels Swift Observatory (Swift hereafter; Gehrels et al. 2004) discovered GRB 240218A. The Swift Burst Alert Telescope (BAT, Barthelmy et al. 2005) triggered and located the explosion (Page et al. 2025). Swift slewed immediately to the burst and the X-Ray Telescope (XRT, Burrows et al. 2005) began observing the field 149.4 seconds after the BAT trigger. XRT found a bright, uncatalogued X-ray source at the enhanced position of coordinates RA (J2000) = 10h 47m 11.24s Dec (J2000) = +01° 16′ 34.8″ with an uncertainty of 4.2″ (Evans et al. 2024). The Swift Ultra-Violet and Optical Telescope (UVOT, Roming et al. 2005) took a finding chart exposure of 119 seconds with the white filter starting 158 s after the BAT trigger. No credible afterglow candidate was found in the data products. Follow-up from the ground allowed the detection of a bright NIR afterglow candidate (D’Avanzo et al. 2024; Rossi et al. 2024) and its optical counterpart (Malesani 2024), together with a precise localization of the afterglow thanks to the radio (Schroeder et al. 2024; Thakur et al. 2024) and millimeter (Laskar et al. 2024) detections (see Brivio et al. 2025 for further details).
Approximately 26 h (observer frame) after the detection of GRB 240218A, we observed its afterglow using the ESO VLT UT3 equipped with the X-shooter spectrograph (Vernet et al. 2011). The observing setup is detailed in Table 1. Observations were conducted using the ABBA nod-on-slit mode. Each individual spectrum from the UVB and VIS arms was reduced using the STARE mode reduction, with the extraction window positioned at the GRB afterglow trace. The NIR arm data were processed using the standard X-shooter NOD mode pipeline (Goldoni et al. 2006; Modigliani et al. 2010). Sky features were subtracted and each flux-calibrated spectrum was combined into a final science spectrum. Additionally, a telluric correction was applied to the final stacked VIS and NIR spectra, and wavelengths were corrected to the vacuum-heliocentric system. To ensure a correct flux calibration between the VIS and NIR arms, both spectra were normalized to the afterglow photometry in the z and J bands, respectively, reported at the mean time of the spectrum using the light-curve fit provided by Brivio et al. (2025), which presents a complete analysis of the multi-wavelength light-curve. An integration of the spectrum over the filter profile was necessary given that the H I absorption (Lyman-α break) significantly affects the z-band magnitude.
Log of the observations.
3. Data analysis
The highest redshift system identified in the absorption spectrum of GRB 240218A afterglow is at z = 6.782 and spans ∼400 km s−1. It is a DLA absorption system (see Figure 1) with associated metal absorption lines (Saccardi et al. 2024). As this is the highest redshift H I absorption in the spectrum and, furthermore, fine-structure absorption lines are detected corresponding to this system, we associate it with the host galaxy of GRB 240218A. We do not identify any foreground intervening absorbers along the line of sight. We note that this is the highest GRB redshift measured accurately from metal absorption lines so far.
 |
Fig. 1. VLT/X-shooter 1D spectrum of GRB 240218A. The grey curve shows the raw, stitched VIS+NIR arm, photometrically calibrated spectrum, and the black one shows the binned version (by a factor of 20). The best-fit DLA model with log(NHI/cm−2) = 22.5 ± 0.3 is shown as the red curve, with the uncertainty represented by the red shaded area. The blue lines correspond to IGM-only absorption for xHI = 0.3, 0.6, 0.9, without any DLA contribution. The connection region between the VIS and NIR arms is represented by the blue shaded area. |
3.1. The damped Ly-α absorption feature
The DLA absorption imprinted from H I in the host-galaxy ISM is shown in Figure 1.
The determination of the DLA column density is complicated by the fact that the red wing falls in a noisy region of the spectrum at the overlap of the VIS and NIR arms. At this high redshift, we also expect a significant neutral H I fraction in the line of sight through the partially neutral IGM.
We modeled the Lyα damping wing with a Voigt profile, with an optical depth of τ = CaH(a, x)NHI, where C is the photon absorption constant, a is the damping parameter, and H(a, x) is the Voigt-Hjerting function, following the approximation of Tepper-García (2006). We further added the optical depth from the Gunn-Peterson effect from an increasingly neutral intergalactic medium (IGM; Fan et al. 2006), following the approximation by Miralda-Escudé (1998), Totani et al. (2006), integrating the line-of-sight IGM contribution from the GRB redshift down to z = 6. We assumed that the intrinsic slope can be quantified as a power law, Fλ ∝ λ−β, and simultaneously constrain the three free parameters in the fit, β, NHI, and xHI. Since the neutral H I fraction of the IGM, xHI, is essentially unconstrained in the modeling due to the substantial local H I component in the GRB host, we fixed this quantity at xHI = 0.3 in the final best-fit model. Even under the assumption of an extreme value of xHI, the H I column density value remains practically unchanged (see also Heintz et al. 2024 for further details on IGM transmission curves). Assuming a single velocity component fixed to the systemic redshift zGRB = 6.782, a value of log(N(H I)/cm−2) = 22.5 ± 0.3 is obtained.
3.2. Metal absorption lines
The low ions (Fe II, Cr II, Zn II, Si II, Al II, etc.) trace the neutral medium in the host galaxy. In GRB 240218A afterglow spectra, low-ionization lines are detected in three separate components (see Figure 2 and Table 2)2. Component II is the strongest and shows fine-structure absorption lines; we therefore adopted its redshift (zGRB = 6.782) as that of the GRB host (refer also to analysis in Sect. 4.1 on distance of absorbing gas clouds) and as the zero reference value in velocity space. Components I and III are at Δv = −200 km s−1 and Δv = +50 km s−1, respectively.
 |
Fig. 2. VLT/X-shooter optical/NIR afterglow spectrum of GRB 240218A. Left panel: Selection of low-ionization absorption lines of the GRB host galaxy system. Here and in the following panels data are shown in black, the fit in green, the error spectrum in red, the continuum in blue, and the vertical dashed green lines indicate the center of the components. Middle panel: Fine-structure and excited-transition absorption lines of the GRB host galaxy system. Right panel: High-ionization absorption lines. All the plots are in velocity space and 0 was fixed at z = 6.782 (see Sect. 3), corresponding to the stronger low-ionization line component (II). |
Top: Logarithmic column density of low-ionization lines. Bottom: Column density of high-ionization lines.
For components II and III, the spectrum shows clear detection of transitions arising from excited levels of Fe II, and from metastable levels (involving transitions from long-lived excited states that are forbidden or suppressed by selection rules) of both Fe II and Ni II. The Fe II* λ2612, Fe II* λ1613, Fe II* λ1702 and Ni II* λ2166, Ni II* λ2217, Ni II* λ2223 transitions are identified as shown in Figure 2. A comprehensive analysis of fine-structure absorption lines and cloud distances is presented in Sect. 4.1 and Appendix A.
Despite the very noisy region of the spectrum, high-ionization lines (C IV, Si IV) are also detected, with their strongest component aligned with that of low-ionization transitions. They span a larger range with respect to low-ionization lines in velocity space, Δv ∼ 500 km s−1 (see Figure 2).
Most of the low-ionization absorption lines show signs of saturation. The fitting procedure in the saturated regime, the flat region of the curve of growth (CoG), is not straightforward. Simultaneously fitting multiple transitions of the same ionic element can address the hidden saturation issue. An intermediate-resolution spectrograph, such as X-shooter, can reduce this effect slightly, because a higher resolution could resolve single interstellar clouds in the GRB host galaxy. However, caution is needed when interpreting column densities obtained via the CoG; such measurements should generally be considered as lower limits, especially if the equivalent widths (EWs) fall within the saturated region of the CoG (Prochaska 2006). Indeed, also at the X-shooter spectral resolution, to get more reliable constraints on the Doppler parameter b, one should use a combination of the lines with different oscillator strengths. To estimate the column densities of elements with a similar ionization potential, we first used the CoG approach, as described in Spitzer (1998) and explained in detail in Appendix B. The best-fit CoG is illustrated in Figure 3. The results show a quite high Doppler parameter, b, suggesting the presence of multiple spectrally unresolved components, and that most of the transitions fall at the knee of the CoG (see Figure 3), which is the transition region between linear and saturated regime. Due to the significant blending of components, a limitation of this method, however, is the lack of detailed velocity-distribution information for the single ISM clouds contributing to the observed absorption lines.
 |
Fig. 3. Results obtained from the CoG analysis on the ISM absorption lines identified in the spectrum of GRB 240218A. The data points are color-coded with respect to different element transitions (see Table B.1). The grey shaded area represents the best-fit model, which results in the labeled value of the Doppler parameter; the dotted lines represent the linear-approximation regime and its 1σ confidence ranges. |
It is evident that the large EW (see Table B.1) of the metal lines (e.g. Fe IIλ2260, Zn II doublet) is remarkable at such high redshift. They are not only significantly stronger than what is typically observed in GRB-DLAs (de Ugarte Postigo et al. 2012), but they are also comparable to the values commonly observed in the Milky Way (MW; e.g. De Cia et al. 2021).
We then performed a Voigt-fit profile analysis to determine the element column densities. This is another approach which follows the same physical method as CoG one, with the main difference being that the Voigt fit allows us to identify the single components in multiple ionic transitions.
We fitted the systems with the Astrocook code (Cupani et al. 2020), a Python software environment to analyze absorption spectra that includes a set of algorithms to model spectral features in absorption and emission (continuum, spectral lines, complex absorption systems). Detected system components were modeled with Voigt profiles, depending on the absorption redshift z, column density N, and Doppler broadening b. We initially provided the position of the components in the velocity space by visual inspection, using the least saturated transitions with the highest SNR, for different ionization states. These values were then used as initial guesses, and the Voigt fitting code subsequently determines the best-fit column density, velocity, and Doppler parameter of each component. The best-fitting model can be determined by the least-squares minimization (using the LMFIT library, see Newville et al. 2025) of the reduced χ2 between the observed flux-density profile and the theoretical one. The uncertainties reported on column densities are those obtained by the line fitting that represent the 1σ standard errors derived from the covariance matrix (for further details on the method see Cupani et al. 2020; Carswell & Webb 2014). The column densities3 that we determined are presented in Table 2.
The simultaneous fit of all the transitions of the Cr II multiplet4(Cr IIλ2056, Cr IIλ2062) makes it possible to estimate the chromium column density. The flux residual of Cr IIλ2056 suggests that the Cr II column density may be considered as a lower limit. Concerning iron, the Fe IIλ2260 transition also shows flux residuals which are at the limit of saturation. The Fe IIλ1611 transition does not appear to be saturated, as shown in Figure 2. It would confirm that the Fe IIλ2260 transition is not affected by severe saturation. However, given the poor SNR region where the λ1611 transition falls, we may also consider the Fe II column density as a lower limit. On the other hand, Zn is a more delicate case. Figure 2 shows evidence of some saturation of Zn IIλ2026, while the Zn IIλ2062 is blended with Cr IIλ2062. By measuring the Cr II column density with the Voigt-profile fitting, it is possible to de-blend the lines and recover the contribution of Zn II5. As for the other elements it would be cautious to take the Zn II column density as a lower limit to avoid an incorrect conclusion and a systematic underestimation of all column densities. We note that, with respect to our scientific results (see Sect. 4.2), considering the Zn II column density as a measurement is a conservative approach.
As expected, the Voigt-fit approach and the CoG method provide consistent results. Indeed, considering a single component even for the Voigt-fit profile analysis, the Doppler parameter is in agreement with that determined by the CoG.
4. Results
4.1. Fine-structure lines and absorbing cloud distances
GRB afterglows strongly interact with the interstellar medium, by depositing a large amount of energy. This is particularly evident in the optical-UV band where the gas surrounding the GRB absorbs the radiation, exciting the atoms and ions to high quantum levels. The comparison of observations with predictions from time-dependent photo-excitation codes has been applied to the spectra of several GRBs (Dessauges-Zavadsky et al. 2006; D’Elia et al. 2009a; Ledoux et al. 2009; Hartoog et al. 2013; D’Elia et al. 2014; Saccardi et al. 2023; Pugliese et al. 2024), allowing estimates of the distance between the GRB and the absorber, which typically spans tens to hundreds of pc (Vreeswijk et al. 2012).
For GRB 240218A we can apply the comparison between data and photo-excitation codes (Vreeswijk et al. 2007; D’Elia et al. 2009a) to find the distance between the GRB and the absorbers of components II and III (we refer to Appendix A for more details). We find  pc and
  kpc for components II and III, respectively. Despite the large uncertainties for component III due to the larger errors on the column densities, we can safely conclude that component II lies closer to the GRB than component III. We note that these distances could be larger if the ground-state column densities are underestimated (if affected by saturation).
4.2. Metallicity and chemical enrichment of the neutral gas
We used the metal and neutral hydrogen column densities to determine the metallicity of the GRB 240218A host galaxy along the GRB line of sight. Based on the column density of zinc (log(N(Zn II)/cm−2)≥14.3), which is a poorly dust-depleted element, we calculated the observed metallicity [X/H] ≥ −0.8 (where X is Zn).
In addition, considering the Fe II column density range (16.0 < log(N(Fe II)/cm−2) < 16.8), if we conservatively adopt the upper value of log(N(Fe II)/cm−2) = 16.8, this leads to an estimated dust depletion of [Zn/Fe] > 0.4.
The amount of dust is likely to be significant in this system, as also suggested by the large reservoir of neutral hydrogen. This would presumably indicate that Zn is depleted by a factor of > 0.1 dex, which we estimated using Eq. (5) of De Cia et al. (2016). If we correct the total Zn abundance for this level of dust depletion, we might expect a dust-corrected metallicity of [M/H] ≥ −0.7.
Despite being aware of the limitations of the spectral data, especially regarding the saturation issues, we report a deeper analysis of the chemical enrichment and dust depletion by assuming column densities equal to their lower limits for Fe II, Cr II, and Zn II as measurements. We performed this test, intended for a general guidance, to assess whether treating the lower limits as actual measurements would yield different results. The consistent findings provide a tentative analysis of the chemical enrichment, offering a reasonable framework for discussing the physical state of the gas.
Following the method developed by De Cia et al. (2016, 2021) (but using the most recent and solid compilation of the so-called refractory indices from Konstantopoulou et al. 2024), we analyzed the abundances of different metals with the aim of characterizing the chemical enrichment in the GRB host galaxy. We stress that this deeper analysis of the chemical enrichment and dust depletion is based on the assumption of considering, despite the possible saturation issue, the column densities values as measures and not as limits.
In Figure 4 we present the observed abundance pattern along the line of sight of the galaxy. In this formalism (De Cia et al. 2016) the observed abundances are on the y-axis, and the x-axis represents the tendency of each element to deplete into dust grains. The total metallicity, [M/H]tot, and overall strength of depletion, [Zn/Fe]fit, can then be derived with a linear fit to the data. They respectively affect its normalization and its slope. Despite the large uncertainties and the limited amount of elements available, the abundance pattern clearly indicates significant dust depletion. We fitted a linear relation6 to the constrained data (Cr, Fe, and Zn) and not including Al and Si7. We used the metal and neutral hydrogen column densities reported in Table 3, assuming Asplund et al. (2021) solar abundances.
 |
Fig. 4. Abundance pattern observed in the host of GRB 240218A from the total absorption-line profile. The x-axis corresponds to x = B2X, while the y-axis is defined as y = log N(X)−log N(H)−X⊙ + 12 − A2X ∼ [X/H], where B2X and A2X were adopted from Konstantopoulou et al. (2022). The linear fit to the data (solid line) determines the dust depletion corrected metallicity [M/H]tot (intercept) and the overall strength of depletion [Zn/Fe]fit (slope). The H I error bar, which is the same for all the data points, is reported as σH I. See De Cia et al. (2021, 2024) and Konstantopoulou et al. (2024) for an exhaustive description of the method. |
Column densities and metal abundances.
The dust-corrected metallicity is [M/H]tot = −0.5 ± 0.4, with a dust depletion of [Zn/Fe]fit = 1.1 ± 0.4. The large uncertainties are mainly due to the low SNR of the X-shooter spectrum. We note that considering Zn II column density as a lower limit would imply even higher metallicity and dust depletion values.
Following Konstantopoulou et al. (2024) we derived the dust-to-metal mass ratio (DTM), that is the ratio between the mass of dust and the total mass of the metals. We find DTM = 0.5 ± 0.1. This DTM value, together with that of [Zn/Fe]fit, is similar to what is observed in the MW. The GRB-selected galaxies further show systematically lower DTM than the MW, especially at high redshift (Heintz et al. 2023b). Hence, the GRB 240218A DTM value represents an exception with respect to the best-fit relation derived from observed GRB-DLA (Heintz et al. 2023b) and values predicted by the simulations (Li et al. 2019).
Unfortunately, due to the large uncertainties on the total dust-corrected metallicity and H I column density, it is not possible to place an accurate constraint on the extinction value derived from depletion (AV, depl). On the other hand, the amount of extinction needed to reproduce the afterglow spectral energy distribution (SED) is AV, SED = 0.35 ± 0.03 mag (Brivio et al. 2025).
Furthermore, we performed a component-by-component analysis of the abundance patterns, as well as a global and component-by-component analysis of the over- and under-abundance of the different elements with respect to iron after correcting for dust depletion. The details are shown in Figures C.2, C.1 and C.3 of Appendix C, respectively. All components show a significant amount of dust depletion. We found a possible indication of aluminium overabundance in component I and in the global analysis (see Figure 4, and Appendix C). Aluminium overabundance has also been reported in the other two high-z GRB afterglows with a comprehensive analysis of the abundance patterns, GRB 130606A (Hartoog et al. 2015) at z = 5.913 and GRB 210905A (Saccardi et al. 2023) at z = 6.312. This peculiar chemical pattern, which in the local Universe is usually found in globular clusters, can be the direct signature of the presence of very massive rotating stars (Prantzos et al. 2007, and references therein).
Large compilations of QSO-DLAs also show evidence of peculiar abundance patterns and α-element enhancements (Velichko et al. 2024), including supersolar [α/Fe] in the very metal-poor regime, which is indicative of core-collapse enrichment, and resembling signatures expected from early stellar populations (Cooke et al. 2011; Welsh 2022, 2024). Surveys targeting z ∼ 4–5 DLAs also highlight a large diversity of relative abundances, including cases of likely Population III stars (Pop III) contribution (Huyan et al. 2025). From the spectroscopic studies of the lines of sight of QSO at z > 6 (D’Odorico et al. 2023), the inferred chemical abundances indicate a similar enrichment pattern than at lower z. A comparison between high-redshift DLAs and very metal-poor DLAs at 2 < z < 4.5 shows generally comparable relative abundances, except for [C/O], [Si/Fe], and [Si/O], which are higher in the high-z systems. Moreover, the scatter increases significantly with redshift, as predicted by theoretical models and possibly reflecting residual signatures of Pop III stars (Sodini et al. 2024). Recent studies based on high-SNR JWST/NIRSpec spectra (R ∼ 2700) of four well-studied QSOs at 6.5 < z < 7.5 report intriguing evidence for Pop III chemical signatures (Christensen et al. 2023); however, these results require caution, because the relatively low spectral resolution can lead to overestimated abundance ratios, as demonstrated by Vanni et al. (2024).
5. Discussion and conclusions
We analyzed the gas properties along the GRB 240218A line of sight using afterglow spectra obtained with VLT/X-shooter. Our study reveals the presence of neutral hydrogen, low-ionization, high-ionization, and fine-structure metal lines, originating from the GRB host galaxy complex at z = 6.782. We measured a high neutral hydrogen column density in the host galaxy of log(N(H I)/cm−2) = 22.5 ± 0.3. We determined the abundances of metals in the neutral gas of the ISM along the GRB line of sight ([Zn/H] ≥ −0.8), as well as a constraint on the dust depletion level ([Zn/Fe] > 0.4).
The host galaxy of GRB 240218A has the highest neutral hydrogen column density measured at high redshift (z ≳ 6) for any GRB sight-line detected thus far. The large H I column density indicates that the host galaxy contains and/or is surrounded by massive, extended clouds of neutral gas, which is the raw material for star formation in galaxies. Intriguingly, such high log(N(H I)) were also reported by Heintz et al. (2024) for three DLAs at z > 8 observed with JWST, and are now also detected in very high-redshift galaxies (e.g. Hainline et al. 2024; Witstok et al. 2025).
Furthermore, the large amount of metals (and likely dust) already formed at high redshift is surprising compared to previous studies or high-z simulation (Heintz et al. 2023b; Li et al. 2019). This is the first time that strong absorption lines of metals, such as those of Zn II, have been observed at high redshift. We investigated the extent to which the high column densities measured for Zn II and Cr II in the ISM of this host galaxy are likely due to the large amounts of dense gas, as suggested by the large amount of neutral hydrogen. Hence, we compared our column density measurements with those of other GRBs for which these quantities are available. We first selected GRBs for which log(N(H I)/cm−2) > 22 has been measured by Tanvir et al. (2019), supplemented by more recent results. Within the selected GRBs, we then looked for the ones that had Zn and Cr column density measurements available. This led to the construction of the sample8 reported in Figure 5. Certainly, as already stressed, the column density of Zn II (but also of Cr II) is an exception at high redshift. Furthermore, it also turns out to be an exception in comparison with low-redshift analogs. Indeed, from Figure 5 it is clear that these large column densities are less common at low-redshift.
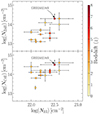 |
Fig. 5. Column density of Zn II and Cr II (Watson et al. 2006; Wiseman et al. 2017; Heintz et al. 2019; Bolmer et al. 2019; Selsing et al. 2019) versus log(N(H I)/cm−2) (Tanvir et al. 2019), color-coded by the GRB host galaxy redshift. GRB 240218A is marked and compared with the sample of GRBs for which these measurements are available. |
In summary, the GRB 240218A host galaxy is very likely a massive high-redshift galaxy, characterized by a large amount of neutral gas, neutral hydrogen column and metals showing substantial, rapid chemical evolution and enrichment (see Figure 6), as indicated by the significant presence of metals (and likely dust). Such properties could imply the need for sustained star formation before the GRB to build up the metals. The GRB is thus likely hosted by a massive galaxy that formed early.
 |
Fig. 6. Metallicity as a function of log(N(H I)/cm−2) color-coded by the redshift for GRBs host galaxies and high-redshift galaxies observed with JWST. For GRBs hosts, we report the observed metallicity ([M/H], not corrected for dust depletion) determined from the afterglow spectra of GRBs at z ≳ 6, i.e. GRB 050904 (Kawai et al. 2006; Thöne et al. 2013; note that the measurements rely on a low-resolution spectrum), GRB 130606A (Hartoog et al. 2015; Heintz et al. 2023b), and GRB 210905A (Saccardi et al. 2023). For high-redshift galaxies, we report the oxygen based metallicity determined from emission lines and/or SED fitting for the recently discovered JWST high-redshift galaxies, i.e. GS-z14 (Carniani et al. 2025; Heintz et al. 2025), GS-z12 (D’Eugenio et al. 2024), GS-z11 (Hainline et al. 2024), GS-z13-LAE (Witstok et al. 2025), CEERS-43844, MACS0647-JD, CEERS-16943 (Heintz et al. 2024), and A1689-zD1 (Watson et al. 2015; Heintz et al., in prep.). The relationship between 12 + log(O/H) and [M/H] is defined by the comparison with the solar oxygen abundance, where [M/H] = 12 + log(O/H)−8.69 (Asplund et al. 2021). |
QSOs constitute another well-established probe of the chemical enrichment of the high-redshift Universe. Therefore, it is useful to compare GRB-DLAs with QSO-DLAs. GRB-DLAs typically exhibit significantly higher H I column densities compared to QSO-DLAs (e.g. Krogager et al. 2024). This reflects the fact that GRB sight lines probe dense, internal regions of their host galaxies, often near active star-forming regions, whereas QSO-DLAs may intersect gas in the relatively less dense regions of galaxies compared to GRB-DLAs (Fynbo et al. 2008). Despite these differences, at redshifts of z ∼ 2 − 3, both populations trace the luminosity function of star-forming galaxies in a broadly similar way, suggesting that the observed differences are largely due to line-of-sight geometry rather than intrinsic differences in the galaxy populations themselves.
The cosmic metallicity evolution of the neutral gas with redshift (0.6 < z < 6.8) shows a declining evolution with increasing redshift, which is probed both with GRB-DLAs and QSO-DLAs and in a similar way (e.g. De Cia et al. 2018; Péroux & Howk 2020; Heintz et al. 2023b; Konstantopoulou et al. 2024). The two samples have different redshift ranges and most targets are concentrated in the 2 < z < 4 redshift range. Within this interval, the observed scatter is substantial and reflects the wide diversity in galaxy metallicities at a given cosmic epoch. GRB-DLA metallicities show a spread due to local conditions and star-forming regions along the line of sight, whereas QSO-DLAs, which preferentially sample random lines of sight across galaxy halos, tend to reflect more averaged, often lower metallicities. QSO-DLAs metallicities also show a large scatter (e.g. Prochaska et al. 2003; Quiret et al. 2016; De Cia et al. 2018; Huyan et al. 2025).
The case of GRB 240218A is very extreme among GRB- and QSO-DLAs, which trace a common population of (low-mass) galaxies at intermediate redshifts, as it shows a difference of ∼1 dex towards higher metallicity compared to the rest of the sample at z > 59. On the other hand, this substantial enrichment of metals and dust of the ISM is in agreement with recent findings based on strong nebular emission lines of star-forming regions of high-redshift galaxies at z ∼ 7 observed with JWST (Langeroodi et al. 2023; Heintz et al. 2023a; Nakajima et al. 2023; Curti et al. 2024; Roberts-Borsani et al. 2024; Heintz et al. 2025), as well as with the metal and dust rich high-z quasars host galaxies (Tripodi et al. 2023, 2024; Salvestrini et al. 2025).
In Figure 6, we present a comparison of the H I and metallicities of these JWST-observed galaxies and of z > 6 GRBs DLAs. In principle, absorption and emission metallicities cannot be directly compared. However, here we are interested in a qualitative comparison only10. GRB 240218A DLA exhibits a comparatively high H I column density, which places it in the same region of the [M/H] − log(N(H I)/cm−2) plane occupied by JWST galaxies.
The fact that high H I column density and metallicity are found in GRB host galaxies is particularly interesting because, at high redshift, these galaxies are selected based only on being star-forming, thanks to the GRB explosion, without any selection in luminosity or emission line fluxes as in galaxy surveys.
While JWST usually allows the study of the metallicity of the ionized gas, the explosion of GRB 240218A has allowed a detailed chemical analysis of the neutral ISM of a high-redshift galaxy. These are unprecedented measurements for a galaxy at z ∼ 7. Another advantage of GRB host galaxy studies is that, in addition to the neutral gas absorption feature, it is possible to observe the continuum and emission lines of the host galaxy once the GRB afterglow has faded. Photometric and spectroscopic observations of the host galaxy of GRB 240218A with ALMA and JWST would provide a unique opportunity to integrate the chemical properties and the kinematics of the neutral gas studied in this work with those of the ionized gas (e.g. Schady et al. 2024), and add unprecedented levels of detail to the chemical and physical properties of high-redshift galaxies. In this sense, it will also be possible to compare these future results with those of other GRB host galaxies at high redshift by starting to construct a useful sample.
Our results emphasize that ground-based spectroscopic observations of absorption lines in the spectra of bright-background sources, such as GRBs, are powerful tools for exploring the chemical properties of the neutral gas in distant galaxies. It has been shown (e.g. Ghirlanda et al. 2015) that to efficiently detect the prompt emission from high-redshift GRBs (that is the necessary first step to trigger the afterglow observations), it is essential to extend the energy range of space satellite detectors of the prompt emission to lower energies (e.g. SVOM, launched in June 2024, Wei et al. 2016; Einstein Probe, Yuan et al. 2015, 2022), and to improve sensitivity to lower flux-detection limits (e.g. THESEUS, selected for ESA M7 Phase-A, Amati et al. 2018; Tanvir et al. 2021). We also stress that the localization capabilities of a mission with such characteristics is fundamental to enhance the possibility of optical/NIR spectroscopic observations with high SNR of GRBs afterglows. Furthermore, high-resolution absorption spectroscopy of the X-ray afterglow by the ESA large mission NewAthena can extend our knowledge of the metal abundances much closer to the GRB, thus providing powerful diagnostics of the GRB progenitors in the high-redshift Universe (Piro et al. 2022).
The results of our study of GRB 240218A motivate pursuing GRB-dedicated space missions to fully exploit the possibility to use GRBs to explore the high-redshift Universe, in synergy with forthcoming ground-based instruments such as the Son Of X-Shooter (SOXS, Schipani et al. 2018), and new facilities such as the future European Southern Observatory (ESO)/Extremely Large Telescope (ELT) equipped with the ArmazoNes high Dispersion Echelle Spectrograph (ANDES) high-resolution spectrograph (Marconi et al. 2024; D’Odorico et al. 2024). Furthermore, a novel approach to the discovery of high-redshift GRBs such as the High-z Universe GRB Observatory (HUGO, Campana et al. 2022) will complement the above efforts, taking advantage of the deep monitoring of the sky by the Vera Rubin Observatory (Ivezić et al. 2019), to simultaneously observe exactly the same fields with a dedicated NIR facility.
Acknowledgments
A.S. acknowledges financial support from the Centre national d’études spatiales (CNES), France (ROR: https://ror.org/04h1h0y33) within the framework of the SVOM mission. S.D.V. acknowledges the support of the French Agence Nationale de la Recherche (ANR), under grant ANR-23-CE31-0011 (project PEGaSUS). L.I. acknowledges financial support from the INAF Data Grant Program “YES” (PI: Izzo) Multi-wavelength and multi messenger analysis of relativistic supernovae. This work has received funding from the Swiss State Secretariat for Education, Research and Innovation (SERI) under contract number MB22.00072. D.B.M. is funded by the European Union (ERC, HEAVYMETAL, 101071865). Views and opinions expressed are, however, those of the authors only and do not necessarily reflect those of the European Union or the European Research Council. Neither the European Union nor the granting authority can be held responsible for them. The Cosmic Dawn Center (DAWN) is funded by the Danish National Research Foundation under grant DNRF140. NRT acknowledges support from STFC Consolidated Grant ST/W000857/1. R.B. acknowledges funding from the Italian Space Agency, contract ASI/INAF n. I/004/11/6.
References
- Amati, L., O’Brien, P., Götz, D., et al. 2018, Adv. Space Res., 62, 191 [Google Scholar]
- Asplund, M., Amarsi, A. M., & Grevesse, N. 2021, A&A, 653, A141 [NASA ADS] [CrossRef] [EDP Sciences] [Google Scholar]
- Barthelmy, S. D., Barbier, L. M., Cummings, J. R., et al. 2005, Space Sci. Rev., 120, 143 [Google Scholar]
- Bolmer, J., Ledoux, C., Wiseman, P., et al. 2019, A&A, 623, A43 [NASA ADS] [CrossRef] [EDP Sciences] [Google Scholar]
- Brivio, R., Campana, S., Covino, S., et al. 2025, A&A, 695, A239 [NASA ADS] [CrossRef] [EDP Sciences] [Google Scholar]
- Bunker, A. J., Saxena, A., Cameron, A. J., et al. 2023, A&A, 677, A88 [NASA ADS] [CrossRef] [EDP Sciences] [Google Scholar]
- Burrows, D. N., Hill, J. E., Nousek, J. A., et al. 2005, Space Sci. Rev., 120, 165 [Google Scholar]
- Campana, S., Ghirlanda, G., Salvaterra, R., et al. 2022, Nat. Astron., 6, 1101 [Google Scholar]
- Cano, Z., Wang, S.-Q., Dai, Z.-G., & Wu, X.-F. 2017, Adv. Astron., 2017, 8929054 [CrossRef] [Google Scholar]
- Carniani, S., D’Eugenio, F., Ji, X., et al. 2025, A&A, 696, A87 [NASA ADS] [CrossRef] [EDP Sciences] [Google Scholar]
- Carswell, R. F., & Webb, J. K. 2014, Astrophysics Source Code Library [record ascl:1408.015] [Google Scholar]
- Castellano, M., Napolitano, L., Fontana, A., et al. 2024, ApJ, 972, 143 [Google Scholar]
- Chornock, R., Berger, E., Fox, D. B., et al. 2013, ApJ, 774, 26 [NASA ADS] [CrossRef] [Google Scholar]
- Christensen, L., Jakobsen, P., Willott, C., et al. 2023, A&A, 680, A82 [NASA ADS] [CrossRef] [EDP Sciences] [Google Scholar]
- Cooke, R., Pettini, M., Steidel, C. C., Rudie, G. C., & Nissen, P. E. 2011, MNRAS, 417, 1534 [CrossRef] [Google Scholar]
- Cucchiara, A., Levan, A. J., Fox, D. B., et al. 2011, ApJ, 736, 7 [Google Scholar]
- Cupani, G., D’Odorico, V., Cristiani, S., et al. 2020, SPIE Conf. Ser., 11452, 114521U [NASA ADS] [Google Scholar]
- Curti, M., Maiolino, R., Curtis-Lake, E., et al. 2024, A&A, 684, A75 [NASA ADS] [CrossRef] [EDP Sciences] [Google Scholar]
- Curti, M., Witstok, J., Jakobsen, P., et al. 2025, A&A, 697, A89 [Google Scholar]
- D’Avanzo, P., Ferro, M., Brivio, R., et al. 2024, GCN, 35747, 1 [Google Scholar]
- De Cia, A., Ledoux, C., Savaglio, S., Schady, P., & Vreeswijk, P. M. 2013, A&A, 560, A88 [NASA ADS] [CrossRef] [EDP Sciences] [Google Scholar]
- De Cia, A., Ledoux, C., Mattsson, L., et al. 2016, A&A, 596, A97 [NASA ADS] [CrossRef] [EDP Sciences] [Google Scholar]
- De Cia, A., Ledoux, C., Petitjean, P., & Savaglio, S. 2018, A&A, 611, A76 [NASA ADS] [CrossRef] [EDP Sciences] [Google Scholar]
- De Cia, A., Jenkins, E. B., Fox, A. J., et al. 2021, Nature, 597, 206 [NASA ADS] [CrossRef] [Google Scholar]
- De Cia, A., Roman-Duval, J., Konstantopoulou, C., et al. 2024, A&A, 683, A216 [NASA ADS] [CrossRef] [EDP Sciences] [Google Scholar]
- de Ugarte Postigo, A., Fynbo, J. P. U., Thöne, C. C., et al. 2012, A&A, 548, A11 [NASA ADS] [CrossRef] [EDP Sciences] [Google Scholar]
- de Wet, S., Izzo, L., Groot, P. J., et al. 2023, A&A, 677, A32 [NASA ADS] [CrossRef] [EDP Sciences] [Google Scholar]
- D’Elia, V., Fiore, F., Perna, R., et al. 2009a, ApJ, 694, 332 [CrossRef] [Google Scholar]
- D’Elia, V., Fiore, F., Perna, R., et al. 2009b, A&A, 503, 437 [CrossRef] [EDP Sciences] [Google Scholar]
- D’Elia, V., Fynbo, J. P. U., Covino, S., et al. 2010, A&A, 523, A36 [NASA ADS] [CrossRef] [EDP Sciences] [Google Scholar]
- D’Elia, V., Campana, S., Covino, S., et al. 2011, MNRAS, 418, 680 [CrossRef] [Google Scholar]
- D’Elia, V., Fynbo, J. P. U., Goldoni, P., et al. 2014, A&A, 564, A38 [NASA ADS] [CrossRef] [EDP Sciences] [Google Scholar]
- Dessauges-Zavadsky, M., Prochaska, J. X., D’Odorico, S., Calura, F., & Matteucci, F. 2006, A&A, 445, 93 [NASA ADS] [CrossRef] [EDP Sciences] [Google Scholar]
- D’Eugenio, F., Maiolino, R., Carniani, S., et al. 2024, A&A, 689, A152 [NASA ADS] [CrossRef] [EDP Sciences] [Google Scholar]
- D’Odorico, V., Bañados, E., Becker, G. D., et al. 2023, MNRAS, 523, 1399 [CrossRef] [Google Scholar]
- D’Odorico, V., Bolton, J. S., Christensen, L., et al. 2024, Exp. Astron., 58, 21 [Google Scholar]
- Evans, P. A., Goad, M. R., Osborne, J. P., Beardmore, A. P., & Swift-XRT Team 2024, GCN, 36166, 1 [Google Scholar]
- Fan, X., Carilli, C. L., & Keating, B. 2006, ARA&A, 44, 415 [Google Scholar]
- Fausey, H. M., Vejlgaard, S., van der Horst, A. J., et al. 2025, MNRAS, 536, 2839 [Google Scholar]
- Foreman-Mackey, D., Hogg, D. W., Lang, D., & Goodman, J. 2013, PASP, 125, 306 [Google Scholar]
- Fruchter, A. S., Levan, A. J., Strolger, L., et al. 2006, Nature, 441, 463 [NASA ADS] [CrossRef] [Google Scholar]
- Fynbo, J. P. U., Prochaska, J. X., Sommer-Larsen, J., Dessauges-Zavadsky, M., & Møller, P. 2008, ApJ, 683, 321 [NASA ADS] [CrossRef] [Google Scholar]
- Gehrels, N., & Razzaque, S. 2013, Front. Phys., 8, 661 [Google Scholar]
- Gehrels, N., Chincarini, G., Giommi, P., et al. 2004, ApJ, 611, 1005 [Google Scholar]
- Ghirlanda, G., Salvaterra, R., Ghisellini, G., et al. 2015, MNRAS, 448, 2514 [Google Scholar]
- Goldoni, P., Royer, F., François, P., et al. 2006, SPIE Conf. Ser., 6269, 62692K [Google Scholar]
- Hainline, K. N., D’Eugenio, F., Jakobsen, P., et al. 2024, ApJ, 976, 160 [NASA ADS] [CrossRef] [Google Scholar]
- Hartoog, O. E., Wiersema, K., Vreeswijk, P. M., et al. 2013, MNRAS, 430, 2739 [NASA ADS] [CrossRef] [Google Scholar]
- Hartoog, O. E., Malesani, D., Fynbo, J. P. U., et al. 2015, A&A, 580, A139 [NASA ADS] [CrossRef] [EDP Sciences] [Google Scholar]
- Heintz, K. E., Bolmer, J., Ledoux, C., et al. 2019, A&A, 629, A131 [NASA ADS] [CrossRef] [EDP Sciences] [Google Scholar]
- Heintz, K. E., Brammer, G. B., Giménez-Arteaga, C., et al. 2023a, Nat. Astron., 7, 1517 [NASA ADS] [CrossRef] [Google Scholar]
- Heintz, K. E., De Cia, A., Thöne, C. C., et al. 2023b, A&A, 679, A91 [NASA ADS] [CrossRef] [EDP Sciences] [Google Scholar]
- Heintz, K. E., Watson, D., Brammer, G., et al. 2024, Science, 384, 890 [NASA ADS] [CrossRef] [Google Scholar]
- Heintz, K. E., Brammer, G. B., Watson, D., et al. 2025, A&A, 693, A60 [Google Scholar]
- Hjorth, J., Sollerman, J., Møller, P., et al. 2003, Nature, 423, 847 [Google Scholar]
- Hjorth, J., Malesani, D., Jakobsson, P., et al. 2012, ApJ, 756, 187 [Google Scholar]
- Huyan, J., Kulkarni, V. P., Poudel, S., et al. 2025, ApJ, 991, 228 [Google Scholar]
- Ivezić, Ž., Kahn, S. M., Tyson, J. A., et al. 2019, ApJ, 873, 111 [Google Scholar]
- Kann, D. A., White, N. E., Ghirlanda, G., et al. 2024, A&A, 686, A56 [NASA ADS] [CrossRef] [EDP Sciences] [Google Scholar]
- Kawai, N., Kosugi, G., Aoki, K., et al. 2006, Nature, 440, 184 [NASA ADS] [CrossRef] [Google Scholar]
- Konstantopoulou, C., De Cia, A., Krogager, J.-K., et al. 2022, A&A, 666, A12 [NASA ADS] [CrossRef] [EDP Sciences] [Google Scholar]
- Konstantopoulou, C., De Cia, A., Ledoux, C., et al. 2024, A&A, 681, A64 [NASA ADS] [CrossRef] [EDP Sciences] [Google Scholar]
- Krogager, J. K., De Cia, A., Heintz, K. E., et al. 2024, MNRAS, 535, 561 [Google Scholar]
- Langeroodi, D., Hjorth, J., Chen, W., et al. 2023, ApJ, 957, 39 [NASA ADS] [CrossRef] [Google Scholar]
- Laskar, T., Peña, C., Schroeder, G., & Alexander, K. D. 2024, GCN, 35878, 1 [Google Scholar]
- Ledoux, C., Vreeswijk, P. M., Smette, A., et al. 2009, A&A, 506, 661 [NASA ADS] [CrossRef] [EDP Sciences] [Google Scholar]
- Li, Q., Narayanan, D., & Davé, R. 2019, MNRAS, 490, 1425 [CrossRef] [Google Scholar]
- Madau, P., & Dickinson, M. 2014, ARA&A, 52, 415 [Google Scholar]
- Malesani, D. B. 2024, GCN, 35749, 1 [Google Scholar]
- Marconi, A., Abreu, M., Adibekyan, V., et al. 2024, SPIE Conf. Ser., 13096, 1309613 [Google Scholar]
- Miralda-Escudé, J. 1998, ApJ, 501, 15 [CrossRef] [Google Scholar]
- Modigliani, A., Goldoni, P., Royer, F., et al. 2010, Proc. SPIE, 7737, 773728 [Google Scholar]
- Nakajima, K., Ouchi, M., Isobe, Y., et al. 2023, ApJS, 269, 33 [NASA ADS] [CrossRef] [Google Scholar]
- Newville, M., Otten, R., Nelson, A., et al. 2025, https://doi.org/10.5281/zenodo.598352 [Google Scholar]
- Page, K. L., Parsotan, T. M., Siegel, M. H., & Neil Gehrels Swift Observatory Team. GCN, 35742, 1 [Google Scholar]
- Péroux, C., & Howk, J. C. 2020, ARA&A, 58, 363 [CrossRef] [Google Scholar]
- Piro, L., Ahlers, M., Coleiro, A., et al. 2022, Exp. Astron., 54, 23 [NASA ADS] [CrossRef] [Google Scholar]
- Planck Collaboration XIII. 2016, A&A, 594, A13 [NASA ADS] [CrossRef] [EDP Sciences] [Google Scholar]
- Prantzos, N., Charbonnel, C., & Iliadis, C. 2007, A&A, 470, 179 [CrossRef] [EDP Sciences] [Google Scholar]
- Prochaska, J. X. 2006, ApJ, 650, 272 [NASA ADS] [CrossRef] [Google Scholar]
- Prochaska, J. X., Gawiser, E., Wolfe, A. M., Castro, S., & Djorgovski, S. G. 2003, ApJ, 595, L9 [NASA ADS] [CrossRef] [Google Scholar]
- Prochaska, J. X., Chen, H.-W., & Bloom, J. S. 2006, ApJ, 648, 95 [NASA ADS] [CrossRef] [Google Scholar]
- Prochaska, J. X., Dessauges-Zavadsky, M., Ramirez-Ruiz, E., & Chen, H.-W. 2008, ApJ, 685, 344 [Google Scholar]
- Pugliese, G., Saccardi, A., D’Elia, V., et al. 2024, A&A, 690, A35 [NASA ADS] [CrossRef] [EDP Sciences] [Google Scholar]
- Quiret, S., Péroux, C., Zafar, T., et al. 2016, MNRAS, 458, 4074 [NASA ADS] [CrossRef] [Google Scholar]
- Rafelski, M., Wolfe, A. M., Prochaska, J. X., Neeleman, M., & Mendez, A. J. 2012, ApJ, 755, 89 [NASA ADS] [CrossRef] [Google Scholar]
- Ramburuth-Hurt, T., De Cia, A., Krogager, J. K., et al. 2023, A&A, 672, A68 [NASA ADS] [CrossRef] [EDP Sciences] [Google Scholar]
- Roberts-Borsani, G., Treu, T., Shapley, A., et al. 2024, ApJ, 976, 193 [NASA ADS] [CrossRef] [Google Scholar]
- Roming, P. W. A., Kennedy, T. E., Mason, K. O., et al. 2005, Space Sci. Rev., 120, 95 [Google Scholar]
- Rossi, A., Frederiks, D. D., Kann, D. A., et al. 2022, A&A, 665, A125 [NASA ADS] [CrossRef] [EDP Sciences] [Google Scholar]
- Rossi, A., Maiorano, E., Stratta, G., D’Avanzo, P., & CIBO Collaboration 2024, GCN, 35762, 1 [Google Scholar]
- Saccardi, A., Vergani, S. D., De Cia, A., et al. 2023, A&A, 671, A84 [NASA ADS] [CrossRef] [EDP Sciences] [Google Scholar]
- Saccardi, A., Malesani, D. B., Palmerio, J. T., et al. 2024, GCN, 35756, 1 [Google Scholar]
- Salvaterra, R., Della Valle, M., Campana, S., et al. 2009, Nature, 461, 1258 [NASA ADS] [CrossRef] [PubMed] [Google Scholar]
- Salvestrini, F., Feruglio, C., Tripodi, R., et al. 2025, A&A, 695, A23 [NASA ADS] [CrossRef] [EDP Sciences] [Google Scholar]
- Schady, P., Yates, R. M., Christensen, L., et al. 2024, MNRAS, 529, 2807 [NASA ADS] [CrossRef] [Google Scholar]
- Schipani, P., Campana, S., Claudi, R., et al. 2018, SPIE Conf. Ser., 10702, 107020F [Google Scholar]
- Schroeder, G., Peña, C., Laskar, T., & Alexander, K. D. 2024, GCN, 35794, 1 [Google Scholar]
- Selsing, J., Malesani, D., Goldoni, P., et al. 2019, A&A, 623, A92 [NASA ADS] [CrossRef] [EDP Sciences] [Google Scholar]
- Sodini, A., D’Odorico, V., Salvadori, S., et al. 2024, A&A, 687, A314 [NASA ADS] [CrossRef] [EDP Sciences] [Google Scholar]
- Sparre, M., Hartoog, O. E., Krühler, T., et al. 2014, ApJ, 785, 150 [NASA ADS] [CrossRef] [Google Scholar]
- Spitzer, L. 1998, Physical Processes in the Interstellar Medium (Wiley) [Google Scholar]
- Tanvir, N. R., Fox, D. B., Levan, A. J., et al. 2009, Nature, 461, 1254 [Google Scholar]
- Tanvir, N. R., Fynbo, J. P. U., de Ugarte Postigo, A., et al. 2019, MNRAS, 483, 5380 [Google Scholar]
- Tanvir, N. R., Le Floc’h, E., Christensen, L., et al. 2021, Exp. Astron., 52, 219 [NASA ADS] [CrossRef] [Google Scholar]
- Tepper-García, T. 2006, MNRAS, 369, 2025 [CrossRef] [Google Scholar]
- Thakur, A. L., Ricci, R., Bruni, G., et al. 2024, GCN, 35866, 1 [Google Scholar]
- Thöne, C. C., Fynbo, J. P. U., Goldoni, P., et al. 2013, MNRAS, 428, 3590 [CrossRef] [Google Scholar]
- Totani, T., Kawai, N., Kosugi, G., et al. 2006, PASJ, 58, 485 [NASA ADS] [Google Scholar]
- Totani, T., Aoki, K., Hattori, T., et al. 2014, PASJ, 66, 63 [NASA ADS] [Google Scholar]
- Tripodi, R., Feruglio, C., Kemper, F., et al. 2023, ApJ, 946, L45 [NASA ADS] [CrossRef] [Google Scholar]
- Tripodi, R., Feruglio, C., Fiore, F., et al. 2024, A&A, 689, A220 [NASA ADS] [CrossRef] [EDP Sciences] [Google Scholar]
- Umeda, H., Ouchi, M., Nakajima, K., et al. 2024, ApJ, 971, 124 [NASA ADS] [CrossRef] [Google Scholar]
- Vanni, I., Salvadori, S., D’Odorico, V., Becker, G. D., & Cupani, G. 2024, ApJ, 967, L22 [NASA ADS] [CrossRef] [Google Scholar]
- Velichko, A., De Cia, A., Konstantopoulou, C., et al. 2024, A&A, 685, A103 [NASA ADS] [CrossRef] [EDP Sciences] [Google Scholar]
- Vernet, J., Dekker, H., D’Odorico, S., et al. 2011, A&A, 536, A105 [NASA ADS] [CrossRef] [EDP Sciences] [Google Scholar]
- Vreeswijk, P. M., Ledoux, C., Smette, A., et al. 2007, A&A, 468, 83 [CrossRef] [EDP Sciences] [Google Scholar]
- Vreeswijk, P. M., Ledoux, C., De Cia, A., & Smette, A. 2012, Mem. Soc. Astron. Ital. Suppl., 21, 14 [Google Scholar]
- Vreeswijk, P. M., Ledoux, C., Raassen, A. J. J., et al. 2013, A&A, 549, A22 [NASA ADS] [CrossRef] [EDP Sciences] [Google Scholar]
- Watson, D., Fynbo, J. P. U., Ledoux, C., et al. 2006, ApJ, 652, 1011 [NASA ADS] [CrossRef] [Google Scholar]
- Watson, D., Christensen, L., Knudsen, K. K., et al. 2015, Nature, 519, 327 [Google Scholar]
- Wei, J., Cordier, B., Antier, S., et al. 2016, arXiv e-prints [arXiv:1610.06892] [Google Scholar]
- Welsh, e. a. 2022, ApJ, 929, 158 [NASA ADS] [CrossRef] [Google Scholar]
- Welsh, e. a. 2024, A&A, 691, A285 [NASA ADS] [CrossRef] [EDP Sciences] [Google Scholar]
- Wiseman, P., Perley, D. A., Schady, P., et al. 2017, A&A, 607, A107 [NASA ADS] [CrossRef] [EDP Sciences] [Google Scholar]
- Witstok, J., Jakobsen, P., Maiolino, R., et al. 2025, Nature, 639, 897 [Google Scholar]
- Woosley, S. E., & Bloom, J. S. 2006, ARA&A, 44, 507 [Google Scholar]
- Yates, R. M., Péroux, C., & Nelson, D. 2021, MNRAS, 508, 3535 [NASA ADS] [CrossRef] [Google Scholar]
- Yuan, W., Zhang, C., Feng, H., et al. 2015, arXiv e-prints [arXiv:1506.07735] [Google Scholar]
- Yuan, W., Zhang, C., Chen, Y., & Ling, Z. 2022, in Handbook of X-ray and Gamma-ray Astrophysics, eds. C. Bambi, & A. Sangangelo (Springer), 86 [Google Scholar]
Based on observations carried out under ESO prog. ID 110.24CF.015 (PI: N. Tanvir) with the X-shooter spectrograph installed at the Cassegrain focus of the Very Large Telescope (VLT), Unit 3 - Melipal, operated by the European Southern Observatory (ESO) on Cerro Paranal, Chile.
Note that the component-by-component analysis is limited by the spectral resolving power, and it is unlikely that we resolve individual gas clouds. When we refer to components, we mean groups of gas clouds that can be separated at the resolution of the X-shooter spectra. Higher-resolution observations would almost certainly reveal a larger number of narrower sub-components.
The column densities in the case of lower limits are not infinitely large. An estimated upper bound (using a low b Doppler parameter, e.g. 5 km s−1, and varying the column density) is log(N(X)/cm−2)∼18, where X is one of the identified saturated metals, except Fe. Given a good SNR and the absence of blends, the Fe IIλ2260 transition made it possible to estimate a more constrained range for FeII column density, 16.0 < log(N(Fe II)/cm−2) < 16.8.
The Cr IIλ2066 transition, which would be the weakest of the triplet (Cr IIλ2056, Cr IIλ2062, Cr IIλ2066) is strongly affected by a sky line.
The same method was applied for Zn IIλ2026, which is blended with Mg Iλ2026.
For more details on the method please refer to De Cia et al. (2024) (particularly Figure 3) and Konstantopoulou et al. (2024); see also Saccardi et al. (2023) for a direct application of such a method to the high-redshift case of GRB 210905A.
In previous high-redshift GRB-DLAs there is evidence of an Al overabundance (see Sect. 4). Its deviation from the linear fit is possibly related to the contribution of very massive stars rather than dust depletion. Furthermore, the ISM abundance of alpha-elements such as Si can be higher in systems with alpha-element enhancements (which are expected at z > 6) due to recent contribution of core-collapse supernovae (De Cia et al. 2024; Velichko et al. 2024). Thus, Al and Si need to be excluded from the analysis of the abundance pattern and not be taken into account during the fit procedure.
GRB 050401; GRB 111008A; GRB 120119A; GRB 120327A; GRB 120716A; GRB 120815A; GRB 140311A; GRB 141109A; GRB 151021A; GRB 180325A; GRB 181020A; GRB 190114A.
However, it is worth noting that a small number of QSO-DLAs at z < 6 have also been found to exhibit similarly high metallicities (e.g. Rafelski et al. 2012; De Cia et al. 2018), although such systems remain rare.
GRB afterglow low-ionization absorption lines provide a direct measurement of the metallicity of the neutral gas along the line of sight, whereas metallicities inferred from emission lines refer to the ionized gas. Furthermore, they are derived from indirect indicators, that we expect to depend on the physical conditions of the gas; hence, the choice of calibration makes them subject to systematic effects. However, for GRB host galaxies, Schady et al. (2024) found that when using the most reliable indicators, there is a clear relation between absorption and emission metallicities, which appear broadly consistent within the combined systematic uncertainties.
Appendix A: UV pumping and photoionization model
Absorption lines arising from metastable levels were already detected in other GRB afterglow spectra, e.g. Fe II*, Ni II* (Vreeswijk et al. 2007; D’Elia et al. 2009b; D’Elia et al. 2010; D’Elia et al. 2011; D’Elia et al. 2014). As fine-structure lines, the corresponding energy levels have been shown to be populated by the UV radiation from the burst and early afterglow (Vreeswijk et al. 2007; D’Elia et al. 2009b). Together with fine-structure lines, excited absorption features produced by metastable levels are used to determine the distance of the closest gas clouds from the GRB responsible for the UV/optical absorption lines (Vreeswijk et al. 2007; Prochaska et al. 2008; D’Elia et al. 2009b; Vreeswijk et al. 2012, 2013). Since the lifetime of atomic levels is increasingly shorter as the principal quantum number (n) grows, during the spontaneous decay process lower levels are populated, either with n > 1 (excited states), or with n = 1 (the so-called fine-structure levels of the ground state). This process is known as indirect UV pumping and is opposed to the other mechanism able to populate higher levels of the ions and atoms: the collisional processes. The evidence of UV pumping as the primary factor responsible for the population of fine-structure/metastable levels this excitation comes from the variability of the fine-structure levels, which has been reported every time multi-epoch spectroscopy was available (e.g. Prochaska et al. 2006; Vreeswijk et al. 2007; D’Elia et al. 2009a).
For GRB 240218A we have (see Table 2) the detection of the Fe II ground state, (principal quantum number n = 1, configuration 3d6(5D)4s, term a6D9/2), the first fine-structure level (term a6D7/2), and the ground state of the n = 2 level (n = 2, 3d7, a4F9/2). These levels have been detected both for component II and III. Instead, no absorption lines are detected at the wavelength corresponding to the fine structure transitions of Ni II. The low SNR and the strong atmospheric absorption in the region of the spectrum where the Ni II multiplets (Ni IIλ1317, Ni IIλ1370, Ni IIλ1454 and Ni IIλ1709, Ni IIλ1741, Ni IIλ1751) fall prevent us from determining how much Ni II is in the ground state compared to the excited levels. The scenario in which the Ni II ground state is absent and the Ni II is all in the excited states could be also explained by the fact that it takes a long time for the ion to decay to the Ni II ground state, ∼37 hr (Vreeswijk et al. 2007). Hence, transitions from Ni II, and also Fe II, metastable levels serve as strong indicators of the UV pumping mechanism, as they can be detected several hours post-GRB event. Unfortunately, we do not have multi-epoch spectroscopy. However, the Fe IIn = 2, 3d7, a4F9/2 level has a column density higher than that of the n = 1, 3d6(5D)4s, a6D7/2 one (Table 2). For electronic densities larger than ne = 103 cm−3 the collisional processes populate levels according to a Boltzmann distribution, with the lower energy levels being the most populated (see, e.g., Prochaska et al. 2006, Fig. 12). This does not hold anymore for lower values of ne, where the populations become inverted. Nevertheless, as noted by the same authors, observing an inverted population of Fe II levels is challenging, because the absolute excitation rate of Fe II is small for ne < 103 cm−3 (Prochaska et al. 2006). In case of a Boltzmann distribution, the multiplicity term 2j + 1 enables the n = 2 excited level (j = 9/2) to have a column density 20% higher than the n = 1 first fine structure level (j = 7/2). This may account for part of the observed overabundance of the n = 2 level, whose column density is a factor of 5 (15) higher in component II (III), with respect to the n = 1 one. All things considered, this scenario favors a UV pumping excitation mechanism, although we cannot firmly rule out that at least part of the fine structure lines are produced by collisional processes. The input of the code (see Vreeswijk et al. 2007; D’Elia et al. 2009a, for more detail) is the initial column density of the Fe II, which is assumed to be completely in the ground state before it is hit by the GRB afterglow radiation and the Doppler parameter of the absorbing gas. These data have been taken from Table 2 (for the initial column density we summed the columns of the three Fe II levels). We stress that the estimated distances derived from the photoionization model could be larger if the possible saturation issue is not negligible.
Appendix B: Curve of growth analysis
The CoG (for an exhaustive description of the method please refer to eq. 3-50, 3-51 of Spitzer 1998) can be segmented into three smoothly connected regimes, each illustrating a distinct relationship between EW and N: at low EW values (< 0.1 Å), EW is linearly correlated with column density. For intermediate values, the correlation becomes logarithmic (EW ∝ log(τ)∝Ni/b), and at high values, we observe  . In the latter two regimes, absorption lines are affected by saturation, making precise Ni estimation challenging, as small EW variations correspond to large Ni changes. This issue can be mitigated by measuring multiple lines from the same transition, particularly if they originate from the ground state to the first excited level, where ions have similar excitation energies and share a common kinetic distribution.
In the spectrum of GRB 240218A, we identified three sets of spectral transitions, Fe II, Zn II, and Cr II, originating from the ground state to the first excited state. These transitions have consistent column densities and ionization potentials. We measured the equivalent widths of these absorption lines (presented in Table B.1), taking into account that Zn IIλ2062 and Cr IIλ2062 are blended. For the blend feature at 2062 Å, we first determined the Cr II column density from the adjacent, unblended Cr IIλ2056 transition. Based on this N(Cr II) and the effective Doppler parameter b, we calculated the expected equivalent width of the Cr IIλ2062 component, being EWCr II λ2062 = 0.59 ± 0.07 Å. This calculated equivalent width was then subtracted from the total measured equivalent width of the 2062 Å blend to extract the equivalent width of the isolated Zn IIλ2062 line. This residual equivalent width was subsequently used to derive N(Zn II). A similar sequential procedure was applied to deblend the 2026 Å feature, using the N(Zn II) derived from the corrected 2062 Å line: we calculated the expected equivalent width of the Zn IIλ2026 transition by subtracting this modeled contribution from the total measured equivalent width of the 2026 Å blend, we isolated the equivalent width of the Mg Iλ2026 line, allowing for the determination of N(Mg I). All our final measurements and resulting EWs are reported in Table B.1. Finally, we fit the CoG with free parameters for b and the column densities of Fe, Zn, and Cr using a uniform prior within a Monte Carlo Markov Chain (MCMC) sampling framework implemented in Python emcee package (Foreman-Mackey et al. 2013). For further details on the computational method, refer to de Wet et al. (2023). The results from the CoG supports and confirms the results obtained using Voigt Fit of absorption lines. The results derived from the MCMC procedure are shown in Table B.1.
Rest frame equivalent widths of the identified absorption lines used to perform the curve of growth analysis.
Appendix C: Nucleosynthesis and component-by-component analysis
We inspect also the [X/Fe] residuals (over- and under-abundance of different elements with respect to iron i.e. after correcting for dust depletion), as shown in Figure C.1. They represents the deviations from the linear fits of Figure 4 which are likely due to the effects of nucleosynthesis, or peculiar abundances in the host ISM. The corresponding values and errors are reported in Table C.1. Given the small number of elements available we do not compare our results with nucleosynthetic models. Note that this analysis on the chemical enrichment and dust depletion has been performed assuming, in some cases, column densities of Fe II, Cr II, and Zn II as measurements to perform a linear fit (despite being aware of the limitations of the spectral data, especially regarding the saturation issue). It should also be noted that Al II is traced by a single available transition, and the component I is significantly affected by noise. Nevertheless, the velocity structure and component profiles of the Al IIλ1670 transition closely match those of Si IIλ1526, supporting the physical reality of the identified components and suggesting that both species trace the same gas phase.
 |
Fig. C.1. Abundances of different elements with respect to iron after correcting for dust depletion, for the total analysis. Limits are indicated by arrows and the error bars represent the uncertainty propagated from column density measurements; the violin plots represents the uncertainty caused by dust depletion estimated using one million Monte Carlo realizations of the [Zn/Fe]fit. |
 |
Fig. C.2. Similar to Figure 4, but for the individual components of the absorption-line profile. In this case y can be interpreted as an equivalent metal column (given that the information on the H I is not available)) and it is defined in detail in Ramburuth-Hurt et al. (2023). Again, the slope of the linear fit to the data (solid line) determines the overall strength of depletion [Zn/Fe]fit, as labeled. |
[X/Fe] residuals of the depletion pattern fitting (see Figures 4 and C.2).
All Tables
Top: Logarithmic column density of low-ionization lines. Bottom: Column density of high-ionization lines.
Rest frame equivalent widths of the identified absorption lines used to perform the curve of growth analysis.
All Figures
|
Fig. 1. VLT/X-shooter 1D spectrum of GRB 240218A. The grey curve shows the raw, stitched VIS+NIR arm, photometrically calibrated spectrum, and the black one shows the binned version (by a factor of 20). The best-fit DLA model with log(NHI/cm−2) = 22.5 ± 0.3 is shown as the red curve, with the uncertainty represented by the red shaded area. The blue lines correspond to IGM-only absorption for xHI = 0.3, 0.6, 0.9, without any DLA contribution. The connection region between the VIS and NIR arms is represented by the blue shaded area. |
| In the text | |
|
Fig. 2. VLT/X-shooter optical/NIR afterglow spectrum of GRB 240218A. Left panel: Selection of low-ionization absorption lines of the GRB host galaxy system. Here and in the following panels data are shown in black, the fit in green, the error spectrum in red, the continuum in blue, and the vertical dashed green lines indicate the center of the components. Middle panel: Fine-structure and excited-transition absorption lines of the GRB host galaxy system. Right panel: High-ionization absorption lines. All the plots are in velocity space and 0 was fixed at z = 6.782 (see Sect. 3), corresponding to the stronger low-ionization line component (II). |
| In the text | |
|
Fig. 3. Results obtained from the CoG analysis on the ISM absorption lines identified in the spectrum of GRB 240218A. The data points are color-coded with respect to different element transitions (see Table B.1). The grey shaded area represents the best-fit model, which results in the labeled value of the Doppler parameter; the dotted lines represent the linear-approximation regime and its 1σ confidence ranges. |
| In the text | |
|
Fig. 4. Abundance pattern observed in the host of GRB 240218A from the total absorption-line profile. The x-axis corresponds to x = B2X, while the y-axis is defined as y = log N(X)−log N(H)−X⊙ + 12 − A2X ∼ [X/H], where B2X and A2X were adopted from Konstantopoulou et al. (2022). The linear fit to the data (solid line) determines the dust depletion corrected metallicity [M/H]tot (intercept) and the overall strength of depletion [Zn/Fe]fit (slope). The H I error bar, which is the same for all the data points, is reported as σH I. See De Cia et al. (2021, 2024) and Konstantopoulou et al. (2024) for an exhaustive description of the method. |
| In the text | |
|
Fig. 5. Column density of Zn II and Cr II (Watson et al. 2006; Wiseman et al. 2017; Heintz et al. 2019; Bolmer et al. 2019; Selsing et al. 2019) versus log(N(H I)/cm−2) (Tanvir et al. 2019), color-coded by the GRB host galaxy redshift. GRB 240218A is marked and compared with the sample of GRBs for which these measurements are available. |
| In the text | |
|
Fig. 6. Metallicity as a function of log(N(H I)/cm−2) color-coded by the redshift for GRBs host galaxies and high-redshift galaxies observed with JWST. For GRBs hosts, we report the observed metallicity ([M/H], not corrected for dust depletion) determined from the afterglow spectra of GRBs at z ≳ 6, i.e. GRB 050904 (Kawai et al. 2006; Thöne et al. 2013; note that the measurements rely on a low-resolution spectrum), GRB 130606A (Hartoog et al. 2015; Heintz et al. 2023b), and GRB 210905A (Saccardi et al. 2023). For high-redshift galaxies, we report the oxygen based metallicity determined from emission lines and/or SED fitting for the recently discovered JWST high-redshift galaxies, i.e. GS-z14 (Carniani et al. 2025; Heintz et al. 2025), GS-z12 (D’Eugenio et al. 2024), GS-z11 (Hainline et al. 2024), GS-z13-LAE (Witstok et al. 2025), CEERS-43844, MACS0647-JD, CEERS-16943 (Heintz et al. 2024), and A1689-zD1 (Watson et al. 2015; Heintz et al., in prep.). The relationship between 12 + log(O/H) and [M/H] is defined by the comparison with the solar oxygen abundance, where [M/H] = 12 + log(O/H)−8.69 (Asplund et al. 2021). |
| In the text | |
|
Fig. C.1. Abundances of different elements with respect to iron after correcting for dust depletion, for the total analysis. Limits are indicated by arrows and the error bars represent the uncertainty propagated from column density measurements; the violin plots represents the uncertainty caused by dust depletion estimated using one million Monte Carlo realizations of the [Zn/Fe]fit. |
| In the text | |
|
Fig. C.2. Similar to Figure 4, but for the individual components of the absorption-line profile. In this case y can be interpreted as an equivalent metal column (given that the information on the H I is not available)) and it is defined in detail in Ramburuth-Hurt et al. (2023). Again, the slope of the linear fit to the data (solid line) determines the overall strength of depletion [Zn/Fe]fit, as labeled. |
| In the text | |
 |
Fig. C.3. Same as Figure C.1 but for component-by-component analysis. |
| In the text | |
Current usage metrics show cumulative count of Article Views (full-text article views including HTML views, PDF and ePub downloads, according to the available data) and Abstracts Views on Vision4Press platform.
Data correspond to usage on the plateform after 2015. The current usage metrics is available 48-96 hours after online publication and is updated daily on week days.
Initial download of the metrics may take a while.