| Issue |
A&A
Volume 709, May 2026
|
|
|---|---|---|
| Article Number | A250 | |
| Number of page(s) | 8 | |
| Section | Galactic structure, stellar clusters and populations | |
| DOI | https://doi.org/10.1051/0004-6361/202660074 | |
| Published online | 22 May 2026 | |
Revisiting the Galactic age–metallicity relation from wide white dwarf–main-sequence binaries
1
Departament de Física, Universitat Politècnica de Catalunya,
c/Esteve Terrades 5,
08860
Castelldefels,
Spain
2
Institut d’Estudis Espacials de Catalunya (IEEC),
C/Esteve Terrades, 1, Edifici RDIT,
08860
Castelldefels,
Spain
★ Corresponding author: This email address is being protected from spambots. You need JavaScript enabled to view it.
Received:
25
March
2026
Accepted:
15
April
2026
Abstract
Context. The age–metallicity relation (AMR) is a fundamental observational constraint for understanding the chemical evolution of the Galaxy. As reliable cosmochronometers, white dwarfs in binary systems with main-sequence companions (WD+MS binaries) provide excellent laboratories to study this relation since both components are expected to be coeval.
Aims. We constructed a sample of widely separated WD+MS binaries using data from the third data release of the Gaia mission in order to investigate the AMR of the Galactic disk.
Methods. The sample is identified using photometric measurements and parallaxes of both components. White dwarf ages were derived by interpolating their Gaia absolute G magnitudes and Gaia BP-RP colours within state-of-the-art white dwarf evolutionary sequences. We compiled publicly available [Fe/H] abundances for the main-sequence companions from the literature and combined them using different statistical approaches to obtain representative metallicity values for each system.
Results. We derived the AMR from several sub-samples of WD+MS that use independent measurements of [Fe/H] abundances and consistently find a large dispersion in [Fe/H] at all ages. This behaviour agrees with previous determinations of the AMR based on WD+MS binaries and on samples of isolated stars.
Conclusions. Our results reinforce the observational evidence that the AMR in the Galactic disk exhibits substantial intrinsic scatter, likely reflecting the combined effects of multiple mechanisms such as radial migration, inhomogeneous chemical enrichment, and variations in the star formation history.
Key words: stars: abundances / binaries: general / white dwarfs
© The Authors 2026
 Open Access article, published by EDP Sciences, under the terms of the Creative Commons Attribution License (https://creativecommons.org/licenses/by/4.0), which permits unrestricted use, distribution, and reproduction in any medium, provided the original work is properly cited.
This article is published in open access under the Subscribe to Open model. This email address is being protected from spambots. You need JavaScript enabled to view it. to support open access publication.
1 Introduction
The relation between stellar ages and chemical abundances provides a powerful observational constraint on the formation and evolution of the Milky Way. In particular, the age–metallicity relation (AMR) of Galactic disk stars encodes information about the chemical enrichment history of the interstellar medium and the dynamical and evolutionary processes that have shaped the Galactic disk (Twarog 1980; Minchev et al. 2013). Early observational studies of nearby F and G dwarfs revealed that the AMR in the solar neighbourhood exhibits a large dispersion in metallicity at a given age, challenging the predictions of simple models of Galactic chemical evolution (Edvardsson et al. 1993; Rocha-Pinto et al. 2000; Nordström et al. 2004). Subsequent analyses confirmed that the Galactic disk does not follow a simple monotonic age–metallicity sequence, suggesting that processes such as radial migration, variations in star formation efficiency, and spatially dependent enrichment histories play an important role in shaping the observed distribution of stellar ages and chemical abundances (Haywood 2008; Schönrich & Binney 2009; Frankel et al. 2018).
In recent years, the combination of large spectroscopic surveys with the precise astrometric measurements provided by the Gaia mission has dramatically improved our ability to explore the chemo-dynamical structure of the Milky Way. Surveys such as the Apache Point Observatory Galactic Evolution Experiment (APOGEE; Majewski et al. 2017) and the Large Sky Area Multi-Object Fiber Spectroscopic Telescope (LAMOST; Cui et al. 2012) now provide chemical abundances for hundreds of thousands of stars across large regions of the Galactic disk, while Gaia parallaxes enable improved determinations of stellar parameters and ages. These datasets have revealed a complex age–chemical structure in the Galactic disk, with the thin disk exhibiting a broad metallicity distribution at nearly all ages and the thick disk following a tighter age–abundance sequence (Feuillet et al. 2019; Queiroz et al. 2020; Sahlholdt et al. 2022; Anders et al. 2023). One of the most detailed observational views of the Galactic AMR was obtained using large samples of sub-giant stars with precise age estimates, which map the age–metallicity structure of the disk and its variation with galactocentric radius (Xiang & Rix 2022).
Despite major progress enabled by large photometric, spectroscopic, and astrometric surveys, robust age determinations for individual field stars remain challenging (Soderblom 2010; Tayar & Joyce 2025). Model systematics and parameter degeneracies can produce uncertainties of several gigayears, even when population-level trends are well defined (Jørgensen & Lindegren 2005; Ting & Rix 2019; Curtis et al. 2020).
White dwarfs offer a complementary approach to the determination of stellar ages. As the final evolutionary stage of the majority of stars, white dwarfs cool in a predictable manner over time, making them reliable cosmic chronometers (Garcia-Berro et al. 1988; Fontaine et al. 2001). Their cooling ages can be determined from atmospheric parameters and, when combined with estimates of the progenitor lifetimes inferred from the initial-final mass relation, provide robust determinations of the total ages of stellar systems (Fouesneau et al. 2019; Moss et al. 2022; Heintz et al. 2022). The precision of these measurements has improved considerably with the advent of Gaia, which provides accurate parallaxes and photometry for large samples of white dwarfs.
Binary systems composed of a white dwarf and a main-sequence companion (WD+MS binaries) constitute particularly valuable laboratories for studying the AMR. In wide systems that have evolved without mass transfer, the two stars are expected to share the same age and initial chemical composition. The white dwarf therefore provides a reliable age estimate through cosmochronology, while the metallicity of the system can be measured from the main-sequence companion. Previous work demonstrated the potential of this method by deriving the AMR of the solar neighbourhood using samples of wide WD+MS binaries identified in spectroscopic surveys (Zhao et al. 2011; Rebassa-Mansergas et al. 2016, 2021a). These studies found that the AMR inferred from such binaries is consistent with the large metallicity dispersion observed in field star samples.
For this work we further exploited the diagnostic power of WD+MS binaries by compiling publicly available metallicity determinations of the companions, and thus increased the number of systems with reliable age and chemical measurements. By combining precise white dwarf ages with metallicity measurements obtained from these multiple spectroscopic surveys, we revisited the AMR in the solar neighbourhood from wide WD+MS binaries.
The paper is organised as follows. In Section 2 we describe the sample of WD+MS binaries analysed in this work. In Section 3 we present the compilation of metallicities of the main-sequence companions. In Section 4 we derive the ages of the systems from the white dwarf components. In Section 5 we investigate the resulting AMR. Finally, Section 6 summarises our main results and conclusions.
2 The WD+MS sample
The WD+MS binary sample considered in this work is an updated version of the one we provided in Rebassa-Mansergas et al. (2021a), using the third data release (DR3) of Gaia (Gaia Collaboration 2023) to search for these pairs. We started with a list of white dwarf candidates identified by Gentile Fusillo et al. (2021), and selected those with a probability of being a white dwarf greater than 50 per cent and a parallax uncertainty better than 10 per cent. We then searched for main-sequence companions within 100 000 astronomical units of these white dwarfs, ensuring that the companions had good quality data by applying standard astrometric and photometric cuts (Gaia Collaboration 2018). The search resulted in the identification of 7249 WD+MS systems with distances of up to 500 parsec.
For this work we further restricted the sample to 4291 WD+MS with assigned spectral types to their white dwarfs, classified using artificial intelligence methods (García-Zamora et al. 2023, 2025). In particular, the former works apply a random forest algorithm to the Gaia BP and RP spectral coefficients to classify white dwarfs into different types with high accuracy (≈91 per cent for hydrogen-rich DA type white dwarfs; ≃75 per cent for non-DA type white dwarfs). Knowledge of the spectral type is required since the cooling, hence age, of a white dwarf depends on its atmospheric properties. The fact that these white dwarfs have an assigned spectral type from their Gaia spectra alleviates the risk of using a probability of being a white dwarf as low as 50 per cent from Gentile Fusillo et al. (2019) to select candidates.
3 Main-sequence [Fe/H] abundances
We searched for available [Fe/H] abundances by matching the coordinates or Gaia IDs of the main-sequence companions in our sample of 4291 WD+MS systems across different large-scale studies, which maximised the number of matches relative to smaller samples. This came at the cost of methodological heterogeneity, as the abundances were derived using approaches ranging from direct spectroscopy to data-driven or machine-learning estimates that may not rely on the full observed spectra. This caveat is accounted for in our derivation of AMR in Section 5. The large-scale studies considered are the following:
Ye et al. (2025), who developed a catalogue of atmospheric parameters for 68 million stars derived from Gaia BP/RP spectra by fitting synthetic spectra based on stellar atmosphere models. BP/RP fluxes are corrected using relations involving stellar colour, magnitude, and interstellar extinction. The claimed [Fe/H] precision oscillates between 0.12 and 0.19 dex. The search resulted in 532 matches.
Huang et al. (2025), who estimated metallicities for about 100 million stars from synthetic Gaia BP–RP and BP–G colours derived from corrected Gaia BP/RP spectra. The precision of the [Fe/H] estimates in this case varies from 0.05 to 0.25 dex. The search resulted in 2 758 matches.
Das et al. (2025), who derived stellar parameters and abundances for nearly one million objects from their Gaia Radial Velocity Spectrometer (RVS) spectra. They used The Cannon (Ness et al. 2015) to transfer stellar parameters and abundances from the GALactic Archaeology with HERMES (GALAH; Martell et al. 2017) data release 4 catalogue to the Gaia spectra. The achieved [Fe/H] precision is, in this case, 0.02–0.1 dex. The search resulted in 104 matches.
Fallows & Sanders (2024), who provide abundances for 28 million stars applying an Uncertain Neural Network model trained on APOGEE data to Gaia BP/RP spectra and selected broadband photometric colours from Gaia, 2MASS, and WISE. The [Fe/H] precision is ≃0.07 dex. The search resulted in 725 matches.
Hattori (2025), who estimated stellar metallicities for around 48 million dwarfs and giants situated in low dust-extinction regions by applying tree-based machine-learning techniques to Gaia BP/RP spectra, with training based on APOGEE data release 17 observations. The claimed [Fe/H] precision is ≃0.09 dex. The search resulted in 1769 matches.
Huang et al. (2022), who derived stellar parameters and metallicities for around 24 million stars based on SkyMapper Southern Survey Data Release 2 (SMSS DR2; Onken et al. 2019) and Gaia early data release 3 photometric colours, using training datasets composed of stars with spectroscopic parameters from earlier surveys at different spectral resolutions. The precision of the [Fe/H] values is 0.05–0.15 dex. The search resulted in 284 matches.
As a result of this exercise we ended up with a sample of 2603 WD+MS binaries with at least two [Fe/H] abundances as reported from the above studies. According to the random forest classification of García-Zamora et al. (2025), 2070 of the white dwarfs are hydrogen-rich DAs (≃80 per cent), 187 are helium-rich DBs (≃7 per cent), 309 are DCs (no spectral features in their spectra; ≃12 per cent), and the remaining 37 (≃1 per cent) belong to other exotic and less common types. Thus, we restricted our sample to the analysis of DA systems and excluded the non-DAs, which are more prone to being misclassified by the random forest algorithm, as described by García-Zamora et al. (2025). However, it should be noted, as we show in Section 5, that not all 2070 WD+MS binaries are suitable for acquiring a reliable AMR.
4 White dwarf ages
We used the same approach as Rebassa-Mansergas et al. (2021b, 2023) to derive the ages of the white dwarfs. We refer to these works for a full description of the methodology and provide here a brief summary.
The total age of a given system is calculated by summing the white dwarf cooling age with the main-sequence progenitor lifetime. Both parameters are derived by interpolating the white dwarf Gaia DR 3 absolute G-band magnitudes and the BP-RP colours in the cooling sequences developed by the La Plata group for different metallicities (Althaus et al. 2015; Renedo et al. 2010; Camisassa et al. 2016, 2019). The evolutionary sequences cover the full life cycle of the progenitor stars, from the zero age main sequence to the white dwarf stage. They therefore self-consistently incorporate an initial–final mass relation (Miller Bertolami 2016) in agreement with semi-empirical determinations (e.g. Catalán et al. 2008; Cummings et al. 2018). The sequences account for all major energy sources affecting white dwarf cooling, including the release of latent heat during crystallisation and the gravitational energy associated with phase separation. It is worth noting that the photometric data were corrected for interstellar extinction using the updated 3D map of Lallement et al. (2014) before being used to interpolate in the theoretical sequences. We also adopted a standard RV = 3.1, monochromatic extinction law (Fitzpatrick et al. 2019) to scale the 3D extinction into the three Gaia bands.
5 The age–metallicity relation
In this section we describe how we determined the age–[Fe/H] relation for our sample using three different methods. Applying multiple approaches provided a useful consistency check and allowed us to evaluate how sensitive the inferred relation is to the adopted methodology. We describe each method and compare the resulting relations.
5.1 The combined literature sample
A first estimate of the AMR was obtained using the full literature compilation of metallicity measurements (Section 3). In other words, for the 2070 systems containing DA white dwarfs with multiple [Fe/H] determinations available in the literature, we adopt the weighted mean value, allowing us to maximise the number of objects while mitigating the impact of individual measurement uncertainties.
The weighted average of the measurements is
![Mathematical equation: $\[\langle[\mathrm{Fe} / \mathrm{H}]\rangle=\frac{\sum_{i=1}^n w_i[\mathrm{Fe} / \mathrm{H}]_i}{\sum_{i=1}^n w_i},\]$](/articles/aa/full_html/2026/05/aa60074-26/aa60074-26-eq1.png) (1)
(1)
where n is the number of measurements, ![Mathematical equation: $\[w_{i}=1 / \sigma_{i}^{2}\]$](/articles/aa/full_html/2026/05/aa60074-26/aa60074-26-eq2.png) is the weight for each measure (i.e. the inverse variance), and σi is the precision associated with each value. Although each catalogue described in Section 3 provides a typical [Fe/H] precision, we instead adopt a representative precision derived from our sample. Specifically, for each catalogue we compute the mean of the quoted uncertainties for the stars from that catalogue that are included in our sample, and use this value as the precision.
is the weight for each measure (i.e. the inverse variance), and σi is the precision associated with each value. Although each catalogue described in Section 3 provides a typical [Fe/H] precision, we instead adopt a representative precision derived from our sample. Specifically, for each catalogue we compute the mean of the quoted uncertainties for the stars from that catalogue that are included in our sample, and use this value as the precision.
We then define the uncertainty of ⟨[Fe/H]⟩ as the quadratic sum of the internal and external errors: ![Mathematical equation: $\[\sigma_{\langle[\mathrm{Fe} / \mathrm{H}]\rangle}=\sqrt{\sigma_{\text {int}}^{2}+\sigma_{\text {ext}}^{2}}\]$](/articles/aa/full_html/2026/05/aa60074-26/aa60074-26-eq3.png)
The external error represents the dispersion among the different measurements, reflecting how much the measured values vary with respect to the weighted mean. It is defined as
![Mathematical equation: $\[\sigma_{\mathrm{ext}}=\sqrt{\frac{\sum_{i=1}^n w_i\left([\mathrm{Fe} / \mathrm{H}]_i-\langle[\mathrm{Fe} / \mathrm{H}]\rangle\right)^2}{(n-1) \sum_{i=1}^n w_i}} .\]$](/articles/aa/full_html/2026/05/aa60074-26/aa60074-26-eq4.png) (2)
(2)
The internal error represents the theoretical precision of the weighted mean. It is calculated from the uncertainties of the individual measurements:
![Mathematical equation: $\[\sigma_{\mathrm{int}}=\sqrt{\frac{1}{\sum_{i=1}^n w_i}} .\]$](/articles/aa/full_html/2026/05/aa60074-26/aa60074-26-eq5.png) (3)
(3)
Given that in most cases the number of available measurements n is small (2–3), σ⟨[Fe/H]⟩ ≃ σint.
From the original sample of 2070 WD+MS, we only considered those with σ⟨[Fe/H]⟩ < 0.2 dex, which reduced the number of objects to 636. This threshold represents a compromise between excluding measurements with large uncertainties and maintaining a statistically meaningful sample size. The drastic reduction of objects (2070 to 636) reflects the different methodologies for measuring the [Fe/H] abundances of the considered studies, which yield incompatible values in many cases. Moreover, it is important to note that for 350 white dwarfs the derived masses are below 0.53 M⊙. This is the lowest white dwarf mass limit allowed in the evolutionary sequences described in Section 4. The progenitors of lower-mass white dwarfs do not have time to evolve out of the main sequence within the age of the Universe. Hence, these 350 were excluded from our sample since we do not have a determination of their ages. The origin of such low-mass white dwarfs in wide binaries will be analysed in a forthcoming publication.
The resulting AMR for our remaining 286 WD+MS is illustrated in the top left panel of Figure 1. The black dots represent the entire sample; the red dots are a restricted selection for which the age errors are either below 1.5 Gyr or have relative errors of less than 30 per cent. We observe a large dispersion of [Fe/H] abundances around the solar value at all ages. The average metallicities per age bin are consistent with ⟨[Fe/H]⟩ ≃ 0 dex, as can be seen in the bottom left panel of Figure 1.
It is worth noting that most WD+MS binaries, especially those with more reliable ages, are concentrated towards younger age bins (<5 Gyr). This is because our sample is magnitude-limited, thus favouring the identification of brighter, intrinsically hotter, white dwarfs with shorter cooling ages. Generally, only those white dwarfs with masses under ≃0.6 M⊙ have associated ages above 5 Gyr, due to their long main-sequence progenitor lifetimes. However, because the main-sequence lifetime is highly sensitive to the progenitor mass, even small errors in the masses of low-mass white dwarfs lead to significantly different main-sequence lifetimes via the initial-to-final mass relation, and therefore to substantially larger uncertainties in the total ages.
Given that the [Fe/H] abundances used in this work were obtained from studies that make use of different methodologies and datasets, we explored an alternative approach to estimating the AMR via favouring measurements obtained from better-quality data. Thus, we repeated the above exercise incorporating a confidence parameter qi to the corresponding weights as follows:
![Mathematical equation: $\[w_i=\frac{q_i}{\sigma_i^2} .\]$](/articles/aa/full_html/2026/05/aa60074-26/aa60074-26-eq6.png) (4)
(4)
We adopted q = 1 for the [Fe/H] measurements of Das et al. (2025) since they are derived from RVS Gaia spectra of resolving power ≃11 500. For the [Fe/H] determinations of Ye et al. (2025), Hattori (2025), and Fallows & Sanders (2024), based on the analysis of low-resolution Gaia BP/RP spectra, we used q = 0.7. Finally, we fixed q = 0.4 for the abundances from Huang et al. (2022) and Huang et al. (2025), which are based on photometric colours. In this case, the internal error’s definition was modified to
![Mathematical equation: $\[\sigma_{\mathrm{int}}=\sqrt{\frac{\sum_{i=1}^n w_i^2 \sigma_i^2}{\sum_{i=1}^n w_i}}.\]$](/articles/aa/full_html/2026/05/aa60074-26/aa60074-26-eq7.png) (5)
(5)
The resulting AMR and the average metallicities per age bin are illustrated in the top and bottom right panels of Figure 1, respectively. It is clear that there are no major differences between the results obtained from the two approaches. For completeness, we tried varying the associated q values and found similar results in all cases.
A comparison between the AMRs obtained in this section and those provided by Rebassa-Mansergas et al. (2016, 2021a), which also arise from the analysis of WD+MS binaries, reveals very similar features, namely a large scatter of [Fe/H] abundances at any given age.
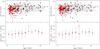 |
Fig. 1 Left panels: AMR (top) and average metallicity per age bin (bottom) arising from the full sample of WD+MS with at least two available [Fe/H] measurements. The red dots indicate ages with relative errors below 30 per cent or absolute errors lower than 1.5 Gyr. Right panels: same, but applying a higher weight to [Fe/H] values derived from better-quality data (see Section 5.1 for details). |
5.2 The consistency-filtered sample
To assess the impact of potential systematic differences between literature measurements, we constructed a more conservative sub-sample by retaining only objects whose [Fe/H] determinations from different studies agree within a specified threshold. This procedure was applied iteratively when additional datasets were included, progressively reducing the sample to objects with mutually consistent metallicity measurements.
We began by considering the measurements derived from Gaia photometric colours of Huang et al. (2022) and Huang et al. (2025), hereafter [Fe/H]1 and [Fe/H]2, respectively. We obtained the average metallicities and associated uncertainties in the same way as described in Section 5.1, without considering the confidence parameter qi. However, we took into account only objects satisfying the threshold criterion
![Mathematical equation: $\[\tau=\frac{\left|[\mathrm{Fe} / \mathrm{H}]_1-\left[\mathrm{Fe} / \mathrm{H}_2\right]\right|}{\sqrt{\sigma_{[\mathrm{Fe} / \mathrm{H}]_1}^2+\sigma_{[\mathrm{Fe} / \mathrm{H}]_2}^2}}<1.5,\]$](/articles/aa/full_html/2026/05/aa60074-26/aa60074-26-eq8.png) (6)
(6)
where σ[Fe/H]1 and σ[Fe/H]2 are the individual measurement errors. The selection criterion τ < 1.5 is somewhat arbitrary and represents a compromise between a more restrictive threshold (e.g. τ < 1), which would exclude a substantial fraction of systems, and a more permissive one (e.g. τ < 3), which would admit systems with less robust measurements. For completeness, we explored these alternative thresholds and found that they do not significantly affect the results, except the expected variation in the number of selected systems. Thus, the τ < 1.5 restriction was fulfilled by 84 of the 116 WD+MS binaries with common metallicities and available ages from both works; the resulting AMR and average [Fe/H] per age bin are illustrated in the left panels of Figure 2.
We further restricted the sample by forcing the average [Fe/H] values obtained above to surpass the same criterion as defined in Equation (6), but with the measurements from Das et al. (2025). We recall that these [Fe/H] abundances were obtained from Gaia RVS spectra and are hence the most reliable measurements. Only 15 WD+MS were left after this process; the AMR arising from them is shown in the right panels of Figure 2.
We continued this analysis considering the [Fe/H] abundances obtained from the Gaia BP/RP spectra provided by Ye et al. (2025), Hattori (2025), and Fallows & Sanders (2024). Of the 115 WD+MS with common metallicities among the three studies and available ages, 90 have values that satisfy the τ < 1.5 criterion between Ye et al. (2025) and Hattori (2025), and 89 between the three considered works. The resulting AMR can be seen in the left panels of Figure 3. We further applied the criterion of Equation (6) to the 89 mean [Fe/H] values, this time adopting the measurements from Das et al. (2025), thereby restricting the sample. The AMR resulting from only the ten WD+MS fulfilling this selection is shown in the right panels of Figure 3.
For completeness, we also evaluated how many WD+MS fulfil the τ < 1.5 criterion when considering all six studies (Ye et al. 2025; Huang et al. 2022, 2025; Das et al. 2025; Fallows & Sanders 2024; Hattori 2025). Only five objects satisfied the selection, and consequently we do not show the AMR.
The results obtained in this section reveal that using a more conservative sub-sample yields results that are very similar to those obtained from the full literature compilation (Section 5.1). For completeness, we show in the Appendix the comparisons between the [Fe/H] measurements of the considered studies throughout this section.
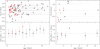 |
Fig. 2 Left panels: same as in Figure 1, but for WD+MS with [Fe/H] abundances from Huang et al. (2022) and Huang et al. (2025) satisfying our τ < 1.5 threshold criterion. Right panels: restricted sample of WD+MS with [Fe/H] values from Huang et al. (2022), Huang et al. (2025), and Das et al. (2025) also fulfilling the τ < 1.5 criterion (see Section 5.2 for details). |
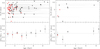 |
Fig. 3 Left panels: same as in Figure 1, but for WD+MS with [Fe/H] abundances from Ye et al. (2025), Hattori (2025), and Fallows & Sanders (2024) satisfying our τ < 1.5 threshold criterion. Right panels: restricted sample of WD+MS with [Fe/H] values from Ye et al. (2025), Hattori (2025), Fallows & Sanders (2024), and Das et al. (2025) also fulfilling the τ < 1.5 criterion (see Section 5.2 for details). |
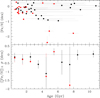 |
Fig. 4 Same as Figure 1, but for WD+MS with [Fe/H] abundances from our reference sample (Das et al. 2025). |
5.3 The adopted reference sample
Finally, we derived the AMR using [Fe/H] measurements adopted exclusively from the most reliable literature source in our compilation (Das et al. 2025). This approach provides an independent estimate of the relation that avoids combining measurements from heterogeneous analyses.
A total of 47 WD+MS binaries in our sample have [Fe/H] values from Das et al. (2025) and available ages. The AMR can be seen in Figure 4, and displays the typical scatter of ages found in the previous sections. Interesting is the apparent overabundance of metal-poor objects with ages between 3.5 and 7 Gyr, two of which are associated with large uncertainties in their metallicities and are likely to be unreliable. This feature is likely due to the low number of objects considered.
6 Summary and conclusions
In this work we have presented the age–metallicity relation, AMR, in the solar neighbourhood as revealed from different sub-samples of wide white dwarf plus main-sequence binaries (WD+MS binaries). The metallicity was traced by the [Fe/H] abundances of the main-sequence companions, publicly available from the literature (Ye et al. 2025; Huang et al. 2022, 2025; Das et al. 2025; Hattori 2025; Fallows & Sanders 2024), whilst the ages were derived from the Gaia photometry and astrometry of the white dwarfs.
Independently of the sample used, we find a large scatter of [Fe/H] at any age, in agreement with our previous work dedicated to constrain the relation between age and metallicity using WD+MS binaries (Rebassa-Mansergas et al. 2016, 2021a). This is also in line with studies that make use of single stars (Holmberg et al. 2009; Casagrande et al. 2011; Haywood et al. 2013; Patil et al. 2023; Casamiquela et al. 2024).
It is important to note that, despite the important contribution of WD+MS binaries to this topic, some factors limit the robustness of the results obtained to date. First, as noted above, lower-mass white dwarfs originate from progenitors with longer main-sequence lifetimes. Because the lifetime inferred from the initial-to-final mass relation (IFMR) is highly sensitive to progenitor mass, even small uncertainties in the masses of low-mass white dwarfs translate into large variations in the estimated main-sequence lifetimes, and consequently in the total ages. As a result, a significant fraction of our age determinations carry substantial uncertainties, especially at old ages.
Second, the [Fe/H] abundances analysed here are derived using heterogeneous methodologies and are available for a relatively limited sample. This limitation will be alleviated by the 4-metre Multi-Object Spectroscopic Telescope (4MOST) survey (de Jong et al. 2022), which is beginning operations in mid 2026 and will target, through its White Dwarf Binary Survey, ≃2500 main-sequence companions to white dwarfs in common propermotion pairs, as well as several thousand WD+MS systems in close orbits (Toloza et al. 2023). The substantially larger sample size, together with the homogeneous nature of the observations and analysis, will enable a more robust and detailed investigation of the AMR.
Finally, there is still no consensus on the observational properties of the IFMR (Cummings et al. 2018; Marigo et al. 2020; Cunningham et al. 2024; Ironi et al. 2025). The inferred main-sequence lifetimes of progenitors depend sensitively on the adopted IFMR, which can vary significantly (Rebassa-Mansergas et al. 2016). Wide binaries with independently determined ages for the non-degenerate companions can help constrain the IFMR (Catalán et al. 2008; Barrientos & Chanamé 2021); however, robust constraints require large samples of WD+MS binaries hosting relatively massive white dwarfs (≃0.7 M⊙). Such objects have short progenitor lifetimes (Camisassa et al. 2016, 2019), allowing the total system age to be well approximated by the white dwarf cooling age, which is more reliable and largely independent of metallicity. However, massive white dwarfs are both intrinsically rare and faint, owing to their small radii and rapid cooling. As a result, they represent only a small fraction of white dwarfs and WD+MS binaries in volume-limited samples (McCleery et al. 2020; Jiménez-Esteban et al. 2023; Kilic et al. 2025), and are also more difficult to detect in magnitude-limited surveys (Rebassa-Mansergas et al. 2015; Torres et al. 2023). Even within 4MOST, only a small fraction (≃10 per cent) of WD+MS binaries are expected to host massive white dwarfs. In this context, the Legacy Survey of Space and Time (LSST) at the Vera C. Rubin Observatory (Ivezić et al. 2019) will play a key role by enabling the identification of this elusive population (Rebassa-Mansergas et al. 2025).
Acknowledgements
We thank the referee for the comments. This work was supported by the Spanish MINECO grant PID2023-148661NB-I00 and by the AGAUR/Generalitat de Catalunya grant SGR-386/2021. R.R. acknowledges support from Grant RYC2021-030837-I, funded by MCIN/AEI/10.13039/501100011033 and by “European Union NextGeneration EU/PRTR”. This work presents results from the European Space Agency (ESA) space mission Gaia. Gaia data are being processed by the Gaia Data Processing and Analysis Consortium (DPAC). Funding for the DPAC is provided by national institutions, in particular the institutions participating in the Gaia MultiLateral Agreement (MLA). The Gaia mission website is https://www.cosmos.esa.int/gaia. The Gaia archive website is https://archives.esac.esa.int/gaia.
References
- Althaus, L. G., Camisassa, M. E., Miller Bertolami, M. M., Córsico, A. H., & García-Berro, E. 2015, A&A, 576, A9 [NASA ADS] [CrossRef] [EDP Sciences] [Google Scholar]
- Anders, F., Gispert, P., Ratcliffe, B., et al. 2023, A&A, 678, A158 [NASA ADS] [CrossRef] [EDP Sciences] [Google Scholar]
- Barrientos, M., & Chanamé, J. 2021, ApJ, 923, 181 [NASA ADS] [CrossRef] [Google Scholar]
- Camisassa, M. E., Althaus, L. G., Córsico, A. H., et al. 2016, ApJ, 823, 158 [CrossRef] [Google Scholar]
- Camisassa, M. E., Althaus, L. G., Córsico, A. H., et al. 2019, A&A, 625, A87 [NASA ADS] [CrossRef] [EDP Sciences] [Google Scholar]
- Casagrande, L., Schönrich, R., Asplund, M., et al. 2011, A&A, 530, A138 [NASA ADS] [CrossRef] [EDP Sciences] [Google Scholar]
- Casamiquela, L., Reese, D. R., Lebreton, Y., et al. 2024, A&A, 692, A243 [NASA ADS] [CrossRef] [EDP Sciences] [Google Scholar]
- Catalán, S., Isern, J., García-Berro, E., & Ribas, I. 2008, MNRAS, 387, 1693 [Google Scholar]
- Cui, X.-Q., Zhao, Y.-H., Chu, Y.-Q., et al. 2012, Res. Astron. Astrophys., 12, 1197 [Google Scholar]
- Cummings, J. D., Kalirai, J. S., Tremblay, P. E., Ramirez-Ruiz, E., & Choi, J. 2018, ApJ, 866, 21 [NASA ADS] [CrossRef] [Google Scholar]
- Cunningham, T., Tremblay, P.-E., & W. O’Brien, M. 2024, MNRAS, 527, 3602 [Google Scholar]
- Curtis, J. L., Agüeros, M. A., Matt, S. P., et al. 2020, ApJ, 904, 140 [Google Scholar]
- Das, P. B., Zucker, D. B., De Silva, G. M., et al. 2025, MNRAS, 538, 605 [Google Scholar]
- de Jong, R. S., Bellido-Tirado, O., Brynnel, J. G., et al. 2022, SPIE Conf. Ser., 12184, 1218414 [NASA ADS] [Google Scholar]
- Edvardsson, B., Andersen, J., Gustafsson, B., et al. 1993, A&A, 275, 101 [NASA ADS] [Google Scholar]
- Fallows, C. P., & Sanders, J. L. 2024, MNRAS, 531, 2126 [CrossRef] [Google Scholar]
- Feuillet, D. K., Frankel, N., Lind, K., et al. 2019, MNRAS, 489, 1742 [Google Scholar]
- Fitzpatrick, E. L., Massa, D., Gordon, K. D., Bohlin, R., & Clayton, G. C. 2019, ApJ, 886, 108 [Google Scholar]
- Fontaine, G., Brassard, P., & Bergeron, P. 2001, PASP, 113, 409 [NASA ADS] [CrossRef] [Google Scholar]
- Fouesneau, M., Rix, H.-W., von Hippel, T., Hogg, D. W., & Tian, H. 2019, ApJ, 870, 9 [Google Scholar]
- Frankel, N., Rix, H.-W., Ting, Y.-S., Ness, M., & Hogg, D. W. 2018, ApJ, 865, 96 [NASA ADS] [CrossRef] [Google Scholar]
- Gaia Collaboration (Brown, A. G. A., et al.) 2018, A&A, 616, A1 [NASA ADS] [CrossRef] [EDP Sciences] [Google Scholar]
- Gaia Collaboration (Vallenari, A., et al.) 2023, A&A, 674, A1 [NASA ADS] [CrossRef] [EDP Sciences] [Google Scholar]
- Garcia-Berro, E., Hernanz, M., Isern, J., & Mochkovitch, R. 1988, Nature, 333, 642 [Google Scholar]
- García-Zamora, E. M., Torres, S., & Rebassa-Mansergas, A. 2023, A&A, 679, A127 [NASA ADS] [CrossRef] [EDP Sciences] [Google Scholar]
- García-Zamora, E. M., Torres, S., Rebassa-Mansergas, A., & Ferrer-Burjachs, A. 2025, A&A, 699, A3 [NASA ADS] [CrossRef] [EDP Sciences] [Google Scholar]
- Gentile Fusillo, N. P., Tremblay, P.-E., Gänsicke, B. T., et al. 2019, MNRAS, 482, 4570 [Google Scholar]
- Gentile Fusillo, N. P., Tremblay, P.-E., Cukanovaite, E., et al. 2021, MNRAS, 508, 3877 [NASA ADS] [CrossRef] [Google Scholar]
- Hattori, K. 2025, ApJ, 980, 90 [Google Scholar]
- Haywood, M. 2008, MNRAS, 388, 1175 [NASA ADS] [CrossRef] [Google Scholar]
- Haywood, M., Di Matteo, P., Lehnert, M. D., Katz, D., & Gómez, A. 2013, A&A, 560, A109 [NASA ADS] [CrossRef] [EDP Sciences] [Google Scholar]
- Heintz, T. M., Hermes, J. J., El-Badry, K., et al. 2022, ApJ, 934, 148 [NASA ADS] [CrossRef] [Google Scholar]
- Holmberg, J., Nordström, B., & Andersen, J. 2009, A&A, 501, 941 [NASA ADS] [CrossRef] [EDP Sciences] [Google Scholar]
- Huang, Y., Beers, T. C., Wolf, C., et al. 2022, ApJ, 925, 164 [NASA ADS] [CrossRef] [Google Scholar]
- Huang, B., Yuan, H., Xu, S., et al. 2025, ApJS, 277, 7 [Google Scholar]
- Ironi, O., Ben-Ami, S., Hallakoun, N., & Shahaf, S. 2025, ApJ, 982, 20 [Google Scholar]
- Ivezić, Ž., Kahn, S. M., Tyson, J. A., et al. 2019, ApJ, 873, 111 [Google Scholar]
- Jiménez-Esteban, F. M., Torres, S., Rebassa-Mansergas, A., et al. 2023, MNRAS, 518, 5106 [Google Scholar]
- Jørgensen, B. R., & Lindegren, L. 2005, A&A, 436, 127 [Google Scholar]
- Kilic, M., Bergeron, P., Blouin, S., et al. 2025, ApJ, 979, 157 [Google Scholar]
- Lallement, R., Vergely, J. L., Valette, B., et al. 2014, A&A, 561, A91 [NASA ADS] [CrossRef] [EDP Sciences] [Google Scholar]
- Majewski, S. R., Schiavon, R. P., Frinchaboy, P. M., et al. 2017, AJ, 154, 94 [NASA ADS] [CrossRef] [Google Scholar]
- Marigo, P., Cummings, J. D., Curtis, J. L., et al. 2020, Nat. Astron., 4, 1102 [NASA ADS] [CrossRef] [Google Scholar]
- Martell, S. L., Sharma, S., Buder, S., et al. 2017, MNRAS, 465, 3203 [CrossRef] [Google Scholar]
- McCleery, J., Tremblay, P.-E., Gentile Fusillo, N. P., et al. 2020, MNRAS, 499, 1890 [Google Scholar]
- Miller Bertolami, M. M. 2016, A&A, 588, A25 [NASA ADS] [CrossRef] [EDP Sciences] [Google Scholar]
- Minchev, I., Chiappini, C., & Martig, M. 2013, A&A, 558, A9 [CrossRef] [EDP Sciences] [Google Scholar]
- Moss, A., von Hippel, T., Robinson, E., et al. 2022, ApJ, 929, 26 [Google Scholar]
- Ness, M., Hogg, D. W., Rix, H.-W., Ho, A. Y. Q., & Zasowski, G. 2015, ApJ, 808, 16 [NASA ADS] [CrossRef] [Google Scholar]
- Nordström, B., Mayor, M., Andersen, J., et al. 2004, A&A, 418, 989 [Google Scholar]
- Onken, C. A., Wolf, C., Bessell, M. S., et al. 2019, PASA, 36, e033 [Google Scholar]
- Patil, A. A., Bovy, J., Jaimungal, S., Frankel, N., & Leung, H. W. 2023, MNRAS, 526, 1997 [NASA ADS] [CrossRef] [Google Scholar]
- Queiroz, A. B. A., Anders, F., Chiappini, C., et al. 2020, A&A, 638, A76 [NASA ADS] [CrossRef] [EDP Sciences] [Google Scholar]
- Rebassa-Mansergas, A., Rybicka, M., Liu, X. W., Han, Z., & García-Berro, E. 2015, MNRAS, 452, 1637 [Google Scholar]
- Rebassa-Mansergas, A., Anguiano, B., García-Berro, E., et al. 2016, MNRAS, 463, 1137 [NASA ADS] [CrossRef] [Google Scholar]
- Rebassa-Mansergas, A., Maldonado, J., Raddi, R., et al. 2021a, MNRAS, 505, 3165 [Google Scholar]
- Rebassa-Mansergas, A., Solano, E., Jiménez-Esteban, F. M., et al. 2021b, MNRAS, 506, 5201 [Google Scholar]
- Rebassa-Mansergas, A., Maldonado, J., Raddi, R., et al. 2023, MNRAS, 526, 4787 [NASA ADS] [CrossRef] [Google Scholar]
- Rebassa-Mansergas, A., Raddi, R., Pala, A. F., et al. 2025, arXiv e-prints [arXiv:2512.14769] [Google Scholar]
- Renedo, I., Althaus, L. G., Miller Bertolami, M. M., et al. 2010, ApJ, 717, 183 [Google Scholar]
- Rocha-Pinto, H. J., Maciel, W. J., Scalo, J., & Flynn, C. 2000, A&A, 358, 850 [NASA ADS] [Google Scholar]
- Sahlholdt, C. L., Feltzing, S., & Feuillet, D. K. 2022, MNRAS, 510, 4669 [NASA ADS] [CrossRef] [Google Scholar]
- Schönrich, R., & Binney, J. 2009, MNRAS, 399, 1145 [Google Scholar]
- Soderblom, D. R. 2010, ARA&A, 48, 581 [Google Scholar]
- Tayar, J., & Joyce, M. 2025, ApJ, 984, L56 [Google Scholar]
- Ting, Y.-S., & Rix, H.-W. 2019, ApJ, 878, 21 [NASA ADS] [CrossRef] [Google Scholar]
- Toloza, O., Rebassa-Mansergas, A., Raddi, R., et al. 2023, The Messenger, 190, 4 [NASA ADS] [Google Scholar]
- Torres, S., Cruz, P., Murillo-Ojeda, R., et al. 2023, A&A, 677, A159 [NASA ADS] [CrossRef] [EDP Sciences] [Google Scholar]
- Twarog, B. A. 1980, ApJ, 242, 242 [NASA ADS] [CrossRef] [Google Scholar]
- Xiang, M., & Rix, H.-W. 2022, Nature, 603, 599 [NASA ADS] [CrossRef] [Google Scholar]
- Ye, X., Wu, W., Allende Prieto, C., et al. 2025, A&A, 695, A75 [NASA ADS] [CrossRef] [EDP Sciences] [Google Scholar]
- Zhao, J. K., Oswalt, T. D., Rudkin, M., Zhao, G., & Chen, Y. Q. 2011, AJ, 141, 107 [Google Scholar]
Appendix A [Fe/H] abundance comparison
We provide in this Appendix figures displaying the comparison between the [Fe/H] values measured from the different studies considered in this work, as detailed in Section 5.2. Figure A.1 compares the values obtained by Huang et al. (2022), Huang et al. (2025) and Das et al. (2025). Figure A.2 compares the values obtained by Ye et al. (2025), Fallows & Sanders (2024), Hattori (2025) and Das et al. (2025).
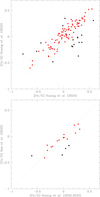 |
Fig. A.1 Top panel: Comparison between the [Fe/H] measurements of Huang et al. (2022) and Huang et al. (2025). The red dots fulfil the τ < 1.5 condition. Bottom panel: Comparison between average [Fe/H] values from Huang et al. (2022) and Huang et al. (2025) fulfilling the τ < 1.5 condition vs the determinations of Das et al. (2025). The red solid dots again represent cases satisfying τ < 1.5. |
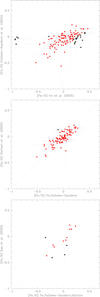 |
Fig. A.2 Same as Figure A.1, but comparing the [Fe/H] values from Ye et al. (2025) and Fallows & Sanders (2024) (top), Hattori (2025) (middle), and Das et al. (2025) (bottom). |
All Figures
|
Fig. 1 Left panels: AMR (top) and average metallicity per age bin (bottom) arising from the full sample of WD+MS with at least two available [Fe/H] measurements. The red dots indicate ages with relative errors below 30 per cent or absolute errors lower than 1.5 Gyr. Right panels: same, but applying a higher weight to [Fe/H] values derived from better-quality data (see Section 5.1 for details). |
| In the text | |
|
Fig. 2 Left panels: same as in Figure 1, but for WD+MS with [Fe/H] abundances from Huang et al. (2022) and Huang et al. (2025) satisfying our τ < 1.5 threshold criterion. Right panels: restricted sample of WD+MS with [Fe/H] values from Huang et al. (2022), Huang et al. (2025), and Das et al. (2025) also fulfilling the τ < 1.5 criterion (see Section 5.2 for details). |
| In the text | |
|
Fig. 3 Left panels: same as in Figure 1, but for WD+MS with [Fe/H] abundances from Ye et al. (2025), Hattori (2025), and Fallows & Sanders (2024) satisfying our τ < 1.5 threshold criterion. Right panels: restricted sample of WD+MS with [Fe/H] values from Ye et al. (2025), Hattori (2025), Fallows & Sanders (2024), and Das et al. (2025) also fulfilling the τ < 1.5 criterion (see Section 5.2 for details). |
| In the text | |
|
Fig. 4 Same as Figure 1, but for WD+MS with [Fe/H] abundances from our reference sample (Das et al. 2025). |
| In the text | |
|
Fig. A.1 Top panel: Comparison between the [Fe/H] measurements of Huang et al. (2022) and Huang et al. (2025). The red dots fulfil the τ < 1.5 condition. Bottom panel: Comparison between average [Fe/H] values from Huang et al. (2022) and Huang et al. (2025) fulfilling the τ < 1.5 condition vs the determinations of Das et al. (2025). The red solid dots again represent cases satisfying τ < 1.5. |
| In the text | |
|
Fig. A.2 Same as Figure A.1, but comparing the [Fe/H] values from Ye et al. (2025) and Fallows & Sanders (2024) (top), Hattori (2025) (middle), and Das et al. (2025) (bottom). |
| In the text | |
Current usage metrics show cumulative count of Article Views (full-text article views including HTML views, PDF and ePub downloads, according to the available data) and Abstracts Views on Vision4Press platform.
Data correspond to usage on the plateform after 2015. The current usage metrics is available 48-96 hours after online publication and is updated daily on week days.
Initial download of the metrics may take a while.