Fig. 11.
Download original image
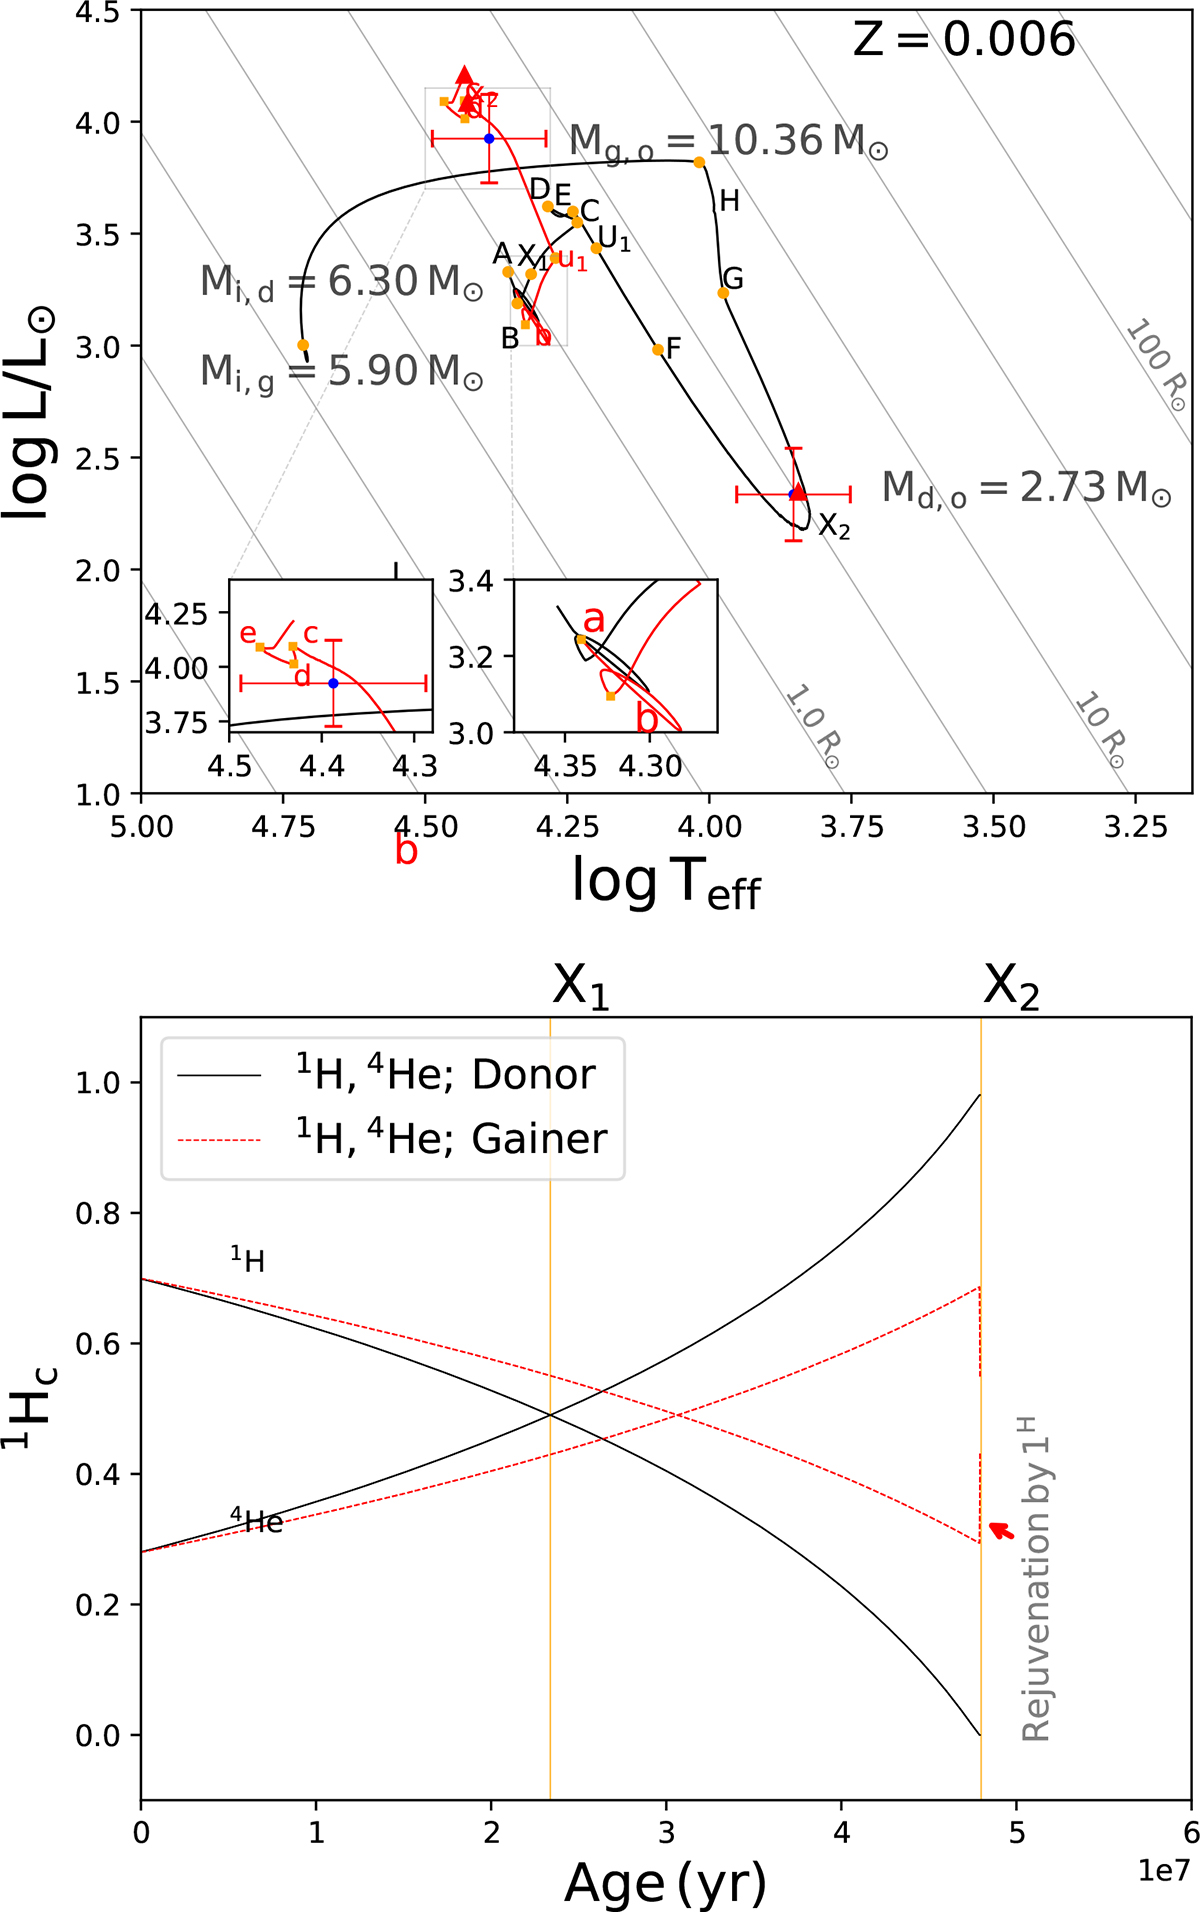
Top: evolutionary tracks for the best quasi-conservative model. Blue dots with error bars are the observed values and the triangles are the model’s values. The labels correspond to the evolutionary stages given in Table 5. Bottom: central abundance of hydrogen and helium for the gainer and donor. X1 corresponds to the inversion of the 1H/4He ratio and X2 to the current stage.
Current usage metrics show cumulative count of Article Views (full-text article views including HTML views, PDF and ePub downloads, according to the available data) and Abstracts Views on Vision4Press platform.
Data correspond to usage on the plateform after 2015. The current usage metrics is available 48-96 hours after online publication and is updated daily on week days.
Initial download of the metrics may take a while.