| Issue |
A&A
Volume 709, May 2026
|
|
|---|---|---|
| Article Number | A271 | |
| Number of page(s) | 15 | |
| Section | Interstellar and circumstellar matter | |
| DOI | https://doi.org/10.1051/0004-6361/202659012 | |
| Published online | 22 May 2026 | |
Chemistry and ro-vibrational excitation of CH+ in the planetary nebula NGC 7027
1
Univ. Grenoble Alpes, CNRS, IPAG,
38000
Grenoble,
France
2
Univ Rennes, CNRS, IPR (Institut de Physique de Rennes) – UMR 6251,
35000
Rennes,
France
3
Institute of Astronomy, Department of Physics, National Tsing Hua University,
Hsinchu,
Taiwan
4
Max-Planck-Institut für Radioastronomie,
Auf dem Hügel 69,
53121
Bonn,
Germany
5
Instituto de Física Fundamental, IFF-CSIC,
Serrano 123,
28006
Madrid,
Spain
6
Columbia Astrophysics Laboratory, Columbia University, New York,
New York
10027,
USA
7
KU Leuven, Department of Chemistry,
3001
Leuven,
Belgium
★ Corresponding authors: This email address is being protected from spambots. You need JavaScript enabled to view it.
; This email address is being protected from spambots. You need JavaScript enabled to view it.
; This email address is being protected from spambots. You need JavaScript enabled to view it.
Received:
17
January
2026
Accepted:
6
April
2026
Abstract
Context. Small carbon hydride cations, such as methylidynium (CH+), are important in the chemistry of the interstellar medium. They participate in a network of gas-phase reactions with a range of molecular and atomic species and lead to the formation of diverse hydrocarbon products that, in turn, act as precursors to more complex carbon-chain and organic molecules.
Aims. CH+ is known to be a reactive ion that is quickly destroyed by H, H2, and free electrons, which makes its excitation challenging to model because chemical formation and destruction rates should be considered along with the usual radiative and inelastic rates when solving the statistical equilibrium equations. This so-called chemical pumping or excitation effect, already evidenced in the literature, is examined here with the first set of ab initio state-resolved ro-vibrational (reactive and inelastic) collision data to model the observed CH+ line intensities and better constrain the physico-chemical conditions of the environment.
Methods. Multiple rotational and ro-vibrational transitions of CH+ detected toward the planetary nebula NGC 7027 are analyzed in this work. The chemical structure of CH+ in NGC 7027 was modeled with the photoionization code CLOUDY using updated formation and destruction reaction rate coefficients for CH+. The electron temperature and atomic and molecular gas densities were modeled as a function of position within the nebula. The nonlocal thermodynamic equilibrium analysis of the observed CH+ emission lines was then performed with the 1D code CLOUDY and single-zone code RADEX using an accurate and comprehensive set of spectroscopic and inelastic collisional data. In a second approach, chemical formation and destruction rate coefficients of CH+ were implemented in RADEX. This code was combined with a Markov chain Monte Carlo sampling (performed in the RADEX-parameter space) in order to extract the best-fit CH+ column density and physical conditions from the observed line fluxes.
Results. Our CLOUDY model reproduces the observed CH+ line fluxes to within a factor of 1.3 on average, with a maximum deviation of a factor of 3. It also suggests that the rotational and ro-vibrational CH+ lines originate from physically distinct regions within NGC 7027 that differ mostly in kinetic temperature. Our RADEX models show that chemical pumping significantly enhances the population of all levels above (v = 0, J = 1), with a strong increase in the ro-vibrational line intensities within the v = 2 → 1 band. A single-zone model, however, remains limited, and we strongly encourage using a full 1D model, which consistently incorporates all excitation processes, with the rate coefficients we accurately determined here.
Key words: astrochemistry / molecular data / molecular processes / radiative transfer / photon-dominated region (PDR) / planetary nebulae: individual: NGC 7027
© The Authors 2026
 Open Access article, published by EDP Sciences, under the terms of the Creative Commons Attribution License (https://creativecommons.org/licenses/by/4.0), which permits unrestricted use, distribution, and reproduction in any medium, provided the original work is properly cited.
This article is published in open access under the Subscribe to Open model. This email address is being protected from spambots. You need JavaScript enabled to view it. to support open access publication.
1 Introduction
The source NGC 7027 is one of the brightest and best-studied young planetary nebulae. It is characterized by a dense, carbon-rich molecular envelope surrounding a hot central star (Sil et al. 2025, hereafter, Paper I and references therein). It serves as a classic example for examining the interactions between intense ultraviolet radiation and molecular chemistry in evolved stellar environments. Despite the harsh ultraviolet radiation field, a rich molecular chemistry is sustained in its outer layers, where vibrationally excited H2 and CH+ have been observed in the photodissociation region (PDR) of NGC 7027. Methylidynium (CH+) was initially detected in the planetary nebula NGC 7027 more than two decades ago through far-infrared observations of its pure rotational transitions (Cernicharo et al. 1997). Neufeld et al. (2020) detected nine ro-vibrational emission lines of CH+, v = 1 → 0 R(0) − R(3) and P(1) − P(5) for the first time in the same source. Subsequently, Neufeld et al. (2021) reported the detection of four additional ro-vibrational emission lines of CH+ v = 1 → 0, P(7) − P(10) transitions along with nine infrared transitions of H2, comprising the S(8), S(9), S(13), and S(15) pure rotational lines, v = 1 → 0 O(4) − O(7) lines, and the v = 2 → 1 O(5) line. The presence of CH+ in this environment is particularly significant because its efficient formation is attributed to the endothermic reaction C+(2P) + H2(1Σ+) → CH+ (X1 Σ+) + H(2S), which becomes exothermic when H2 is rotationally (J ≥ 8, where J is the rotational quantum number) or vibrationally (v ≥ 1, where v is the vibrational quantum number) excited, highlighting the key role of internally excited H2 in the chemistry within the nebula (Godard & Cernicharo 2013; Faure et al. 2017; Neufeld et al. 2021). If CH+ is destroyed before reaching a radiative or collisional equilibrium, the level populations will (partly) reflect its formation conditions. This effect is known as chemical formation pumping and was originally investigated in detail by Godard & Cernicharo (2013). Later, using the first accurate set of state-resolved rate coefficients for CH+ rotational excitation (with J ≤ 13) (Faure et al. 2017) and then a larger set with approximate data for CH+ ro-vibrational excitation (Neufeld et al. 2021), it was confirmed that chemical pumping indeed has a substantial effect on the excitation of CH+ in PDRs.
First identified in absorption in the diffuse interstellar medium (ISM) by Douglas & Herzberg (1941), CH+ has subsequently been observed in a variety of astrophysical environments beyond planetary nebulae, including massive star-forming regions (Falgarone et al. 2010), protoplanetary disks (Thi et al. 2011; Zannese et al. 2025), PDRs, such as the Orion bar (Zannese et al. 2025), and external galaxies (Rangwala et al. 2014). We note, in particular, that through the unprecedented spatial resolution and sensitivity of the James Webb Space Telescope (JWST), CH+ and CH3+ ions have been detected in emission in the Orion bar and in d203-506 protoplanetary disk regions, heavily irradiated by the Trapezium star cluster (Berné et al. 2023; Zannese et al. 2025).
We report new calculations for the chemistry and excitation of CH+ in NGC 7027 based on an accurate set of state-resolved rate coefficients covering the rotational and ro-vibrational excitation of CH+. This was made possible through recent theoretical and experimental works providing state-resolved data for the formation, excitation, and destruction of CH+, as presented in Appendices A, B, and C. The nonlocal thermodynamic equilibrium (NLTE) analysis of the observed CH+ rotational and ro-vibrational emissions is first performed with the code CLOUDY (v23.01; Chatzikos et al. 2023) and then with the code RADEX (van der Tak et al. 2007). Both codes use our newly constructed CH+ collision dataset for inelastic transitions. In a second approach, chemical pumping of CH+ is implemented in RADEX, and the observed line fluxes are fitted using Markov chain Monte Carlo (MCMC) sampling (Goodman & Weare 2010) performed on the parameter space, namely the kinetic temperature, the atomic hydrogen and electron densities, and the CH+ column density. In Sect. 2 we report the predicted results of our NLTE models and compare them with the observed CH+ line fluxes. Finally, in Sect. 3, we briefly discuss the implications of our important findings and summarize our concluding remarks.
2 Modeling and results
2.1 CLOUDY modeling and results
We used the 1D photoionization code CLOUDY to model the chemical structure of CH+ and to interpret the observed line flux features in the prototypical PDR of NGC 7027, in a similar way as in Paper I (which focused on HeH+). To do this, we approximated the elongated nebula to be spherically symmetric and assumed that the dynamically young nebula was in steady-state equilibrium.
2.1.1 Physical conditions
The physical model parameters are listed in Table 1. Our standard model assumes a homogeneous spherical shell of gas surrounding a hot central star, a white dwarf, emitting as a blackbody. This model is computed under the assumption of constant pressure, as in Paper I. The pressure was adjusted by fixing the initial total hydrogen nuclei density [n(Htot)] at 3.06 × 104 cm−3 to obtain a Strömgren sphere of angular radius at 4.6″(~0.02186 pc = 6.74 × 1016 cm, corresponding to the geometric mean of the semimajor and semiminor axes of the radio continuum emission; Basart & Daub 1987), considering a source distance of 980 pc (Zijlstra et al. 2008). The resulting geometry is a thick, spherical, and closed shell. The default initial gas-phase elemental abundance (relative to the total number of hydrogen nuclei) set for planetary nebulae in CLOUDY modeling is primarily from Aller & Czyzak (1983); Khromov (1989, see Table 2 of Paper I). We only highlight the modifications made to the modeling of NGC 7027 compared to Paper I, while more detailed modeling is presented in Paper I.
Following Lau et al. (2016), we adjusted the dust properties of three independent components with large grains (LGs), very small grains (VSGs), and polycyclic aromatic hydrocarbons (PAHs), constituting exactly 96.6, 1.9, and 1.5% of the total dust by mass, respectively. With these different components of the grain size distribution, we obtained a dust-to-gas mass ratio (Md/Mg) of ~1/145. A ratio of extinction per reddening of RV = AV/E(B − V) = 7.71 and an extinction-to-gas ratio = AV/N(H) ~ 1.37 × 10⁻²² mag cm2 were obtained from our model. For comparison, typical diffuse ISM values are RV ≈ 3.1 and AV/N(H) ≈ 5.3 × 10⁻²² mag cm2. The significantly higher RV and lower AV/N(H) obtained from our model indicate a flatter extinction curve and reduced extinction efficiency per hydrogen atom relative to the diffuse ISM, consistent with a grain population biased toward larger sizes and the dust mass distribution being dominated by large grains, with a relative deficit of small grains.
As a caveat, we note that the sound travel time (~4186 years) in our isobaric model is longer than the kinematic (~600 years; Masson 1989) and dynamic (~1000–2000 years; Santander-García et al. 2012; Ali et al. 2015; Schönberner et al. 2018; Guerrero et al. 2020) ages of the nebula. The formation and destruction timescales (~104 years) of H2 are also much longer than the age of the system, which makes the steady-state equilibrium assumption practical, but not fully justified. The turbulent velocity dispersion (σturb) was set to 6 km s−1 following Neufeld et al. (2021). Finally, our model incorporates the comprehensive model of the H2 molecule as described by Shaw et al. (2005). In the following, we present the results of our model.
Physical parameters and corresponding values used in the CLOUDY model.
2.1.2 Chemistry
Given the physical conditions described above, the code computed the abundance of each species by solving the chemical reactions under steady-state assumptions. The equilibrium abundance of CH+ is dominated by the reactions noted in Table A.1 (see Appendix A), specifically, the formation reaction between C+ and H2 (reaction R1) and destruction reaction with atomic hydrogen (reaction R4) due to their high densities in the PDR. All the rate coefficients of the reactions noted in Table A.1 were updated using recent calculations, except for reaction R5 (for more details, see Appendix A). The other chemical reactions related to CH+ followed the default settings in CLOUDY v23.01.
The top panel of Figure 1 shows the equilibrium temperature and density profiles of H, H+, H2, ![Mathematical equation: $\[\mathrm{H}_{2}^{*}\]$](/articles/aa/full_html/2026/05/aa59012-26/aa59012-26-eq1.png) (vibrationally excited H2), e−, C, C+, CH+, and HeH+ as a function of the distance from the star, starting from the illuminated face (~0.0147 pc, where the starlight strikes the cloud) up to a certain depth (AV = 1.5 mag) where the temperature drops to 80 K (distance of the outer model boundary ~0.0289 pc). In the middle and bottom panels, we present the equilibrium temperature and abundances of species as functions of AV and the distance (linear and angular) from the star (starting from the ionization front), respectively. The middle and bottom panels are shown explicitly for comparison with the left panel of Fig. 9 in Neufeld et al. (2021), where the authors used the 1D Meudon PDR code (Le Petit et al. 2006) in a plane-parallel setup to model CH+ for an isochoric PDR model with a density n(Htot) = 3 × 105 cm−3. We obtained a CH+ peak abundance (always with respect to the total number of hydrogen nuclei, unless otherwise stated) of ~2.6 × 10⁻⁷ along the CH+ plateau region (~0.0265–0.0275 pc with temperatures of ~800–1500 K). This is lower by a factor of 5 than that obtained (~1.2 × 10⁻⁶) by Neufeld et al. (2021) around temperatures ~1000–2000 K for an isochoric model (see their Fig. 9). It is important to note that the CH+ abundance peak from our model (which appears at an angular distance of 5.6″–5.8″ from the central star) shifts toward the outer boundary of the shell as compared to Neufeld et al. (2021), who obtained it around 4.8″–4.9″ (see their left panel of Fig. 9). Thus, our model suggests that the emission of CH+ is likely to originate from regions approximately at and extending beyond a spherical shell radius of 5.5″, consistent with the observational angular sizes for pure rotational lines of CH+ (see notes in Table 2). The CH+ abundance peak plateau falls rapidly at the H/H2 transition front (the so-called dissociation front where molecular hydrogen number density reaches 50% of the number density of total hydrogen nuclei) around AV = 1.13 mag. We note that the H/H2 front is shifted outward (beyond AV = 1 mag) compared to the findings of Godard & Cernicharo (2013); Neufeld et al. (2021). We identified this effect as resulting from the modified (enhanced) rate coefficient for the destruction of H2 by C+ and from the dust model.
(vibrationally excited H2), e−, C, C+, CH+, and HeH+ as a function of the distance from the star, starting from the illuminated face (~0.0147 pc, where the starlight strikes the cloud) up to a certain depth (AV = 1.5 mag) where the temperature drops to 80 K (distance of the outer model boundary ~0.0289 pc). In the middle and bottom panels, we present the equilibrium temperature and abundances of species as functions of AV and the distance (linear and angular) from the star (starting from the ionization front), respectively. The middle and bottom panels are shown explicitly for comparison with the left panel of Fig. 9 in Neufeld et al. (2021), where the authors used the 1D Meudon PDR code (Le Petit et al. 2006) in a plane-parallel setup to model CH+ for an isochoric PDR model with a density n(Htot) = 3 × 105 cm−3. We obtained a CH+ peak abundance (always with respect to the total number of hydrogen nuclei, unless otherwise stated) of ~2.6 × 10⁻⁷ along the CH+ plateau region (~0.0265–0.0275 pc with temperatures of ~800–1500 K). This is lower by a factor of 5 than that obtained (~1.2 × 10⁻⁶) by Neufeld et al. (2021) around temperatures ~1000–2000 K for an isochoric model (see their Fig. 9). It is important to note that the CH+ abundance peak from our model (which appears at an angular distance of 5.6″–5.8″ from the central star) shifts toward the outer boundary of the shell as compared to Neufeld et al. (2021), who obtained it around 4.8″–4.9″ (see their left panel of Fig. 9). Thus, our model suggests that the emission of CH+ is likely to originate from regions approximately at and extending beyond a spherical shell radius of 5.5″, consistent with the observational angular sizes for pure rotational lines of CH+ (see notes in Table 2). The CH+ abundance peak plateau falls rapidly at the H/H2 transition front (the so-called dissociation front where molecular hydrogen number density reaches 50% of the number density of total hydrogen nuclei) around AV = 1.13 mag. We note that the H/H2 front is shifted outward (beyond AV = 1 mag) compared to the findings of Godard & Cernicharo (2013); Neufeld et al. (2021). We identified this effect as resulting from the modified (enhanced) rate coefficient for the destruction of H2 by C+ and from the dust model.
The HeH+ density and abundance profiles are also plotted in order to compare them with the findings from Paper I. As in our previous work, the HeH+ peak appears near the ionization front (where half of the H+ has recombined) with a peak abundance of 1.01 × 10⁻⁸ and a total column density of 1.09 × 1012 cm−2, very similar to the results of Paper I. This illustrates the benefit of using the code CLOUDY, which is capable of describing the physical structure of HII regions (from the illuminated face of the cloud to the ionization front) and PDRs.
2.1.3 NLTE calculations
In CLOUDY, the NLTE radiative transfer is treated in 1D geometry within the escape probability formalism (Ferland et al. 2017, and references therein). We employed the closed spherically symmetric geometry (implicit for planetary nebulae) with the sphere expanding (default) option so that the large velocity gradient (LVG), or Sobolev approximation, was employed.
For the spectroscopy and collisional excitation of H2, the default CLOUDY dataset was employed (Wrathmall et al. 2007). For CH+, spectroscopic data (i.e., level energies and radiative rates) were extracted from the EXOMOL database (Tennyson et al. 2016; Pearce et al. 2024) and restricted to the first electronic state (X1Σ+). This set includes a total of 80 ro-vibrational levels, with the highest level (v = 3, J = 11) lying 9495 cm−1 (13 661 K) above the ground state, just below the first excited electronic state, a3Π, at ~1.2 eV (Amitay et al. 1996; Biglari et al. 2014). For inelastic collisions of CH+ with hydrogen atoms and free electrons, we combined several accurate sets of theoretical data with approximations based on propensity rules in order to cover all 80 levels, as described in Appendix C.
In Table 2 we compare the observed line fluxes for CH+ and H2 reported by Neufeld et al. (2021), along with those for HeH+ and H, He+ recombination lines reported by Neufeld et al. (2020) to the predictions of our isobaric CLOUDY model. The line fluxes in CLOUDY are given in units of erg s−1 cm−2. We converted them into beam-integrated fluxes by scaling to the observed angular sizes (see notes in Table 2) for direct comparison with the observations.
As a goodness diagnostic, we report the mean logarithmic ratio of model-predicted (Fpre) and observed (Fobs) line fluxes,
![Mathematical equation: $\[\mu=\frac{1}{N} \sum_{i=1}^N ~\ln \left(\frac{F_{\mathrm{pre}}}{F_{\mathrm{obs}}}\right),\]$](/articles/aa/full_html/2026/05/aa59012-26/aa59012-26-eq5.png) (1)
(1)
where N is the number of transitions. The quantity exp (μ) indicates the geometric mean of the factor by which the model reproduces the observations.
Overall, good agreement is obtained between our CLOUDY model and observations (see orange squares in Fig. 2). On average, the model reproduces observations to within a factor of exp (μ) = 1.28. To be more specific, our model overestimates the CH+ pure rotational lines from J = 1 → 0 to J = 4 → 3 by up to a factor of 3, while it underestimates the lines for J = 5 → 4 and J = 6 → 5 by factors of 1.3 and 1.6, respectively. For the CH+ ro-vibrational lines, the agreement is within a factor of exp (μ) = 1.22 on average. A good match is thus obtained between our CLOUDY model and observations, suggesting that our updated rate coefficients are reliable and that the chosen H2 excitation temperature (1900 K) for reaction R1 is appropriate for NGC 7027. It is instructive to compare our results with the best isobaric Meudon PDR model (including CH+ chemical pumping) of Neufeld et al. (2021), even though the reactive and inelastic rate coefficients were less accurate. Thus, with a thermal pressure of P/kB = 3 × 10⁸ K cm−3, their model underestimates the pure rotational lines (except J = 1 → 0) and lower-energy ro-vibrational lines, while it overestimates high-excitation ro-vibrational lines of CH+ by up to a factor of 2. Thus, globally, the isobaric CLOUDY and Meudon PDR models show comparable agreement with the observations (see blue and orange symbols in Fig. 2). We note that the constant-pressure prescription in CLOUDY refers to total pressure (gas + turbulent + radiation), whereas in the Meudon PDR code, it corresponds to gas thermal pressure alone. Therefore, the numerical pressure values adopted in different codes are not directly equivalent.
In order to better highlight our results, Fig. D.1 illustrates the intrinsic (local) line emissivities of CH+ as a function of distance from the star. The rotational and ro-vibrational CH+ emission peaks are seen to arise from two distinct physical regions that mainly differ in temperature (~850 versus 1500 K, respectively). We can also observe that the rotational emission peak shows a broader plateau, while the ro-vibrational peak is more sharply peaked. This result suggests that the pure rotational and ro-vibrational lines of CH+ probe separate regions in the PDR of NGC 7027, and this might help us to constrain the kinetic temperature gradient just upstream of the H/H2 transition front.
A comparison between our CLOUDY model-predicted and observed H2 line fluxes is listed in Table 2 and depicted in Fig. 3. Our isobaric model is found to reasonably explain the observed fluxes of H2 lines to within a factor of 5.66 on average. As a comparison, the best isobaric Meudon PDR model by Neufeld et al. (2021) reproduces the H2 ro-vibrational line fluxes within a factor of 4, except for the v = 0 → 0 S(15) and S(13) lines of H2, which are overestimated by a factor of ~10 and 20, respectively. To facilitate the understanding of the emitting region of the observed H2 lines, the intrinsic H2 line emissivities obtained from our CLOUDY model are also plotted in Fig. D.2. Figs. D.1 and D.2 both show that CH+ emits from the same region as H2, meaning that CH+ emission is strongly linked to vibrationally excited H2, as expected.
It should be noted that the dynamical age of NGC 7027 depends on the structures to which it refers. For the inner region traced by the emissions modeled here, it is 1000–2000 years (Santander-García et al. 2012; Ali et al. 2015; Schönberner et al. 2018; Guerrero et al. 2020), while earlier estimates based on multi-epoch observations of the nebula radio emission yield ~600 years (Masson 1989). In the PDR modeled here, H2 formation is primarily driven by grain-surface reactions and not by the H− channel, even in the warm molecular layer where CH+ and H2 emissions arise at temperatures of ~1500 K. The discrepancy may be due to the time-dependent thermal and chemical evolution of the warm molecular gas, which cannot be captured by the current steady-state approximation. This might explain why our stationary CLOUDY model overpredicts the H2 emission.
Table 2 shows that for HeH+, H I, He II, and He I, our predictions are fully consistent with Paper I. This confirms that our current isobaric model is able to explain most of the observed line fluxes of CH+, HeH+, H2, and H, He+ recombination lines simultaneously and within a factor of 2–5, with the exception of some ro-vibrational lines of H2.
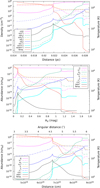 |
Fig. 1 Top panel: equilibrium temperature and densities of H, H+, H2, |
![Mathematical equation: $\[\mathrm{H}_{2}^{*}\]$](/articles/aa/full_html/2026/05/aa59012-26/aa59012-26-eq2.png)
Comparison between the observed and CLOUDY model-predicted line fluxes.
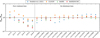 |
Fig. 2 Ratios of different model-predicted to observed line fluxes (Fpre/Fobs) of rotational and ro-vibrational lines of CH+ as functions of the line names. |
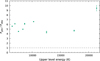 |
Fig. 3 Ratios of CLOUDY model-predicted to observed line fluxes (Fpre/Fobs) of rotational and ro-vibrational lines of H2 as a function of the upper level energies of transitions. |
Physical parameters at CH+ abundance peak and the total CH+ column density obtained from the CLOUDY model.
2.2 RADEX modeling and results
In RADEX, the NLTE radiative transfer is solved for a homogeneous and isothermal medium within the escape probability formalism (van der Tak et al. 2007). As with CLOUDY, the LVG approximation (option expanding sphere) was used to model the CH+ emission in NGC 7027.
The RADEX parameters for the physical conditions, namely, kinetic temperature Tkin, atomic hydrogen density n(H), and electron density n(e−), were extracted from the CLOUDY solution at the CH+ abundance peak. As previously discussed in Sect. 2.1.2 and illustrated in Fig. 1, the CH+ abundance peak exhibits a plateau. Fig. D.1 shows that the rotational and ro-vibrational CH+ lines originate from two distinct physical regions. As noted in Table 3, the main difference between these two regions is the temperature, which increases from 850 K (at the rotational emission peak) to 1500 K (at the ro-vibrational emission peak). Since RADEX considers radiative transfer through a single-zone isothermal medium, radial 1D effects (e.g., varying physical and chemical conditions) can obviously not be captured. However, since the first excited vibrational state (v = 1) of CH+ opens at 3942 K above the ground state, it seems more appropriate to use a kinetic temperature above 1000 K in order to efficiently populate by collisions the observed CH+ ro-vibrational states. We therefore selected the warmer physical conditions (T = 1507 K) at the ro-vibrational emission peak, allowing the first vibrational state to be more easily populated through collisions via the high-energy tail of the Maxwellian kinetic energy distribution. The last parameter is the CH+ column density per unit velocity interval. The total CH+ column density was taken as the CLOUDY value (also reported in Table 3), and a line width (FWHM) of 30 km s−1 was selected as representative of the detected lines of CH+ (Cernicharo et al. 1997; Neufeld et al. 2021). The incident radiative continuum at the illuminated face of the cloud, derived from the CLOUDY model (and in close agreement with the best-fit dust model of Lau et al. 2016), was also included in RADEX as a background radiation field. We note, however, that the effect of this radiation field on the level populations is a few percent at most, so that radiative pumping of CH+ is minor in NGC 7027 (see discussion in Sect. 2.4). Finally, the same spectroscopic and collisional dataset as used in CLOUDY (see Sect. 2.1.3) was used, thus considering inelastic collisions with hydrogen atoms and electrons.
The predicted line fluxes are reported in Table 4. The agreement is better for the ro-vibrational lines (exp (μ) = 0.87) than for the rotational lines (exp (μ) = 0.50), yielding an overall mean agreement of exp (μ) = 0.74. Significant differences between CLOUDY and RADEX are found for CH+ pure rotational lines, by factors of ~2–3, whereas for ro-vibrational lines, the RADEX line fluxes are only ~30% lower than those from CLOUDY (see orange and green symbols in Fig. 2, Tables 2 and 4). The discrepancy observed for rotational lines reflects the extended plateau of rotational emissivities primarily, as illustrated in Fig. D.1. Our CLOUDY model indeed predicts a large gradient of the kinetic temperature across this region (just before the H/H2 front). The inability of RADEX to simultaneously reproduce the observed CH+ rotational and ro-vibrational lines with comparable accuracy thus supports the finding that these lines probe distinct regions with different physical conditions. This is corroborated by the much better average factor (exp (μ)) for ro-vibrational lines compared to rotational lines. Finally, we note that the relatively good agreement between CLOUDY and RADEX for the CH+ ro-vibrational line fluxes is similar to that observed in Paper I for HeH+, whose abundance and line emissivities are even more strongly peaked.
2.3 RADEX/MCMC modeling and results
In this section, another approach that introduces chemical pumping into the NLTE analysis was used to investigate in depth the CH+ line excitation. Indeed, because CH+ belongs to the class of reactive ions, that is, species that react fast with the dominant colliders (here electrons and H atoms), the chemical source and sink terms must in principle be included when solving the statistical-equilibrium equations. These two terms describe the so-called chemical (or formation) pumping process by which a reactive ion (i.e., with short chemical lifetime) retains memory of its formation conditions. The general consequence is a hotter distribution of rotational and ro-vibrational levels.
The version of RADEX, as modified by Faure et al. (2017), was employed in order to include the state-resolved formation and destruction rate coefficients of CH+ for all 80 CH+ levels belonging to the ground electronic state X1Σ+ (see Appendix B).
In contrast to the previous (see Sect. 2.2) NLTE RADEX calculations, where the physical conditions and CH+ total column density were taken from the CLOUDY results (at CH+ ro-vibrational emission peak), RADEX was combined with MCMC sampling in order to determine without a model prescription the physical parameters that best reproduce all 20 lines of CH+ detected in NGC 7027. MCMC is a statistical method used to estimate the parameters of a model by iteratively generating random samples from prior probability distributions. To compute the likelihood of the parameters given the observations, we used the publicly available MCMC Python implementation emcee1 developed by Foreman-Mackey et al. (2013).
As discussed above, the modified version of RADEX was used with the LVG approximation (option expanding sphere), a line width (FWHM) of 30 km s−1, and the background radiation field extracted from CLOUDY. We employed 32 MCMC walkers, each with 4096 steps, to ensure parameter space exploration and convergence. We set the initial priors (noted in Table 5) based on the result obtained from the CLOUDY model near the abundance peak of CH+ (see Table 3). The corresponding corner diagram in Fig. E.1 illustrates the posterior distributions and parameter correlations of the four RADEX free parameters (kinetic temperature, atomic hydrogen density, electron density, and CH+ column density) obtained from the RADEX/MCMC sampling. The first 2048 burn-in steps were discarded, and the posterior distributions were constructed from the subsequent 4096 production steps for each of the 32 walkers.
The posterior distributions are found to be well constrained and approximately Gaussian. In particular, the CH+ column density is found to be independent of the kinetic temperature and hydrogen atom density. In contrast, N(CH+)is anticorrelated with the electron density, reflecting the fact that it is primarily the product of N(CH+)and n(e−)which is tightly constrained. In practice, the best model gives Tkin = 1258 K, n(H) = 1.62 × 105 cm−3, n(e−) = 5.89 × 103 cm−3, and N[CH+] = 1.48 × 1014 cm−2. The kinetic temperature and hydrogen density compare well with the average values derived from CLOUDY around the CH+ plateau (see Table 3). In contrast, the electron density is higher by a factor of 10, while the CH+ column density is lower by a factor of ~4. As a result, the electron fraction, defined as xe = n(e−)/n(Htot) and approximated here by xe ~ n(e−)/n(H), is very high, ~3.64 × 10⁻², and much higher than the expected value of ~10−3 (i.e., the C+ abundance, since most electrons come from the ionization of atomic C; see Fig. 1). On the other hand, the product of N(CH+)by n(e−)agrees well with that calculated using the CLOUDY values reported in Table 3, which supports the MCMC modeling. In addition, it should be noted that n(e−)/n(H) is an upper limit of the actual electron fraction, although the H2 molecular fraction (fH2 = 2n(H2)/[n(H) + 2n(H2)]) at the CH+ abundance peak, as predicted by CLOUDY, is low and typically between 1 and 10% (see Table 3).
The predicted line fluxes are reported in Table 6. The agreement between the MCMC best-fit and the observed CH+ line fluxes is better for ro-vibrational lines (to within a factor of exp (μ) = 0.97 on average) than for rotational lines (exp (μ) = 0.50) (see the red symbols in Fig. 2). This result is reminiscent of what was reported previously. Our CLOUDY results suggest that rotational and ro-vibrational lines arise from markedly distinct regions, differing in their temperature and spatial extension. RADEX calculations are therefore intrinsically limited to reproduce all lines (see Sect. 2.2). The overpredicted electron density is likely a consequence of this limitation, namely, the use of a single-zone rather than a one-dimensional approach. It should be noted that removing the ro-vibrational lines from the MCMC fit results in a much smaller electron fraction of ~3 × 10⁻⁵, a much lower kinetic temperature of ~200 K, and a slightly higher CH+ column density of ~4 × 1014 cm−2. This also comes at the cost of a large underestimation of the ro-vibrational line fluxes. Alternatively, removing the rotational lines from the MCMC fit results in a lower CH+ column density of ~3 × 1013 cm−2, and does not substantially improve the electron fraction (~10−2).
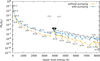 |
Fig. 4 Ro-vibrational population diagram of CH+ (v, J) as predicted by RADEX considering the physical condition at ro-vibrational emission peak from the CLOUDY model noted in Table 3. |
2.4 Effect of chemical pumping
In order to assess the role of chemical pumping in the CH+ excitation, we compare below two RADEX models considering the physical conditions at the ro-vibrational CH+ emission peak from the CLOUDY model (see Table 3): one model considers chemical pumping, and in the other, the chemical source and sink terms are ignored in the statistical-equilibrium equations. The results are illustrated in the population diagram of Fig. 4, where the relative population (divided by the degeneracy) of levels with upper energy lower than 8274 K, that is, up to (v = 2, J = 5), is plotted as a function of the upper-level energy. Except for levels (v = 0, J = 1) and to a lesser extent, (v = 1, J = 0), the population of all levels is significantly affected by chemical pumping. This process is found to increase populations by up to a factor of 10. This can be rationalized by comparing the destruction and excitation rates of CH+. For the approximate electron fraction xe ~ n(e−)/n(H) = 1.1 × 10⁻³ (at the CH+ ro-vibrational emission peak; see Table 3), we expect hydrogen atoms and electrons to dominate the destruction and excitation of CH+, respectively (see Appendices B and C). As indicated by our collisional dataset, the destruction state-resolved rate coefficients for H are (at 1300 K) about (4–9) × 10−10 cm3s−1, while the electron-impact excitation rate coefficients from the ground (v, J) = (0, 0) to the first excited level (0, 1) is 1.2 × 10⁻⁶ cm3 s−1, so that excitation of (0, 1) dominates destruction. On the other hand, for higher levels, electron-impact excitation rate coefficients are lower than ~4 × 10⁻⁷ cm3s−1 and destruction prevails. For these levels, the higher populations (with pumping) thus simply reflect their relatively short chemical lifetime. It should be noted that for levels higher than 8274 K, the chemical pumping effect boosts the level populations even further, by several orders of magnitude.
More generally, chemical pumping of CH+ should be a major process in most PDR environments because the (state-resolved) destruction of CH+ by H or electrons is faster than or comparable to its excitation by these species, with rate coefficients at Tkin = 1000 K of ~5 × 10⁻¹⁰ cm3 s−1 and ~3 × 10⁻⁷ cm3s−1 for destruction, compared to ~10−10 cm3s−1 and ~5 × 10⁻⁷ cm3s−1 for (de)excitation, respectively. In NGC 7027, electrons are the dominant exciting species of CH+ because the ionization fraction is large, but excitation by hydrogen atoms would prevail in other environments where xe ≲ 10−4. Moreover, radiative excitation was found to play a minor role in NGC 7027 (see Sect. 2.2). This can be understood by comparing the radiative pumping rate to the electron-impact excitation rate, for instance, for the transition (0, 0) → (1, 1): with the radiative continuum flux from CLOUDY at the corresponding wavelength of 3.615 μm (Jν ~ 1 Jy/nsr), the infrared pumping rate is ~2 × 10⁻⁹ s−1, which is lower by two orders of magnitude than the electron-impact excitation rate of 4.1 × 10⁻⁷ s−1 (at Tkin = 1000 K and n(e−) = 5.55 × 102 cm−3). Infrared pumping will thus significantly affect the CH+ population in environments with much stronger dust continua or much lower densities.
Finally, the line surface brightness variation with wavelength is plotted in Fig. 5. The two spectra correspond to the populations presented in Fig. 4, that is, with and without pumping, for physical conditions at the ro-vibrational emission peak from the CLOUDY model. Table F.1 presents the surface brightness of the most intense CH+ ro-vibrational transitions with and without pumping. Chemical pumping increases the most intense lines (those with a surface brightness above 10−4 erg cm−2 s−1 sr−1) by factors of ~2–3. For weaker lines, much larger enhancement factors are observed, for instance, for pure rotational lines within v = 1, which at ~30 μm are predicted with line surface brightnesses up to ~2 × 10⁻⁵ erg cm−2 s−1 sr−1 with pumping, but are lower by one order of magnitude without pumping. The detection of these transitions, as well as ro-vibrational lines of the v = 2 → 1 band at ~4 μm, would provide an even more constraining diagnostic of the physical conditions. We note in this context that six ro-vibrational lines of the v = 2 → 1 band were recently detected with JWST toward the irradiated protoplanetary disk d203-506 (with line intensities of (1–10) × 10−6 erg cm−2 s−1 sr−1), where chemical pumping was investigated using a simple excitation model (Zannese et al. 2025).
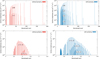 |
Fig. 5 CH+ line surface brightness variation with wavelength as predicted by RADEX considering the physical condition at ro-vibrational emission peak from the CLOUDY model noted in Table 3. The left panel shows this without chemical pumping, and the right panel considers chemical pumping. Upper panel: full spectrum in the wavelength range 0–200 μm. Lower panel: most intense ro-vibrational line spectrum in the wavelength range 3–5.5 μm. |
3 Discussion and conclusions
The exposure of dense, molecular gas to the UV radiation from the hot central star of the compact young PN NGC 7027 (T ≃ 198 kK, Latter et al. 2000) and to the X-ray emissions from shocked gas (Kastner et al. 2001; Montez & Kastner 2018), represents a rich laboratory for the interplay of radiative and chemical interactions. The conditions between the Strömgren sphere and the inner boundary of the PDR provide a testbed for predictions of the production and destruction rates of reactive ions such as CO+ (Bublitz et al. 2023) and CH+ (this work). The latter contributes, through a series of two hydrogen abstraction reactions and thus bypassing the path through the slow radiative association of C+ and H2, to the buildup of CH3+ (Smith 1992), which in turn drives the organic chemistry in such environments. In this respect, the first detection of CH3+ in a planetary nebula (NGC 6302, Bhatt et al. 2025, with JWST/MIRI) comes as no surprise, except for the fact that unlike NGC 7027, NGC 6302 is oxygen rich. Conversely, a product of oxygen chemistry, OH, was recently and for the first time detected in a planetary nebula (Ouyang et al. 2024), which is none other than the carbon-rich NGC 7027.
A deeper understanding of these observational findings requires simulations such as those presented in this study. We used the 1D photoionization code CLOUDY and the isothermal single-zone NLTE code RADEX (without and with chemical pumping) to conduct a comprehensive analysis aimed at determining how the observed CH+ emissions from NGC 7027 can help us to evaluate our understanding of the CH+ chemistry and excitation, and to place constraints on the physical conditions. The analysis was largely based on the recent availability of accurate sets of state-specific rate coefficients for the formation, excitation, and destruction of CH+.
Although the limitations are similar as discussed in Paper I, our isobaric CLOUDY model can reproduce observed CH+ pure rotational and ro-vibrational line intensities within a factor of 1.3 on average, with a maximum deviation of a factor of 3. The predictions for HeH+ and H, He+ recombination lines are also entirely consistent with Paper I. On the other hand, our stationary CLOUDY model overpredicts the observed H2 emissions by up to a factor of 10, perhaps reflecting the short dynamical age of NGC 7027 and the time-dependent chemistry of H2. Our 1D CLOUDY model also suggests that the rotational and ro-vibrational CH+ lines probe physically distinct regions of NGC 7027, with different kinetic temperatures. Our RADEX model with chemical pumping, considering a uniform medium, is indeed unable to reproduce the rotational and ro-vibrational lines intensities simultaneously. The overpredicted electron density (by a factor of 10) obtained from the RADEX/MCMC best-fit model likely reflects the geometric limitation arising from the single-zone approximation.
Conversely, chemical pumping is found to markedly increase the populations of all CH+ levels above (v = 0, J = 1). Our RADEX model with chemical pumping thus suggests that the detection of pure rotational lines within v = 1 and ro-vibrational lines of the v = 2 → 1 band would provide additional constraints on the physical conditions, especially the kinetic temperature gradient, just upstream of the H/H2 transition region. We conclude that it is highly desirable to enable CLOUDY to consistently couple subsets of the underlying chemical reaction network to the statistical equilibrium calculations. It will also be interesting to implement the current set of state-resolved inelastic and reactive rates in a 1D complete PDR model, such as that of Neufeld et al. (2021).
Data availability
The new extended CH+ ro-vibrational inelastic dataset underlying this article will be made available in the Excitation of Molecules and Atoms for Astrophysics (EMAA) database, https://emaa.osug.fr and https://dx.doi.org/10.17178/EMAA (Faure et al. 2025).
Acknowledgements
The authors thank the anonymous referee for the valuable suggestions and constructive feedback, which have significantly improved the quality of this work. M.S. acknowledges financial support from the European Research Council (consolidated grant COLLEXISM, grant agreement ID: 811363). This research was carried out within the framework of IPAG, UMR 5274, with support from a CNRS postdoctoral fellowship. M.S. further acknowledges support from the National Science and Technology Council, Taiwan (Grant Nos. NSTC-114-2811-M-007-017, NSTC-111-2112-M-007-014-MY3, NSTC-113-2639-M-A49-002-ASP, and NSTC-113-2112-M-007-027), and from the Postdoctoral Incentive Award of the Research Talent Resource Center at National Tsing Hua University. T.G.L. acknowledges funding from Grant No. MICIU/AIE/10.13039/501100011033 PID2024-155666NB-I00. J.F. acknowledges support from the USA National Science Foundation award number AST-2303895. This research made use of CLOUDY (Chatzikos et al. 2023), RADEX (van der Tak et al. 2007), emcee (Foreman-Mackey et al. 2013), astropy (http://www.astropy.org; Astropy Collaboration 2022), corner (Foreman-Mackey 2016), matplotlib (Hunter 2007), numpy (Harris et al. 2020), UKRmol+ 3.2 (for the electron-CH+ scattering calculations; Mašín et al. 2020), and Psi4 (for the underlying CH+ electronic structure calculations; Smith et al. 2020). This document was prepared using the collaborative tool Overleaf available at: https://www.overleaf.com/.
References
- Ali, A., Ismail, H. A., & Alsolami, Z. 2015, Ap&SS, 357, 21 [Google Scholar]
- Aller, L. H., & Czyzak, S. J. 1983, ApJS, 51, 211 [NASA ADS] [CrossRef] [Google Scholar]
- Amitay, Z., Zajfman, D., Forck, P., et al. 1996, Phys. Rev. A, 54, 4032 [Google Scholar]
- Astropy Collaboration (Price-Whelan, A. M., et al.) 2022, ApJ, 935, 167 [NASA ADS] [CrossRef] [Google Scholar]
- Basart, J. P., & Daub, C. T. 1987, ApJ, 317, 412 [Google Scholar]
- Berné, O., Martin-Drumel, M.-A., Schroetter, I., et al. 2023, Nature, 621, 56 [CrossRef] [Google Scholar]
- Bhatt, C., Cami, J., Peeters, E., et al. 2025, ApJ, 995, 67 [Google Scholar]
- Biglari, Z., Shayesteh, A., & Maghari, A. 2014, Comput. Theor. Chem., 1047, 22 [Google Scholar]
- Black, J. H. 1987, Astrophys. Space Sci. Lib., 134, 731 [Google Scholar]
- Bublitz, J., Kastner, J. H., Hily-Blant, P., et al. 2023, ApJ, 942, 14 [Google Scholar]
- Cernicharo, J., Liu, X. W., González-Alfonso, E., et al. 1997, ApJ, 483, L65 [Google Scholar]
- Chatzikos, M., Bianchi, S., Camilloni, F., et al. 2023, Rev. Mexicana Astron. Astrofis., 59, 327 [Google Scholar]
- del Mazo-Sevillano, P., Aguado, A., Lique, F., Jara-Toro, R. A., & Roncero, O. 2025, Phys. Chem. Chem. Phys., 27, 15775 [Google Scholar]
- Douglas, A. E., & Herzberg, G. 1941, ApJ, 94, 381 [NASA ADS] [CrossRef] [Google Scholar]
- Draine, B. T., & Bertoldi, F. 1996, ApJ, 468, 269 [Google Scholar]
- Falgarone, E., Godard, B., Cernicharo, J., et al. 2010, A&A, 521, L15 [NASA ADS] [CrossRef] [EDP Sciences] [Google Scholar]
- Faure, A., Halvick, P., Stoecklin, T., et al. 2017, MNRAS, 469, 612 [NASA ADS] [CrossRef] [Google Scholar]
- Faure, A., Bacmann, A., & Jacquot, R. 2025, A&A, 700, A266 [NASA ADS] [CrossRef] [EDP Sciences] [Google Scholar]
- Ferland, G. J., Chatzikos, M., Guzmán, F., et al. 2017, Rev. Mexicana Astron. Astrofis., 53, 385 [Google Scholar]
- Foreman-Mackey, D. 2016, J. Open Source Softw., 1, 24 [Google Scholar]
- Foreman-Mackey, D., Hogg, D. W., Lang, D., & Goodman, J. 2013, PASP, 125, 306 [Google Scholar]
- Forer, J., Hvizdoš, D., Ayouz, M., Greene, C. H., & Kokoouline, V. 2024, MNRAS, 527, 5238 [Google Scholar]
- Godard, B., & Cernicharo, J. 2013, A&A, 550, A8 [NASA ADS] [CrossRef] [EDP Sciences] [Google Scholar]
- González-Lezana, T., Konings, M., Loreau, J., et al. 2026, Phys. Chem. Chem. Phys., 28, 4065 [Google Scholar]
- Goodman, J., & Weare, J. 2010, Commun. Appl. Math. Comput. Sci., 5, 65 [Google Scholar]
- Guerrero, M. A., Ramos-Larios, G., Toalá, J. A., Balick, B., & Sabin, L. 2020, MNRAS, 495, 2234 [NASA ADS] [Google Scholar]
- Güsten, R., Wiesemeyer, H., Neufeld, D., et al. 2019, Nature, 568, 357 [CrossRef] [Google Scholar]
- Hamilton, J. R., Faure, A., & Tennyson, J. 2016, MNRAS, 455, 3281 [NASA ADS] [CrossRef] [Google Scholar]
- Harris, C. R., Millman, K. J., van der Walt, S. J., et al. 2020, Nature, 585, 357 [NASA ADS] [CrossRef] [Google Scholar]
- Heays, A. N., Bosman, A. D., & van Dishoeck, E. F. 2017, A&A, 602, A105 [NASA ADS] [CrossRef] [EDP Sciences] [Google Scholar]
- Hierl, P. M., Morris, R. A., & Viggiano, A. A. 1997, J. Chem. Phys., 106, 10145 [Google Scholar]
- Hunter, J. D. 2007, Comput. Sci. Eng., 9, 90 [NASA ADS] [CrossRef] [Google Scholar]
- Kálosi, Á., Grieser, M., von Hahn, R., et al. 2022, Phys. Rev. Lett., 128, 183402 [Google Scholar]
- Kastner, J. H., Vrtilek, S. D., & Soker, N. 2001, ApJ, 550, L189 [Google Scholar]
- Khromov, G. S. 1989, Space Sci. Rev., 51, 339 [NASA ADS] [CrossRef] [Google Scholar]
- Konings, M., Desrousseaux, B., Lique, F., & Loreau, J. 2021, J. Chem. Phys., 155, 104302 [Google Scholar]
- Latter, W. B., Dayal, A., Bieging, J. H., et al. 2000, ApJ, 539, 783 [NASA ADS] [CrossRef] [Google Scholar]
- Lau, R. M., Werner, M., Sahai, R., & Ressler, M. E. 2016, ApJ, 833, 115 [Google Scholar]
- Le Petit, F., Nehmé, C., Le Bourlot, J., & Roueff, E. 2006, ApJS, 164, 506 [NASA ADS] [CrossRef] [Google Scholar]
- Masson, C. R. 1989, ApJ, 336, 294 [NASA ADS] [Google Scholar]
- Mašín, Z., Benda, J., Gorfinkiel, J. D., Harvey, A. G., & Tennyson, J. 2020, Comp. Phys. Commun., 249, 107092 [Google Scholar]
- Merkt, F., Höveler, K., & Deiglmayr, J. 2022, J. Phys. Chem. Lett., 13, 864 [Google Scholar]
- Montez, Jr., R., & Kastner, J. H. 2018, ApJ, 861, 45 [Google Scholar]
- Neufeld, D. A., Goto, M., Geballe, T. R., et al. 2020, ApJ, 894, 37 [CrossRef] [Google Scholar]
- Neufeld, D. A., Godard, B., Bryan Changala, P., et al. 2021, ApJ, 917, 15 [NASA ADS] [CrossRef] [Google Scholar]
- Ouyang, X.-J., Zhang, Y., Zhang, C.-P., et al. 2024, ApJ, 972, 96 [Google Scholar]
- Paul, D., Grieser, M., Grussie, F., et al. 2022, ApJ, 939, 122 [Google Scholar]
- Pearce, O., Yurchenko, S. N., & Tennyson, J. 2024, MNRAS, 527, 10726 [Google Scholar]
- Plasil, R., Mehner, T., Dohnal, P., et al. 2011, ApJ, 737, 60 [Google Scholar]
- Rangwala, N., Maloney, P. R., Glenn, J., et al. 2014, ApJ, 788, 147 [Google Scholar]
- Santander-García, M., Bujarrabal, V., & Alcolea, J. 2012, A&A, 545, A114 [NASA ADS] [CrossRef] [EDP Sciences] [Google Scholar]
- Schönberner, D., Balick, B., & Jacob, R. 2018, A&A, 609, A126 [NASA ADS] [CrossRef] [EDP Sciences] [Google Scholar]
- Shaw, G., Ferland, G. J., Abel, N. P., Stancil, P. C., & van Hoof, P. A. M. 2005, ApJ, 624, 794 [NASA ADS] [CrossRef] [Google Scholar]
- Sil, M., Faure, A., Wiesemeyer, H., et al. 2025, A&A, 695, A244 [NASA ADS] [CrossRef] [EDP Sciences] [Google Scholar]
- Smith, D. 1992, Chem. Rev., 92, 1473 [Google Scholar]
- Smith, D. G. A., Burns, L. A., Simmonett, A. C., et al. 2020, J. Chem. Phys., 152, 184108 [Google Scholar]
- Tennyson, J., Yurchenko, S. N., Al-Refaie, A. F., et al. 2016, J. Mol. Spectr., 327, 73 [NASA ADS] [CrossRef] [Google Scholar]
- Thi, W. F., Ménard, F., Meeus, G., et al. 2011, A&A, 530, L2 [NASA ADS] [CrossRef] [EDP Sciences] [Google Scholar]
- van der Tak, F. F. S., Black, J. H., Schöier, F. L., Jansen, D. J., & van Dishoeck, E. F. 2007, A&A, 468, 627 [NASA ADS] [CrossRef] [EDP Sciences] [Google Scholar]
- Wesson, R., Cernicharo, J., Barlow, M. J., et al. 2010, A&A, 518, L144 [NASA ADS] [CrossRef] [EDP Sciences] [Google Scholar]
- Wrathmall, S. A., Gusdorf, A., & Flower, D. R. 2007, MNRAS, 382, 133 [NASA ADS] [CrossRef] [Google Scholar]
- Zannese, M., Tabone, B., Habart, E., et al. 2025, A&A, 696, A99 [NASA ADS] [CrossRef] [EDP Sciences] [Google Scholar]
- Zijlstra, A. A., van Hoof, P. A. M., & Perley, R. A. 2008, ApJ, 681, 1296 [NASA ADS] [CrossRef] [Google Scholar]
The occupation probability, p(v′, J′), is directly proportional to the state-to-state rate coefficient (in cm3s−1) for the reaction C+(2P) + H2(v = 2, J = 0) → CH+(v′, J′) + H.
Appendix A Updated reaction rates
The CH+ chemical network from CLOUDY version c23.01 was updated for five among the six dominant formation and destruction reactions R1–R6, as listed in Table A.1. For the hydrogenation of C+(2P) by H2 (reaction R1), we follow CLOUDY’s distinction between two forms of molecular hydrogen: H2 represents the ground vibrational state (v = 0) and ![Mathematical equation: $\[\mathrm{H}_{2}^{*}\]$](/articles/aa/full_html/2026/05/aa59012-26/aa59012-26-eq10.png) refers to vibrationally excited states (v ≥ 1). CLOUDY defines
refers to vibrationally excited states (v ≥ 1). CLOUDY defines ![Mathematical equation: $\[\mathrm{H}_{2}^{*}\]$](/articles/aa/full_html/2026/05/aa59012-26/aa59012-26-eq11.png) as all levels in the X electronic state with an energy greater than 4100 cm−1. In practice, we assumed that H2 corresponds to the first 7 ro-vibrational pure rotational levels (v = 0, J = 0 → 6), whose energies are significantly below the endothermicity
as all levels in the X electronic state with an energy greater than 4100 cm−1. In practice, we assumed that H2 corresponds to the first 7 ro-vibrational pure rotational levels (v = 0, J = 0 → 6), whose energies are significantly below the endothermicity ![Mathematical equation: $\[\Delta H_{0}^{\mathrm{o}}=4620 \mathrm{~K}\]$](/articles/aa/full_html/2026/05/aa59012-26/aa59012-26-eq12.png) of the reaction C+(2P) + H2(1Σ+) → CH+ (X1Σ+) + H(2S) (Hierl et al. 1997). Higher levels were attributed to
of the reaction C+(2P) + H2(1Σ+) → CH+ (X1Σ+) + H(2S) (Hierl et al. 1997). Higher levels were attributed to ![Mathematical equation: $\[\mathrm{H}_{2}^{*}\]$](/articles/aa/full_html/2026/05/aa59012-26/aa59012-26-eq13.png) , that is, the form of molecular hydrogen which is reactive with C+(2P). A uniform excitation temperature of 1900 K was adopted for all levels of molecular hydrogen, which was found to reproduce the rotational diagram for the observed transitions of H2 fairly well (Neufeld et al. 2021). The state-to-state rate coefficients of González-Lezana et al. (2026) (see Appendix B) were finally employed to derive the rate coefficients for H2 and
, that is, the form of molecular hydrogen which is reactive with C+(2P). A uniform excitation temperature of 1900 K was adopted for all levels of molecular hydrogen, which was found to reproduce the rotational diagram for the observed transitions of H2 fairly well (Neufeld et al. 2021). The state-to-state rate coefficients of González-Lezana et al. (2026) (see Appendix B) were finally employed to derive the rate coefficients for H2 and ![Mathematical equation: $\[\mathrm{H}_{2}^{*}\]$](/articles/aa/full_html/2026/05/aa59012-26/aa59012-26-eq14.png) listed in Table A.1. For the photoionization of CH (reaction R2), we employed the AV-dependent rate coefficient from Heays et al. (2017) with two different product channels as recommended by KIDA2. For the dissociative recombination (DR) of CH+ (reaction R3), the rate coefficient measured by Paul et al. (2022) for the ground state of CH+ (v = 0, J = 0) was used. It should be very similar to the thermal rate coefficient given the weak J-specific dependence of the DR process (see Appendix B). For the reaction of CH+ with H (reaction R4), we employed the thermal time-independent quantum mechanical (TIQM) rate coefficient computed by Faure et al. (2017), which agrees well with available experimental measurements above 50 K (see Appendix B). For the reaction of CH+ with H2 (reaction R5), the default CLOUDY value was employed, as recommended by KIDA and UMIST3. Finally, for the photodissociation of CH+ (reaction R6), the AV-dependent rate coefficient was taken from Heays et al. (2017). For the reactions R1, R3, and R4, the rate coefficients were fitted using a standard modified-Arrhenius equation. We note that our fits are reliable over the kinetic temperature ranges 100 − 3000 K for reaction R1, 10 − 10 000 K for reaction R3, and 10 − 3000 K for reaction R4, and they should be accurate to within ~20%. We further point out that Paper I contains a typographical error in the thermal rate coefficient for reaction R1 between He+ and H; the corrected form is noted here in Table A.1.
listed in Table A.1. For the photoionization of CH (reaction R2), we employed the AV-dependent rate coefficient from Heays et al. (2017) with two different product channels as recommended by KIDA2. For the dissociative recombination (DR) of CH+ (reaction R3), the rate coefficient measured by Paul et al. (2022) for the ground state of CH+ (v = 0, J = 0) was used. It should be very similar to the thermal rate coefficient given the weak J-specific dependence of the DR process (see Appendix B). For the reaction of CH+ with H (reaction R4), we employed the thermal time-independent quantum mechanical (TIQM) rate coefficient computed by Faure et al. (2017), which agrees well with available experimental measurements above 50 K (see Appendix B). For the reaction of CH+ with H2 (reaction R5), the default CLOUDY value was employed, as recommended by KIDA and UMIST3. Finally, for the photodissociation of CH+ (reaction R6), the AV-dependent rate coefficient was taken from Heays et al. (2017). For the reactions R1, R3, and R4, the rate coefficients were fitted using a standard modified-Arrhenius equation. We note that our fits are reliable over the kinetic temperature ranges 100 − 3000 K for reaction R1, 10 − 10 000 K for reaction R3, and 10 − 3000 K for reaction R4, and they should be accurate to within ~20%. We further point out that Paper I contains a typographical error in the thermal rate coefficient for reaction R1 between He+ and H; the corrected form is noted here in Table A.1.
Rate coefficient of dominant formation and destruction reactions of CH+ adopted in the CLOUDY chemical model.
Appendix B New CH+ ro-vibrational data for reactive collisions
This dataset was employed in the RADEX/MCMC calculations (see Sect. 2.3).
B.1 Hydrogenation of C+(2P)
For the reaction of C+(2P) with H2(v, J), which produces CH+(v′, J′) + H, we employed the extensive set of rate coefficients computed recently by González-Lezana et al. (2026) using the statistical quantum method (SQM). The use of statistical methods is justified for this system because the intermediate complex CH2+ forms a deep potential well (Konings et al. 2021; González-Lezana et al. 2026). The SQM calculations were performed for the first 31 levels of H2 (up to (v, J) = (1, 10) at 14 223 K above the ground state) and for the first 42 levels of CH+ (up to (v′, J′) = (2, 5) at 8275 K above the ground state). They were compared to results obtained with a different statistical approach (Konings et al. 2021) and to the results of Faure et al. (2017), based on the more accurate but expensive time-dependent wave-packet (TDWP) method, and a good agreement (within a factor of 2) was observed at the state-to-state level. This is illustrated in Fig. B.1 where we have plotted the occupation probability of CH+ following the reaction of C+(2P) with the excited state of H2 (v′, J′) = (2, 0) at Tkin = 1000 K4. We note that a good agreement was also observed between the SQM calculations and experiments performed with H2 (v = 0, 1) at different temperatures, see e.g., Fig. 1 of González-Lezana et al. (2026). The full set of SQM rate coefficients includes 1194 state-to-state transitions and covers the kinetic temperature range from 30 to 3000 K. We note that the original reactive rate coefficients of González-Lezana et al. (2026) are limited to the temperature range 30 − 1500 K to ensure full convergence. They were extended here up to 3000 K to better cover the physical conditions of NCG 7027, with limited impact on accuracy (see González-Lezana et al. 2026).
In order to cover all 80 CH+ levels in its ground electronic state X1Σ+, we have also extrapolated the data of González-Lezana et al. (2026) (that is, above (v′, J′) = (2, 5)) using a simple formulation similar to that of Neufeld et al. (2021) (see their Appendix B.2), where a formation temperature is introduced additionally. The (normalized) probability p(v′, J′) of forming CH+ in a level (v′, J′) is defined as:
![Mathematical equation: $\[p\left(v^{\prime}, J^{\prime}\right)= \begin{cases}\frac{(2 J+1) \exp \left(-E / T_{\text {form }}\right)}{\sum(2 J+1) \exp \left(-E / T_{\text {form }}\right)} & \text { if } E<0 \\ \frac{(2 J+1) \exp \left(-E / T_{\text {kin }}\right)}{\sum(2 J+1) \exp \left(-E / T_{\text {kin }}\right)} & \text { if } E \geq 0,\end{cases}\]$](/articles/aa/full_html/2026/05/aa59012-26/aa59012-26-eq17.png) (B.1)
(B.1)
where ![Mathematical equation: $\[E=\Delta H_{0}^{\mathrm{o}}+E_{\mathrm{CH}^{+}}\left(\boldsymbol{v}^{\prime}, J^{\prime}\right)-E_{\mathrm{H}_{2}}(\boldsymbol{v}, J)\]$](/articles/aa/full_html/2026/05/aa59012-26/aa59012-26-eq18.png) is the activation energy, including the reaction endothermicity
is the activation energy, including the reaction endothermicity ![Mathematical equation: $\[\Delta H_{0}^{\mathrm{o}}=4620 \mathrm{~K}\]$](/articles/aa/full_html/2026/05/aa59012-26/aa59012-26-eq19.png) (Hierl et al. 1997) and ECH+(v′, J′) and EH2(v, J) are the ro-vibrational energies of CH+ and H2, respectively. The formation temperature Tform was taken as
(Hierl et al. 1997) and ECH+(v′, J′) and EH2(v, J) are the ro-vibrational energies of CH+ and H2, respectively. The formation temperature Tform was taken as ![Mathematical equation: $\[2 / 3 \times\left(E_{\mathrm{H}_{2}}(v, J)-\Delta H_{0}^{\mathrm{o}}\right)\]$](/articles/aa/full_html/2026/05/aa59012-26/aa59012-26-eq20.png) , as observed and recommended by Faure et al. (2017). We note that in the measurements of the deuterated variants of the H2 +
, as observed and recommended by Faure et al. (2017). We note that in the measurements of the deuterated variants of the H2 + ![Mathematical equation: $\[\mathrm{{H}}_{2}^{+}\]$](/articles/aa/full_html/2026/05/aa59012-26/aa59012-26-eq21.png) reaction, about two-thirds of the reaction exothermicity was also found in the internal ro-vibrational energies of the (triatomic) product ions (Merkt et al. 2022, although their population does not necessarily follow a Boltzmann distribution). As can be seen in Fig. B.1, the above extrapolation scheme (Extrap) reproduces the SQM probabilities to within a factor of 2 for the first 42 levels of CH+.
reaction, about two-thirds of the reaction exothermicity was also found in the internal ro-vibrational energies of the (triatomic) product ions (Merkt et al. 2022, although their population does not necessarily follow a Boltzmann distribution). As can be seen in Fig. B.1, the above extrapolation scheme (Extrap) reproduces the SQM probabilities to within a factor of 2 for the first 42 levels of CH+.
B.2 Dissociative recombination of CH+ with electrons
For the DR of CH+ (v, J) with electrons, we have computed new cross sections using the theoretical treatment of Forer et al. (2024) combining the R-matrix method with the multichannel quantum defect theory (MQDT), adopting here a partial wave basis l = 0 − 4 and electron energies up to 1 eV. Rate coefficients were obtained for the CH+ levels (v = 0, J = 0 − 11) and (v = 1, J = 0 − 11). As in Forer et al. (2024), these rate coefficients could be compared to state-resolved measurements made at the Cryogenic Storage Ring (CSR) by Paul et al. (2022). These authors were able to determine the J-specific rate coefficient for the levels J = 0, 1 of CH+ in its ground electronic and vibrational state, and for kinetic temperatures between 10 and 40 000 K. Our new DR rate coefficients for v = 0, J = 0–1 agree with those of Paul et al. (2022) to within a factor of ~2–3 in the range 10–3000 K, as illustrated in Fig. B.2 for J = 0. We can also observe that the rotational effects are weak, with J-specific DR rate coefficients for CH+(v = 0) differing by less than a factor of 3 at 1000 K. Moreover, the DR rate coefficients of CH+(v = 1) are found to exceed those of CH+(v = 0) by a small factor (<3), and rotational effects are even less significant. In practice, the MQDT rate coefficients for CH+(v = 0, J = 11) were used for all levels (v = 0, J > 11) and the rate coefficients for (v = 1, J = 11) were employed for all levels (v = 1, J > 11) and (v > 1, J). We thus selected only theoretical DR rate coefficients, rather than the experimental ones for (v = 0, J = 0–1), to ensure consistency among the (v, J)-specific DR rate coefficients and with the excitation rate coefficients described below.
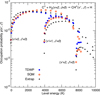 |
Fig. B.1 Occupation probability of the nascent CH+ product from the reaction of C+(2P) with H2 in the ro-vibrationally excited state (v, J) = (2, 0) as function of the CH+(v′, J′) level energy and at a kinetic temperature Tkin = 1000 K. The SQM calculations of González-Lezana et al. (2026) are compared to the TDWP results of Faure et al. (2017) and to the simple extrapolation scheme (Extrap) defined by Eq. B.1. See text for details. The rotational ground states in the rotational manifold of v′ = 0, 1, 2 are labeled for clarity. |
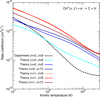 |
Fig. B.2 State-selected DR rate coefficients of CH+(v, J). The present MQDT calculations are denoted by colored solid lines. The thick black dashed line gives the experimental rate coefficients from Paul et al. (2022) for J = 0. |
B.3 The reaction of CH+ with H atoms
For the reaction of CH+ with H (which produces C+(2P) + H2), we used TIQM calculations of Faure et al. (2017) for CH+ in levels (v = 0, J = 13) and the SQM calculations of González-Lezana et al. (2026) for higher levels up to (v = 2, J = 5), consistent with the calculations described above for the reverse reaction between C+(2P) and H2. As for this latter reaction, this set of state-resolved rate coefficients (summed over the final ro-vibrational states of H2) was found to be in good agreement with the more accurate TIQM calculations of Faure et al. (2017), typically within a factor of 2. The SQM thermal rate coefficient thus matches well with the thermal TIQM value and also with various measurements, except below ~ 50 K where a strong decrease of the rate coefficient was observed in the ion-trap experiment of Plasil et al. (2011). This surprising result was interpreted by these authors as a dramatic loss of reactivity of rotationally cold CH+ ions at very low temperatures. As recently discussed by del Mazo-Sevillano et al. (2025), the vibrational excitation of CH+ strongly reduces reactivity at low temperatures, so that vibrational thermalization was perhaps not fully achieved in the ion-trap experiment (see Fig. 9 of del Mazo-Sevillano et al. 2025). A similar result was observed by González-Lezana et al. (2026). For levels not included in the SQM set of González-Lezana et al. (2026), that is, for levels above CH+(v = 2, J = 5), we used an average temperature-independent rate coefficient of 4 × 10⁻¹⁰ cm3 s−1. We note that rotational and vibrational effects are weak for kinetic temperatures above ~500 K, with ro-vibrational rate coefficients lying in the range (4–5) × 10−10 cm3 s−1. This range is ~ 2 − 3 orders of magnitude lower than the above DR rate coefficients so that hydrogen atoms will dominate the destruction of CH+ in regions where n(e)/n(H) < 2 × 10⁻³.
Appendix C New CH+ ro-vibrational data for inelastic collisions
This dataset was employed in the CLOUDY and RADEX calculations (see Sect. 2.1.3 and 2.2).
C.1 Electron collisions
For inelastic collisions of CH+(v, J) with electrons, new cross sections were computed using the theoretical treatment of Forer et al. (2024), adopting a partial wave basis l = 0 − 4 and electron energies up to 1 eV, as for DR. Pure rotational and ro-vibrational rate coefficients were obtained for the CH+ levels (v = 0, J = 0 − 11) and (v = 1, J = 0 − 11) − all calculated as described by Forer et al. (2024). This method includes the lowest two electronically excited states of the ion, which produce low-energy resonances in the scattering phases of the ground electronic state and can significantly increase the vibrational coupling between different vibrational levels. For transitions with ΔJ = ±1, the limited partial-wave basis of the scattering calculations is corrected via Born closure with the Coulomb-Born (CB) approximation, as in Hamilton et al. (2016). The CB approximation accounts for the larger partial waves that are omitted in the R-matrix scattering basis; these are important due to strong dipole-induced coupling between partial waves that satisfy Δl = ±1. The CB approximation is known to be reliable for strongly dipolar ions like CH+ (1.68 D), but does not include resonances in the scattering phases and, therefore, is only used to supplement the limited partial-wave basis of the R-matrix calculations. In fact, the CB approximation on its own was found to underestimate the ro-vibrational rate coefficients by three orders of magnitude overall.
As in Forer et al. (2024), our pure rotational rate coefficients could be compared to state-selected measurements made at the CSR by Kálosi et al. (2022). These authors were able to evaluate the rate coefficients for the excitation J = 0 → J = 1 of CH+ in its ground electronic and vibrational state, for kinetic temperatures up to 200 K. Our new excitation rate coefficients agree with those of Kálosi et al. (2022) to within 50% across the 10 − 200 K temperature, as illustrated in Fig. C.1, which is consistent with the experimental one-sigma uncertainty. We can also observe that the dominant transitions are those with ΔJ = 1, 2 for rotational excitation and ΔJ= 0, 1, 2 for ro-vibrational excitation. Another important result is that ro-vibrational excitation is dominated by transitions with Δv = 1 (see Fig. 2 of Forer et al. 2024) and that the corresponding rate coefficients do not significantly depend on the initial state v, especially above 100 K. As a result, the pure rotational rate coefficients for de-excitations ΔJ = −1, −2 of CH+(v = 0, J = 11) and (v = 1, J = 11) were used for all levels (v = 0, J > 11), (v = 1, J > 11) and (v ≥ 1, J), respectively. Similarly, the ro-vibrational rate coefficients for (de-)excitations Δv = −1; ΔJ = 0, ±1, ±2 of CH+(v = 1, J = 9) were used for all levels (v = 1, J > 11) and (v > 1, J). The full set of CH+ + e− inelastic rate coefficients is available for temperatures between 10 and 3000 K.
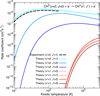 |
Fig. C.1 State-to-state excitation rate coefficients from the ground state of CH+(v = 0, J = 0) to the lowest three and four rotational and ro-vibrational excited states (v′, J′), respectively. The present MQDT calculations (CB corrected) are denoted by colored solid lines. The thick black dashed line gives the experimental rate coefficients from Kálosi et al. (2022) for v′ = 0, J′ = 1. |
C.2 Collision with hydrogen atoms
For inelastic collisions of CH+(v, J) with hydrogen atoms, we used the TIQM calculations of Faure et al. (2017) for CH+(v = 0, J = 0 − 13) and the SQM rate coefficients computed by González-Lezana et al. (2026) for levels above (v = 2, J = 5), consistent with the calculations used for the CH+ + H reactive channel described above. We note that since CH+ + H has a statistical behavior (González-Lezana et al. 2026, and references therein), inelastic collisional propensity rules are different from non-statistical systems like, e.g., HeH+ (Paper I, and references therein). In particular, for a specific initial ro-vibrational state (v, J), the ro-vibrational rate coefficients for a transition (v, J) → (v′, J′) do not depend on v′ but only on J′. Thus, for levels higher than (v = 2, J = 5), we extrapolated the data of González-Lezana et al. (2026) by applying a temperature-independent de-excitation rate coefficients of 5 × 10⁻¹¹ cm3 s−1 for all rotational and ro-vibrational transitions with |ΔJ| ≤ 5. This crude prescription should be accurate to within a factor of 5 − 10. We note that the rate coefficients for the rotational (ro-vibrational) excitation of CH+ due to H collisions are typically four (three) orders of magnitude smaller than those due to electron collisions, meaning that hydrogen atoms will dominate the CH+ excitation if n(e)/n(H) < 10−4. The full set of CH+ + H inelastic rate coefficients is available for temperatures between 30 and 3000 K. We note that the original inelastic rate coefficients of González-Lezana et al. (2026) are limited to the temperature range 30 − 1500 K to ensure full convergence. They were extended here up to 3000 K to better cover the physical conditions of NCG 7027, with limited impact on accuracy (see González-Lezana et al. 2026).
Appendix D Emissivity profiles of CH+ and H2
Figures D.1 and D.2 display the intrinsic line emissivities of CH+ and H2, respectively, as a function of the distance from the star.
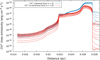 |
Fig. D.1 Emissivity profile of CH+ pure rotational lines and ro-vibrational lines as a function of distance. |
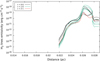 |
Fig. D.2 Emissivity profile of the observed H2 lines as a function of distance. |
Appendix E RADEX/MCMC fitting results
The corner diagram resulting from the RADEX/MCMC analysis of CH+ line fluxes is presented in Fig. E.1.
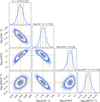 |
Fig. E.1 Corner plot obtained from the RADEX/MCMC exploration for CH+, taking into account all detected rotational and ro-vibrational transitions. The diagonal panels show the marginalized posterior probability distributions of Tkin (linear scale), n(e−), n(H), and N(CH+) (log10 scale), while the off-diagonal panels display the corresponding pair-wise correlations. The orange lines and markers indicate the maximum posterior estimate, and the vertical dashed lines in each diagonal panel mark the 16th and 84th percentiles (i.e., the 1σ credible intervals). The contours in the 2D panels enclose 39.3% and 86.4% of the posterior probability, corresponding to the 1σ and 2σ confidence regions for a two-dimensional Gaussian distribution. |
Appendix F CH+ line surface brightness prediction
The surface brightness values of the strongest CH+ ro-vibrational transitions in the presence and absence of chemical pumping are noted in Table F.1. The values are predicted by RADEX considering the physical condition at the ro-vibrational emission peak and CH+ total column density obtained from the CLOUDY model noted in Table 3. A line width (FWHM) of 30 km s−1 and the incident radiative continuum at the illuminated face of the cloud, obtained from the CLOUDY model, were used as the background radiation field.
All Tables
Physical parameters at CH+ abundance peak and the total CH+ column density obtained from the CLOUDY model.
Rate coefficient of dominant formation and destruction reactions of CH+ adopted in the CLOUDY chemical model.
All Figures
|
Fig. 1 Top panel: equilibrium temperature and densities of H, H+, H2, |
| In the text | |
|
Fig. 2 Ratios of different model-predicted to observed line fluxes (Fpre/Fobs) of rotational and ro-vibrational lines of CH+ as functions of the line names. |
| In the text | |
|
Fig. 3 Ratios of CLOUDY model-predicted to observed line fluxes (Fpre/Fobs) of rotational and ro-vibrational lines of H2 as a function of the upper level energies of transitions. |
| In the text | |
|
Fig. 4 Ro-vibrational population diagram of CH+ (v, J) as predicted by RADEX considering the physical condition at ro-vibrational emission peak from the CLOUDY model noted in Table 3. |
| In the text | |
|
Fig. 5 CH+ line surface brightness variation with wavelength as predicted by RADEX considering the physical condition at ro-vibrational emission peak from the CLOUDY model noted in Table 3. The left panel shows this without chemical pumping, and the right panel considers chemical pumping. Upper panel: full spectrum in the wavelength range 0–200 μm. Lower panel: most intense ro-vibrational line spectrum in the wavelength range 3–5.5 μm. |
| In the text | |
|
Fig. B.1 Occupation probability of the nascent CH+ product from the reaction of C+(2P) with H2 in the ro-vibrationally excited state (v, J) = (2, 0) as function of the CH+(v′, J′) level energy and at a kinetic temperature Tkin = 1000 K. The SQM calculations of González-Lezana et al. (2026) are compared to the TDWP results of Faure et al. (2017) and to the simple extrapolation scheme (Extrap) defined by Eq. B.1. See text for details. The rotational ground states in the rotational manifold of v′ = 0, 1, 2 are labeled for clarity. |
| In the text | |
|
Fig. B.2 State-selected DR rate coefficients of CH+(v, J). The present MQDT calculations are denoted by colored solid lines. The thick black dashed line gives the experimental rate coefficients from Paul et al. (2022) for J = 0. |
| In the text | |
|
Fig. C.1 State-to-state excitation rate coefficients from the ground state of CH+(v = 0, J = 0) to the lowest three and four rotational and ro-vibrational excited states (v′, J′), respectively. The present MQDT calculations (CB corrected) are denoted by colored solid lines. The thick black dashed line gives the experimental rate coefficients from Kálosi et al. (2022) for v′ = 0, J′ = 1. |
| In the text | |
|
Fig. D.1 Emissivity profile of CH+ pure rotational lines and ro-vibrational lines as a function of distance. |
| In the text | |
|
Fig. D.2 Emissivity profile of the observed H2 lines as a function of distance. |
| In the text | |
|
Fig. E.1 Corner plot obtained from the RADEX/MCMC exploration for CH+, taking into account all detected rotational and ro-vibrational transitions. The diagonal panels show the marginalized posterior probability distributions of Tkin (linear scale), n(e−), n(H), and N(CH+) (log10 scale), while the off-diagonal panels display the corresponding pair-wise correlations. The orange lines and markers indicate the maximum posterior estimate, and the vertical dashed lines in each diagonal panel mark the 16th and 84th percentiles (i.e., the 1σ credible intervals). The contours in the 2D panels enclose 39.3% and 86.4% of the posterior probability, corresponding to the 1σ and 2σ confidence regions for a two-dimensional Gaussian distribution. |
| In the text | |
Current usage metrics show cumulative count of Article Views (full-text article views including HTML views, PDF and ePub downloads, according to the available data) and Abstracts Views on Vision4Press platform.
Data correspond to usage on the plateform after 2015. The current usage metrics is available 48-96 hours after online publication and is updated daily on week days.
Initial download of the metrics may take a while.