Open Access
Fig. 5
Download original image
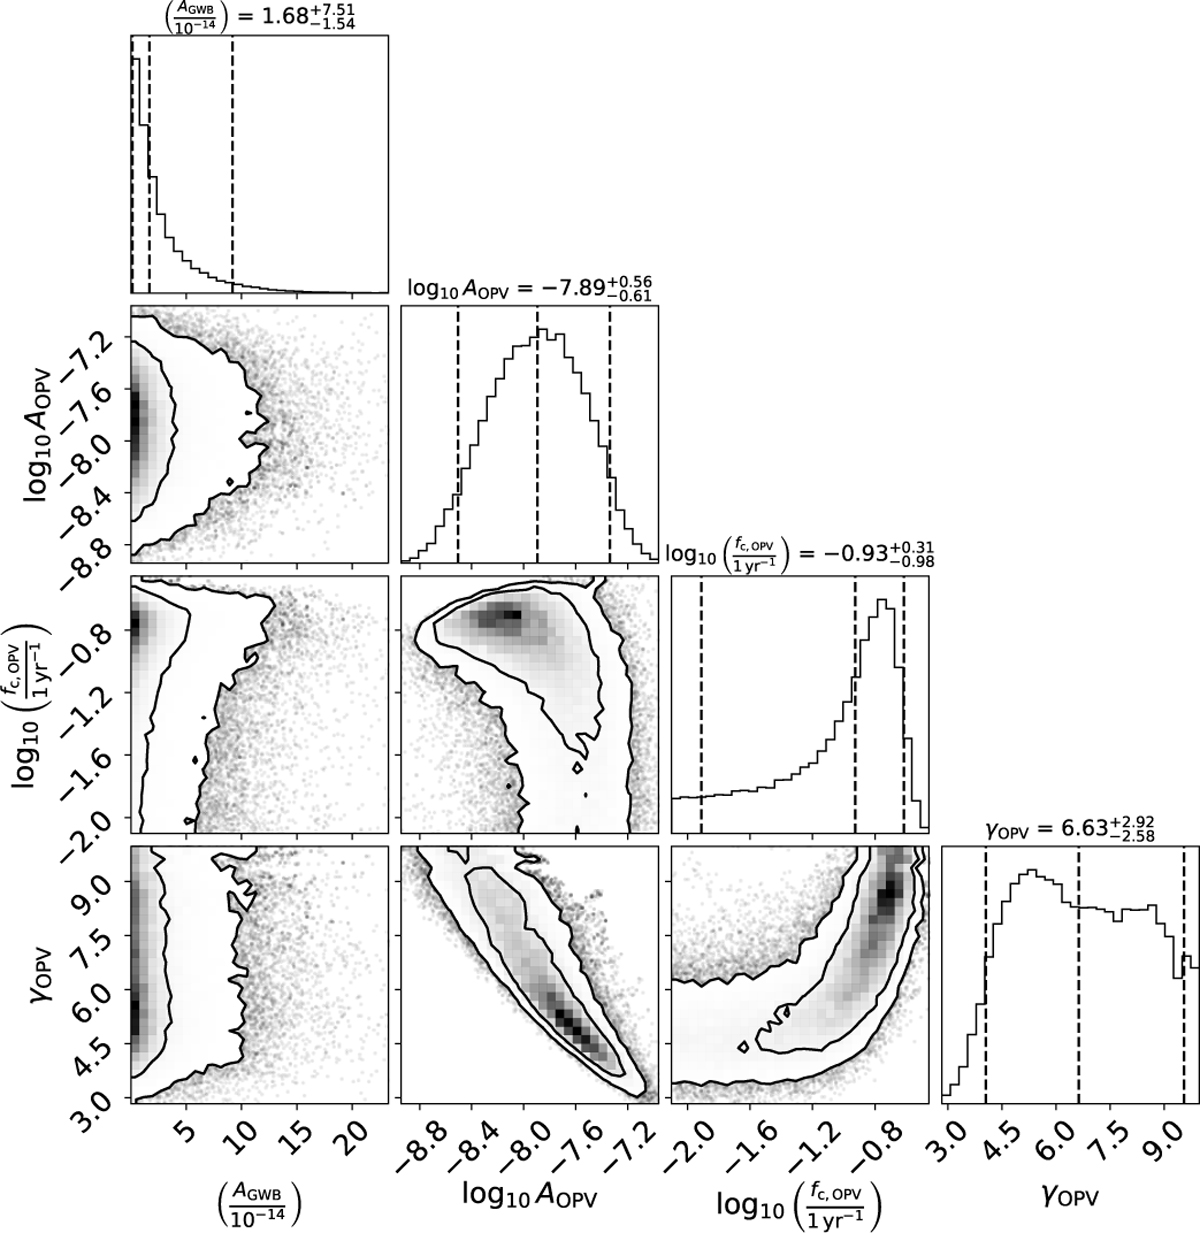
Posterior distribution for the GWB and OPV hyperparameters for PSR B1957+20. Contours on the 2D distributions are at the 1σ and 2σ levels, while dashed vertical lines on the 1D marginal distributions indicate the 5%, 50%, and 95% quantiles.
Current usage metrics show cumulative count of Article Views (full-text article views including HTML views, PDF and ePub downloads, according to the available data) and Abstracts Views on Vision4Press platform.
Data correspond to usage on the plateform after 2015. The current usage metrics is available 48-96 hours after online publication and is updated daily on week days.
Initial download of the metrics may take a while.