Fig. 4
Download original image
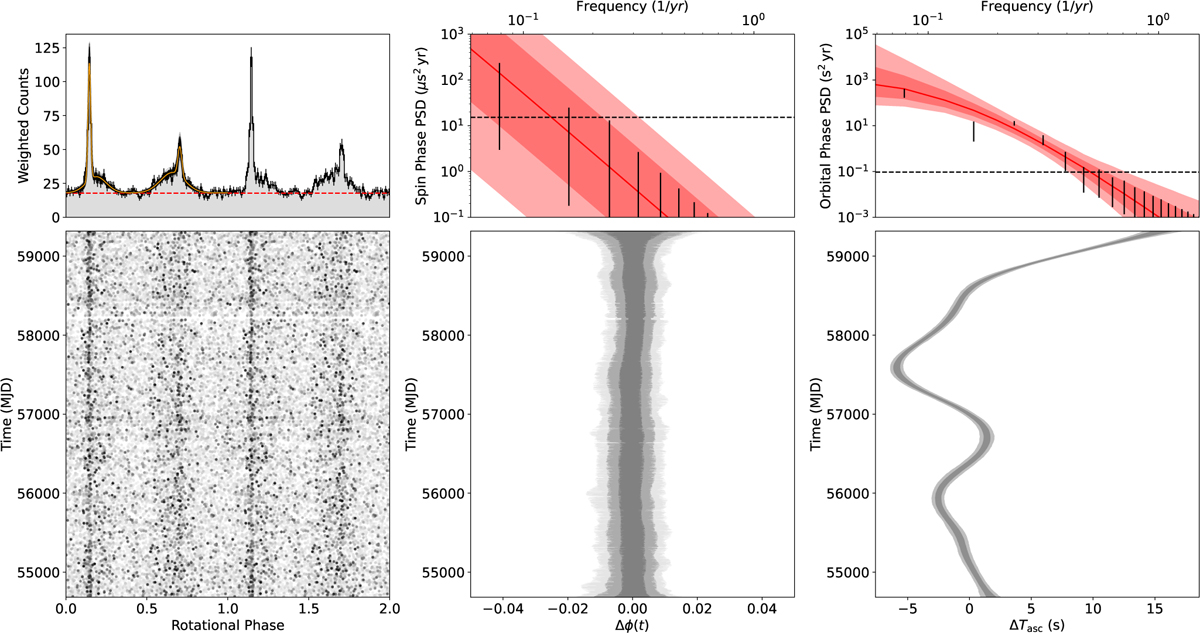
Results of Gibbs-sampling analysis of PSR B1957+20. Left panels show the photon phases (bottom) and integrated pulse profile (top) according to the best-fitting timing model. Faint black curves on the pulse profile plot show individual posterior samples for the template pulse profile, with the best-fitting model shown in orange. Middle panels illustrate the posterior uncertainty on the photon phases (bottom), and on the PSD of the GWB-like timing noise component that we searched for (top). The dashed black line shows the estimated white-noise level, while the red shaded regions show the 1σ and 2σ constraints on a putative power-law noise component with spectral index γ = 13/3. Black lines show the posterior uncertainties on the individual Fourier powers; no significant power is detected above the white noise level at any frequency, and so these posteriors all closely follow the priors. Right panels show the same, but for orbital phase noise, in which a steep spectrum process is detected.
Current usage metrics show cumulative count of Article Views (full-text article views including HTML views, PDF and ePub downloads, according to the available data) and Abstracts Views on Vision4Press platform.
Data correspond to usage on the plateform after 2015. The current usage metrics is available 48-96 hours after online publication and is updated daily on week days.
Initial download of the metrics may take a while.