Fig. 7
Download original image
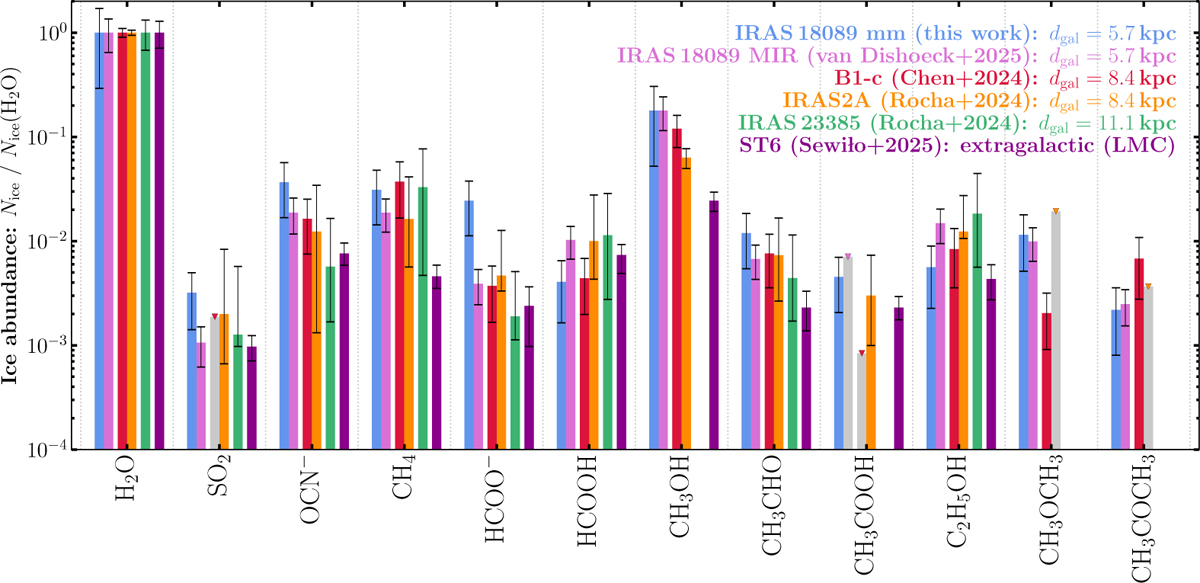
Comparison of ice abundances (relative to H2O) toward low- and highmass protostars. The abundances toward the IRAS 18089 mm analyzed in this work is shown in blue. The results for the low-mass protostars B1-c (red) and IRAS 2A (orange) were taken from Chen et al. (2024). The high-mass protostar IRAS 23385 (green) and MIR peak of IRAS 18089 (pink) were analyzed in Rocha et al. (2024) and van Dishoeck et al. (2025), respectively. The ST6 source located in the LMC was studied by Sewiło et al. (2025) and is shown in purple. Upper limits are indicated by gray bars and triangle data points.
Current usage metrics show cumulative count of Article Views (full-text article views including HTML views, PDF and ePub downloads, according to the available data) and Abstracts Views on Vision4Press platform.
Data correspond to usage on the plateform after 2015. The current usage metrics is available 48-96 hours after online publication and is updated daily on week days.
Initial download of the metrics may take a while.