Fig. 6
Download original image
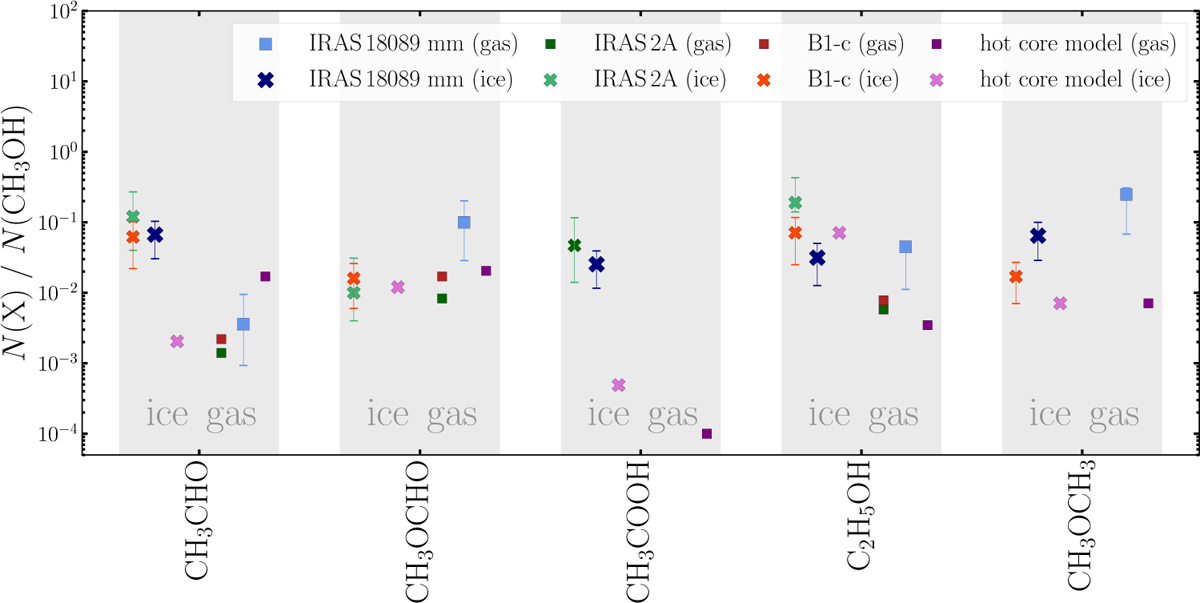
Comparison of ice and gas phase abundances (relative to CH3OH) toward low- and high-mass hot cores. The crosses and squares mark ice and gas phase abundances, respectively. Blue, green, and red data points are IRAS 18089 mm (this work), IRAS 2A (Chen et al. 2024; Rocha et al. 2024), and B1-c (Chen et al. 2024). The pink data points are taken from the hot core model by Garrod et al. (2022) (the fast warm-up model at T=100 K; see their Fig. 10).
Current usage metrics show cumulative count of Article Views (full-text article views including HTML views, PDF and ePub downloads, according to the available data) and Abstracts Views on Vision4Press platform.
Data correspond to usage on the plateform after 2015. The current usage metrics is available 48-96 hours after online publication and is updated daily on week days.
Initial download of the metrics may take a while.