Fig. 3
Download original image
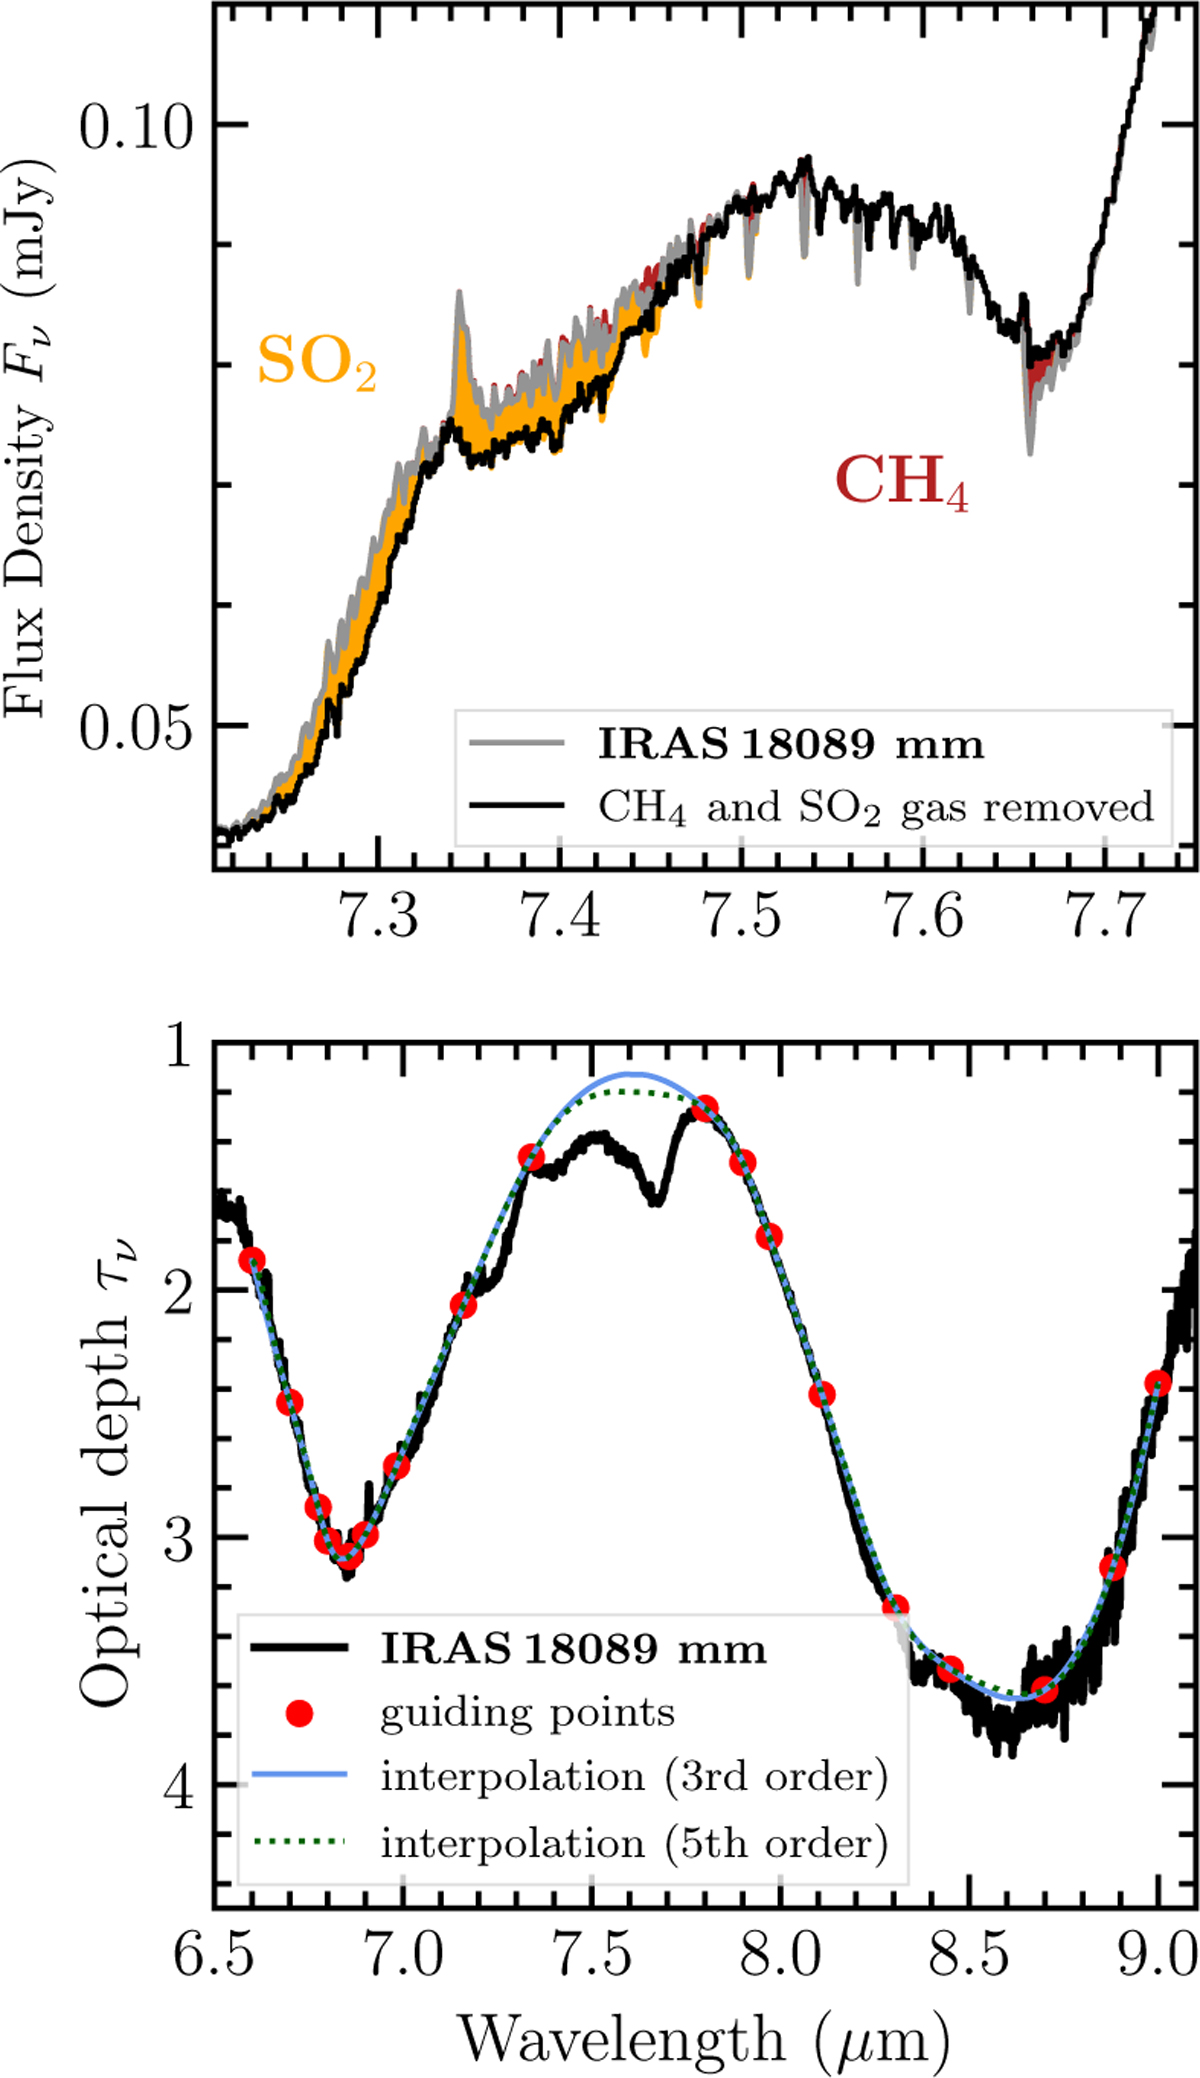
Removal of gas phase lines and local continuum estimate. Top: contribution of gas phase SO2 emission (yellow) and CH4 absorption (red) lines estimated from the observed IRAS 18089 mm spectrum (gray). The corrected spectrum is shown in black. Bottom: corrected optical depth spectrum (black) and the local continuum interpolation (blue line). The red dots mark the guiding points used for the interpolation. The green dashed line shows the continuum interpolation based on a fifth-order polynomial (see Appendix E).
Current usage metrics show cumulative count of Article Views (full-text article views including HTML views, PDF and ePub downloads, according to the available data) and Abstracts Views on Vision4Press platform.
Data correspond to usage on the plateform after 2015. The current usage metrics is available 48-96 hours after online publication and is updated daily on week days.
Initial download of the metrics may take a while.