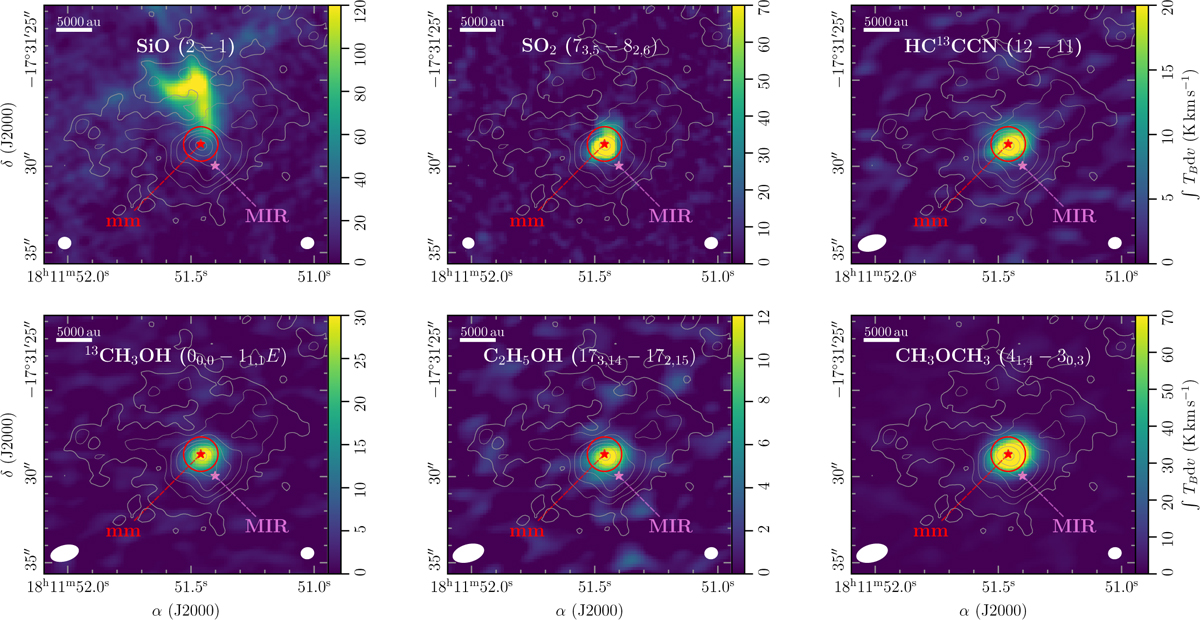
Fig. D.3
Download original image
Molecular line emission maps of IRAS 18089. In all panels the ALMA line-integrated intensity (vLSR ± 5 km s-1) is shown in color and the gray contours are the ALMA 3 mm continuum with steps from 5, 10, 20, 40, 80, 160, and 320×σcont. The mm and MIR continuum peak positions are labeled and highlighted in red and pink. The red circle shows the aperture (1″ radius) used for spectra extraction toward the 3 mm continuum peak. A scale bar in the top left panel marks a spatial scale of 5 000 au. The ellipse in the bottom left and bottom right corner highlights the angular resolution of the line and continuum data.
Current usage metrics show cumulative count of Article Views (full-text article views including HTML views, PDF and ePub downloads, according to the available data) and Abstracts Views on Vision4Press platform.
Data correspond to usage on the plateform after 2015. The current usage metrics is available 48-96 hours after online publication and is updated daily on week days.
Initial download of the metrics may take a while.