Open Access
Fig. 5.
Download original image
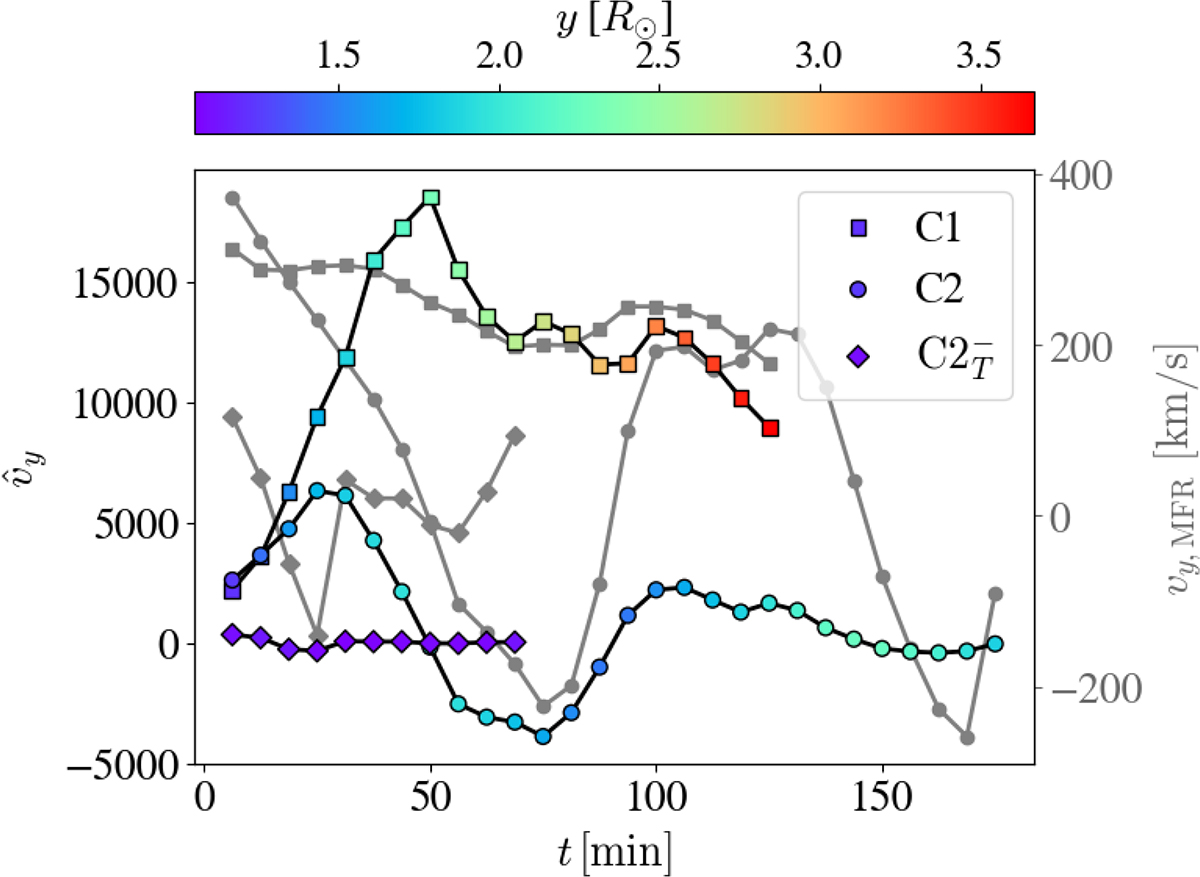
Left vertical axis: Evolution of the average vertical velocity inside the MFR, weighted by normalised area ![]() (black lines). Squares, circles, and diamonds represent cases C1, C2, and
(black lines). Squares, circles, and diamonds represent cases C1, C2, and ![]() , respectively. Symbol colours indicate the height of the MFR centre. Right vertical axis: MFR centre velocity values vy, MFR (grey lines).
, respectively. Symbol colours indicate the height of the MFR centre. Right vertical axis: MFR centre velocity values vy, MFR (grey lines).
Current usage metrics show cumulative count of Article Views (full-text article views including HTML views, PDF and ePub downloads, according to the available data) and Abstracts Views on Vision4Press platform.
Data correspond to usage on the plateform after 2015. The current usage metrics is available 48-96 hours after online publication and is updated daily on week days.
Initial download of the metrics may take a while.