Fig. 4.
Download original image
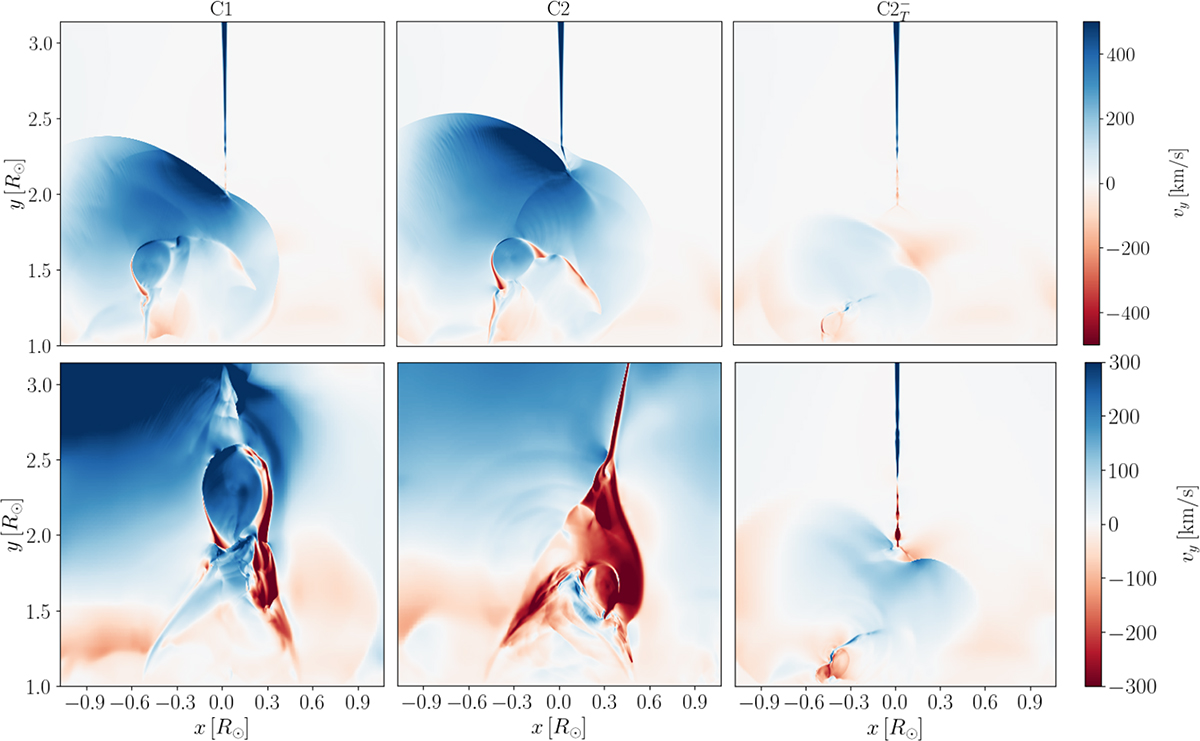
Plasma vertical velocity (vy) for the simulated cases, comparing a successful CME (C1, left), eroded CME (C2, middle), and collapsed CME (C2T−, right). Upper panels: Snapshots taken at a fixed time (t = 19 min). Bottom panels: Instances that maximise the contrast in the integrated bulk velocity of the MFR for each case (C1: t = 50 min, C2: t = 75 min, and C2T−: t = 25 min; see Fig. 5). In all panels, the heliospheric current sheet formed along the x = 0 position is visible at heights above y = 2 R⊙.
Current usage metrics show cumulative count of Article Views (full-text article views including HTML views, PDF and ePub downloads, according to the available data) and Abstracts Views on Vision4Press platform.
Data correspond to usage on the plateform after 2015. The current usage metrics is available 48-96 hours after online publication and is updated daily on week days.
Initial download of the metrics may take a while.