Open Access
Fig. 2.
Download original image
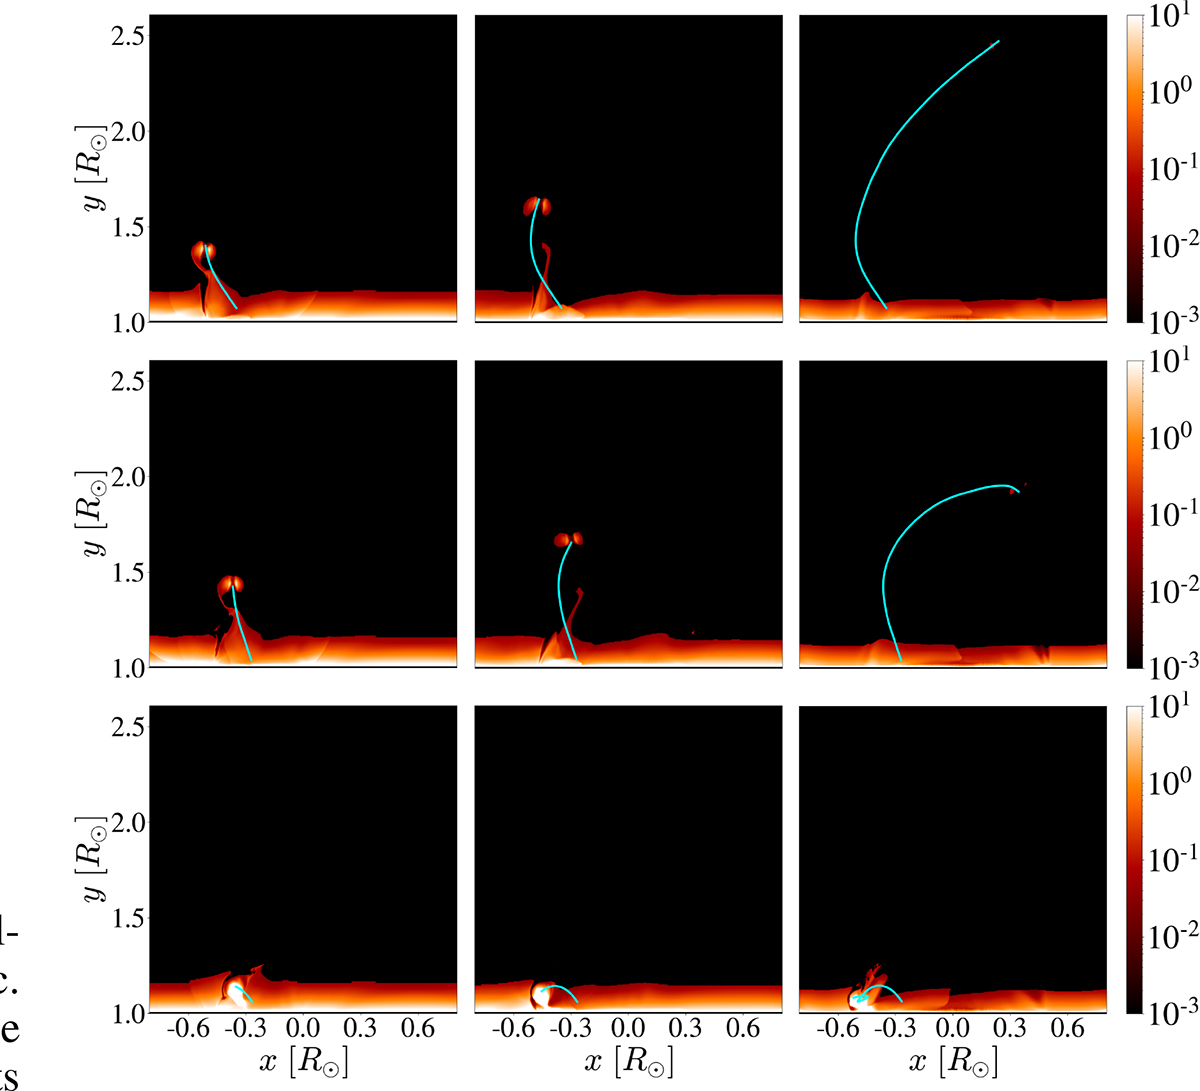
Synthetic 304 Å images showing the temporal evolution of cases C1 (first row), C2 (second row), and C2T− (third row) at times 13 min (first column), 22 min (second column) and 56 min (third column). The MFR trajectory is superimposed in cyan. Associated movies in 304 and 171 Å are available online.
Current usage metrics show cumulative count of Article Views (full-text article views including HTML views, PDF and ePub downloads, according to the available data) and Abstracts Views on Vision4Press platform.
Data correspond to usage on the plateform after 2015. The current usage metrics is available 48-96 hours after online publication and is updated daily on week days.
Initial download of the metrics may take a while.