Fig. 9
Download original image
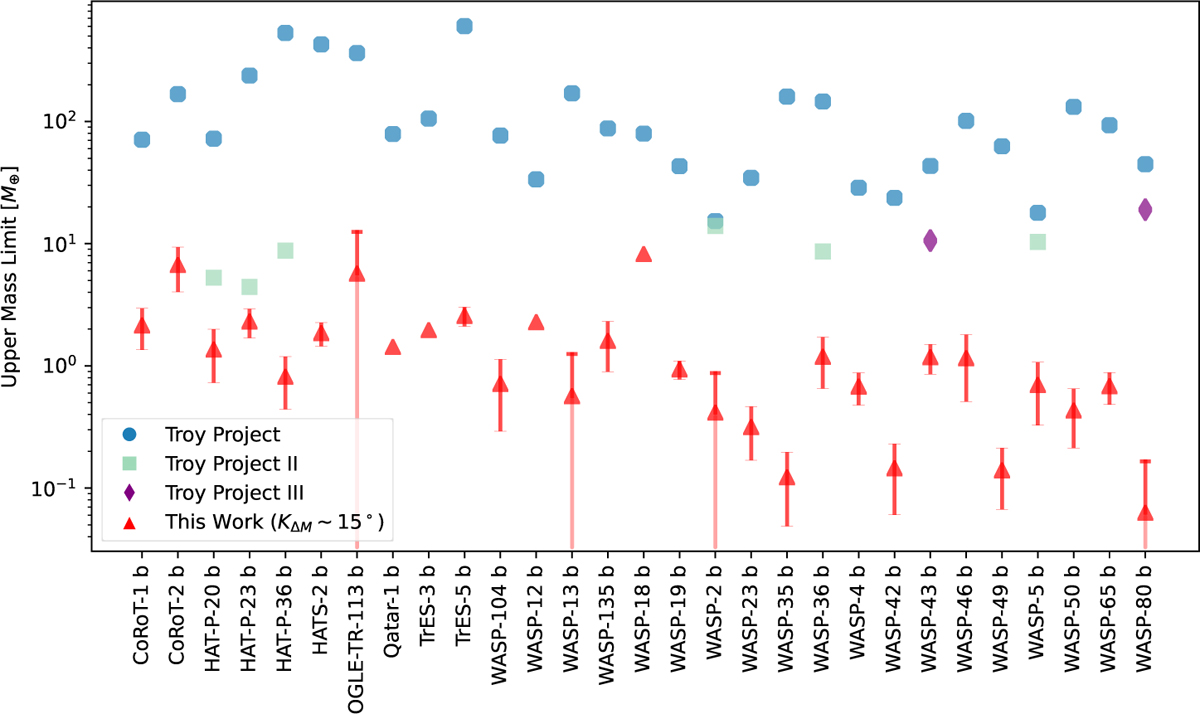
Upper mass limits of planets from TROY project I, II, III, and this work (ExoEcho). The x-axis displays planet names, and the y-axis presents mass limits on a logarithmic scale. The colors and markers distinguish each study. The red triangles represent our results assuming a libration amplitude of ∼15°. The error bars indicate the 1σ uncertainty, which is omitted when smaller than 15% of the mass limit for visual clarity. For systems where the lower 1σ boundary is unconstrained (i.e., consistent with zero mass), we represent the limit using a vertical line extending to the bottom of the axis.
Current usage metrics show cumulative count of Article Views (full-text article views including HTML views, PDF and ePub downloads, according to the available data) and Abstracts Views on Vision4Press platform.
Data correspond to usage on the plateform after 2015. The current usage metrics is available 48-96 hours after online publication and is updated daily on week days.
Initial download of the metrics may take a while.