Fig. 6
Download original image
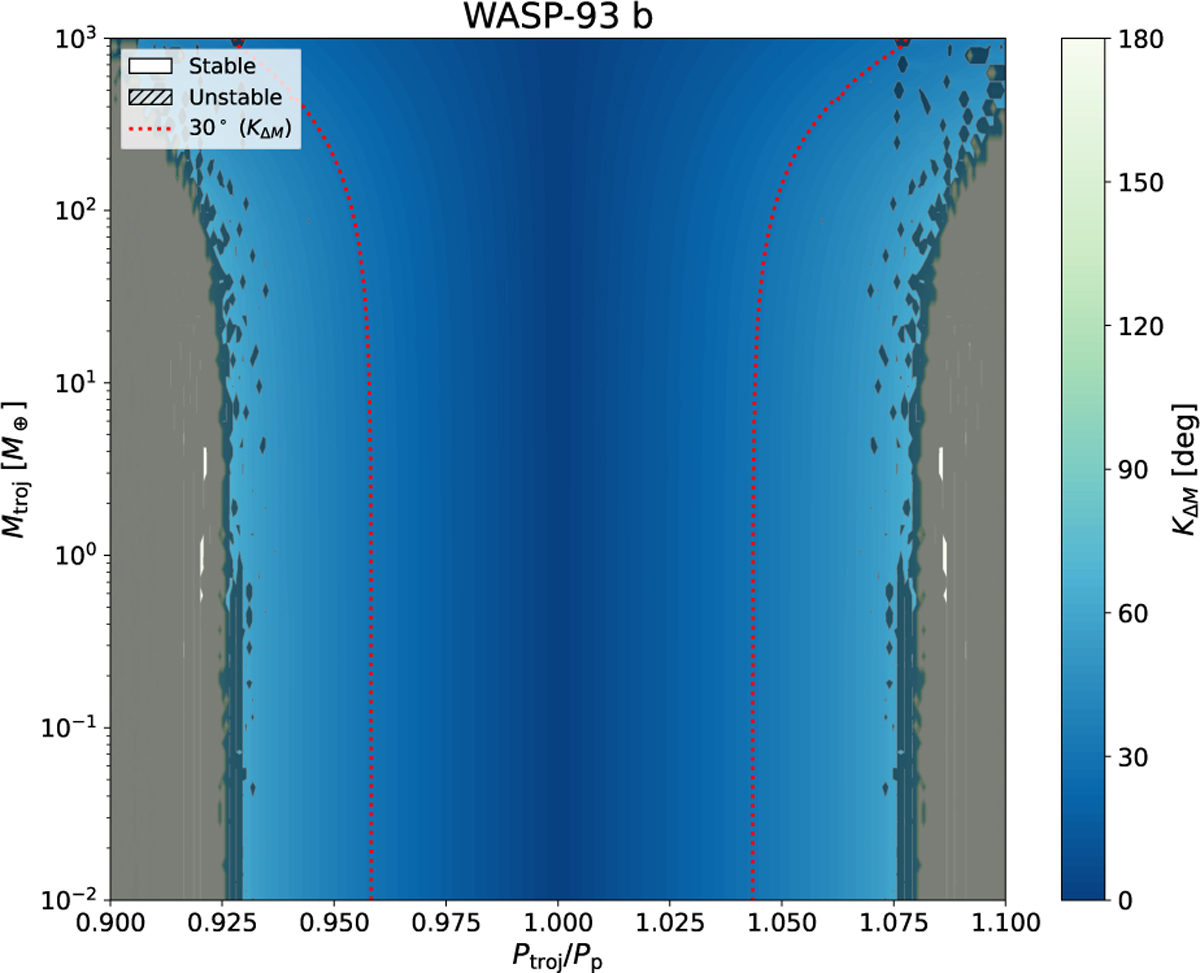
Stability and dynamics heatmap for WASP-93 b. The color scale and contours represent the libration amplitude corresponding to the initial period ratio and Trojan mass. The dashed red line marks the 30° libration contour, shown here as a practical reference line within the tadpole zone. Our conservative upper mass limits are strictly derived from the subset of configurations that remain dynamically stable according to the MEGNO mask.
Current usage metrics show cumulative count of Article Views (full-text article views including HTML views, PDF and ePub downloads, according to the available data) and Abstracts Views on Vision4Press platform.
Data correspond to usage on the plateform after 2015. The current usage metrics is available 48-96 hours after online publication and is updated daily on week days.
Initial download of the metrics may take a while.