Fig. 10
Download original image
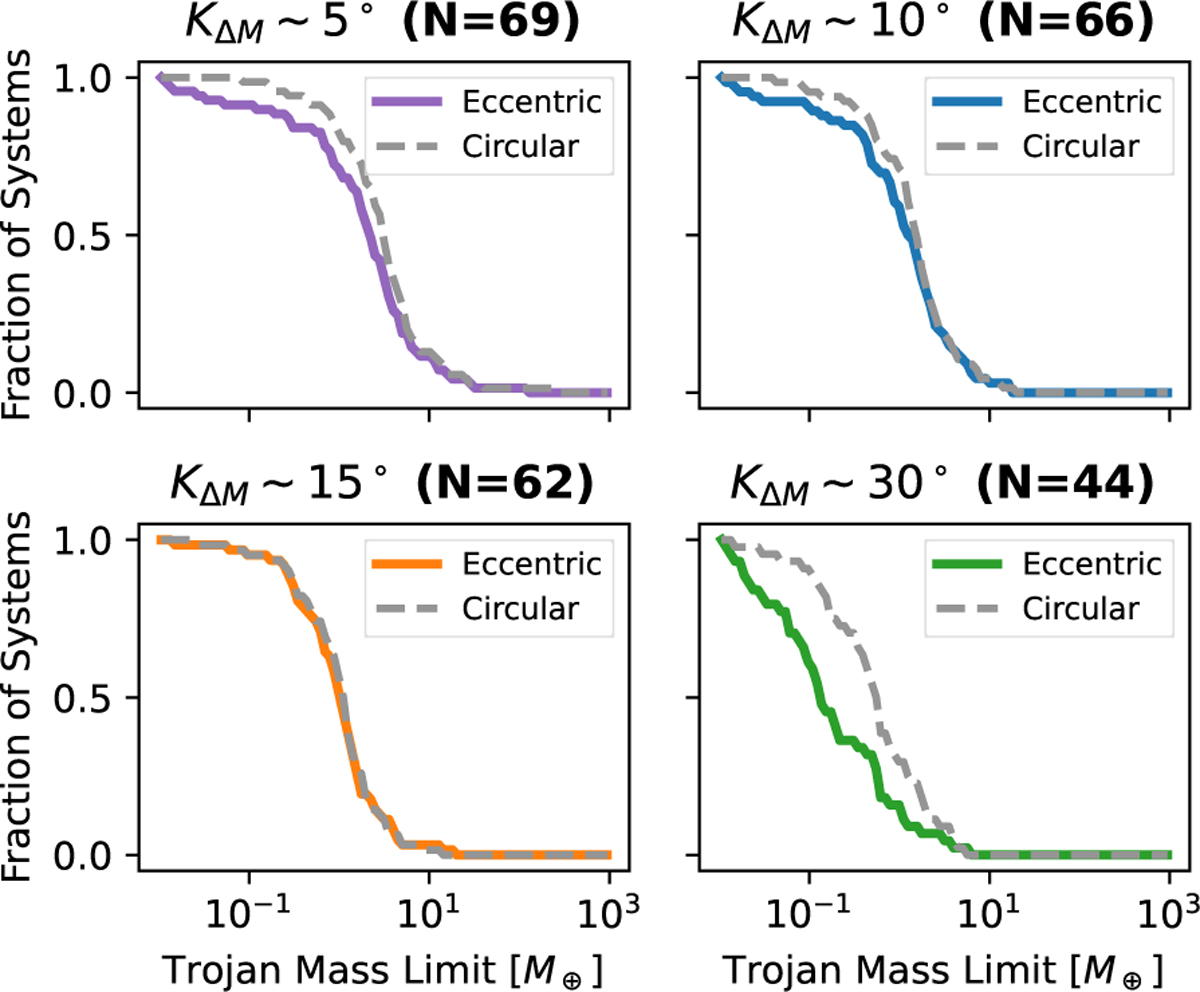
Cumulative probability distribution of the upper mass limit for a subset of systems with eccentricity e > 0.05. The dotted gray line represents the results assuming circular orbits, while the solid colored line shows the results using the measured eccentricities. The inclusion of eccentricity generally tightens the mass constraints. Similar to Fig. 7, systems that are dynamically unstable at the tested libration amplitudes are excluded.
Current usage metrics show cumulative count of Article Views (full-text article views including HTML views, PDF and ePub downloads, according to the available data) and Abstracts Views on Vision4Press platform.
Data correspond to usage on the plateform after 2015. The current usage metrics is available 48-96 hours after online publication and is updated daily on week days.
Initial download of the metrics may take a while.