Fig. 8.
Download original image
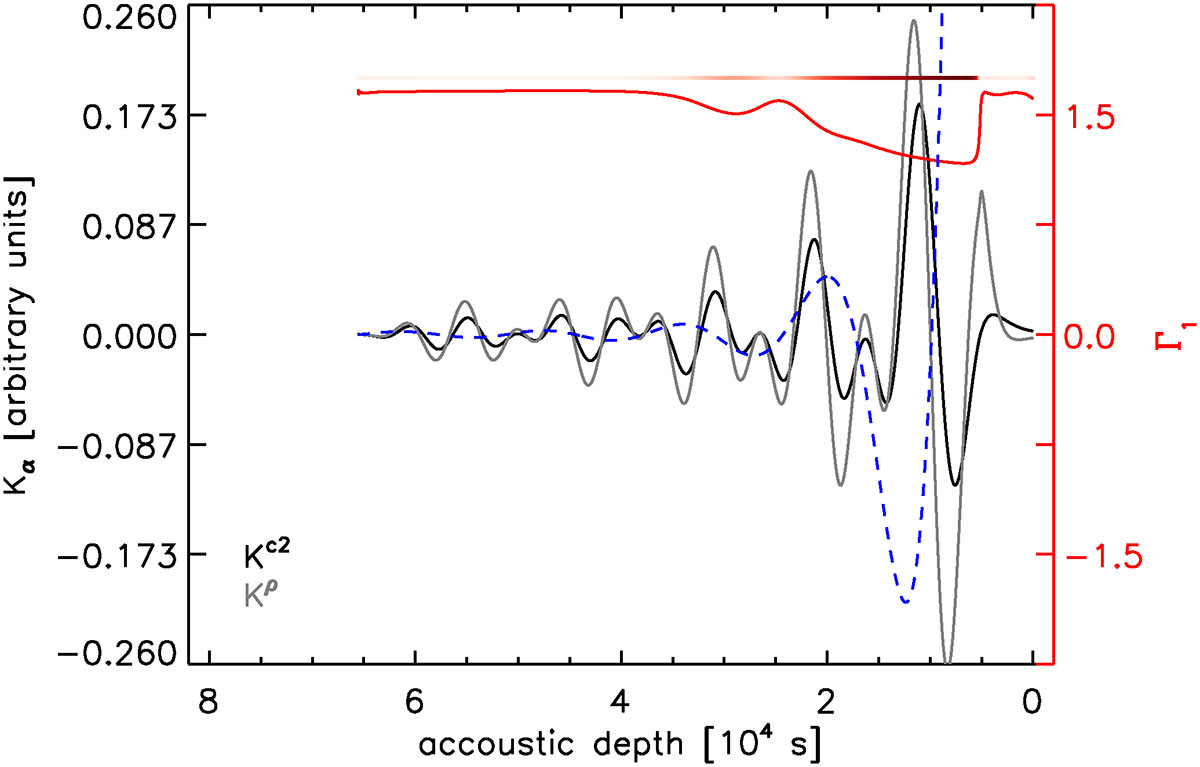
Kernels for α (![]() ) as a function of acoustic depth (black and grey) for a 1 M⊙ model with a νmax of about 76 μHz. For comparison, we also show Γ1, the first adiabatic exponent in red, as well as its deviation from 5/3 in the colour code just above it. For comparison, the dashed blue curve shows the radial eigenfunction of the radial mode closest to νmax in arbitrary units.
) as a function of acoustic depth (black and grey) for a 1 M⊙ model with a νmax of about 76 μHz. For comparison, we also show Γ1, the first adiabatic exponent in red, as well as its deviation from 5/3 in the colour code just above it. For comparison, the dashed blue curve shows the radial eigenfunction of the radial mode closest to νmax in arbitrary units.
Current usage metrics show cumulative count of Article Views (full-text article views including HTML views, PDF and ePub downloads, according to the available data) and Abstracts Views on Vision4Press platform.
Data correspond to usage on the plateform after 2015. The current usage metrics is available 48-96 hours after online publication and is updated daily on week days.
Initial download of the metrics may take a while.